Field Notes
<--2013-10-02 13:00:00 | 2013-10-24 08:00:00-->Other sites visited today: Sherman Island | Mayberry | Twitchell Rice | DWR Corn | West Pond
Phenocam link: Searching...
Twitchell Alfalfa: 2013-10-16 13:15:00 (DOY 289)
Author: Cove Sturtevant
Others: Joe, Laurie, Pascal
Summary: Cut alfalfa baled and removed. Standard field work. Switched radiation program. Need to replace LED sensor (Red channels funny). Need to add another solar panel to power flux tower.
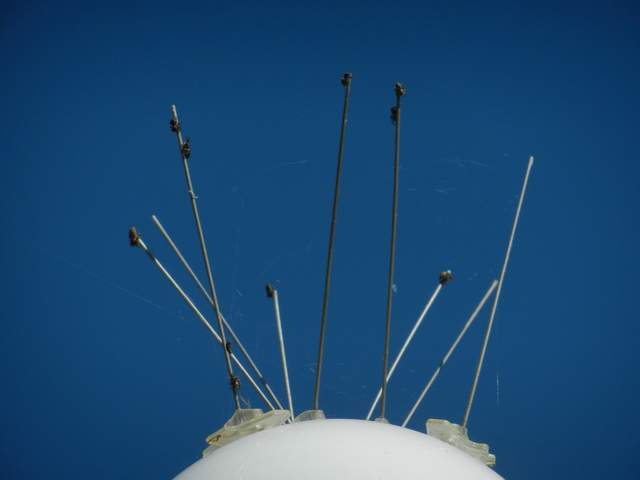
| Twitchell Alfalfa 2013-10-16 We arrived about 13:15 PDT. It was sunny, warm (26 C), and calm. The cut alfalfa has been baled and removed, and the new growth is kicking right along. There were little spiders everywhere! They were perched on top of all the spikes on the 7700 hat waiting for a puff of wind to parachute them off to their web making dreams. We had dropped off Laurie earlier to do spectral, LAI, and clip plots. We joined her to download data and maintain the tower. Meanwhile, Laurie took veg height measurements. Joe switched the LED sensors on the radiation 10x to a single-ended configuration, also changing the program. The LED redout channel had been seeming low, but after switching to single-ended the Redin channel looked low. Plan is to bring another sensor to swap out next week. I washed the radiation solar panel and tilted it back toward the south. After looking at the downloaded flux data, Joe noted that the single panel we have running the tower isnt cutting it anymore. We need to add another panel next week. 7500 readings: CO2 = 381 ppm (399 after cleaning) H2O = 335 mmol m-3 (370 after cleaning) SS = 71.9% (74.9 % after cleaning) T = 26.5 C p = 101.9 kPa sos = 348.8 m s-1 7700 readings: CH4: 2.5 ppm (2 ppm after cleaning) RSSI: 4% (79% after cleaning) Reservoir was empty refilled and changed settings to clean every 3 hours instead of every hour. MET looked good. Washed solar panel and clipped veg around it. There was no water in the well. |
Veg Height (cm): Tape measure from ground to top of plant
24, 17, 33, 22, 32, 14, 12, 14, 30, 15, 31, 22, 29, 6, 20, 13, 14, 13, 47, 14, avg = 21.1, stdev = 9.95
1 photos found

201310146TA_SpidersOnSpikes.jpg ( 2013-10-16 13:44:58 ) Full size: 1920x1440
Tiny spiders ballooning off of the bird spikes
7 sets found
Can't check TA_met
11 TA_met graphs found
Can't check TA_rad
3 TA_rad graphs found
Can't check TA_flux
5 TA_flux graphs found
Can't check TA_soilco2
7 TA_soilco2 graphs found
No data found for TA_arable.
1 TA_cam graphs found
Can't check TATWBABCSB_cam

