Field Notes
<--2013-08-28 10:40:00 | 2013-09-11 13:30:00-->Other sites visited today: Sherman Island | Mayberry | DWR Corn | Twitchell Rice | West Pond
Phenocam link: Searching...
Twitchell Alfalfa: 2013-09-05 11:30:00 (DOY 248)
Author: Cove Sturtevant
Others: Joe, Laurie
Summary: Standard field measurements. Added spikes to 7700 hat. LED channel #3 might be a bit low, will check data. Otherwise, all good.
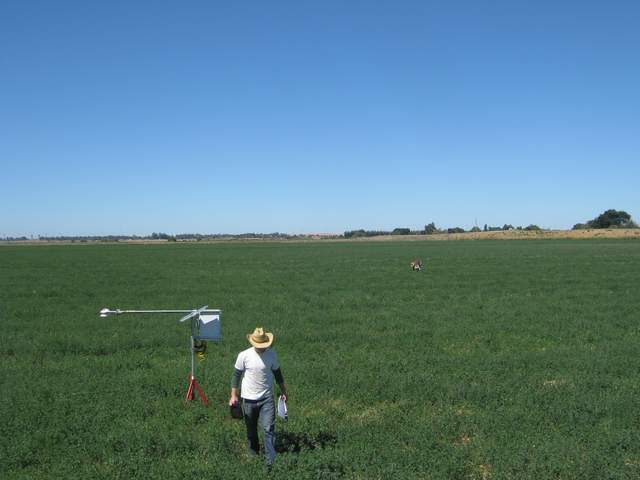
| Twitchell Alfalfa 2013-09-05 Joe and I met Laurie at the site at 11:30 PDT. We dropped her off previously to start field measurements while we added Franks 7700 to the wetland construction tower. It was sunny, breezy and warm. The alfalfa is beginning to flower again, about 40 cm high. I checked the tower readings while Laurie finished up LAI, clip plots, and spectral. Joe added spikes to the 7700 hat (while miraculously had no bird doodie on it) and cut down veg beginning to obstruct the solar panels. 7500 readings: CO2 = 384 ppm (395 after cleaning) H2O = 620 mmol m-3 (560 after cleaning) SS = 90.4% (93.5% after cleaning) T = 24.8 C p = 101.5 kPa sos = 348.2 m s-1 7700 readings: CH4: 1.86 ppm (same after cleaning) RSSI: 40% (80% after cleaning) The reservoir was about half full, but I think this is the way we left it last week. Joe topped it off. MET looked good. Radiation looked good, with the possible exception of LED input channel #3, which looked a bit low. I will check the data. |
1 photos found

TA_autocam_20130905_1045.jpg ( 2013-09-05 10:45:02 ) Full size: 1920x1440
Site visit
7 sets found
Can't check TA_met
11 TA_met graphs found
Can't check TA_rad
3 TA_rad graphs found
Can't check TA_flux
5 TA_flux graphs found
Can't check TA_soilco2
7 TA_soilco2 graphs found
No data found for TA_arable.
1 TA_cam graphs found
Can't check TATWBABCSB_cam

