Field Notes
<--2013-06-20 09:40:00 | 2013-07-10 11:30:00-->Other sites visited today: Sherman Island | Mayberry | West Pond | Twitchell Alfalfa | DWR Corn
Phenocam link: Searching...
Twitchell Rice: 2013-06-27 10:15:00 (DOY 178)
Author: Cove Sturtevant
Others: Laurie, Yanel
Summary: Cut down swath of cattails near tower. Standard fieldwork. All good.
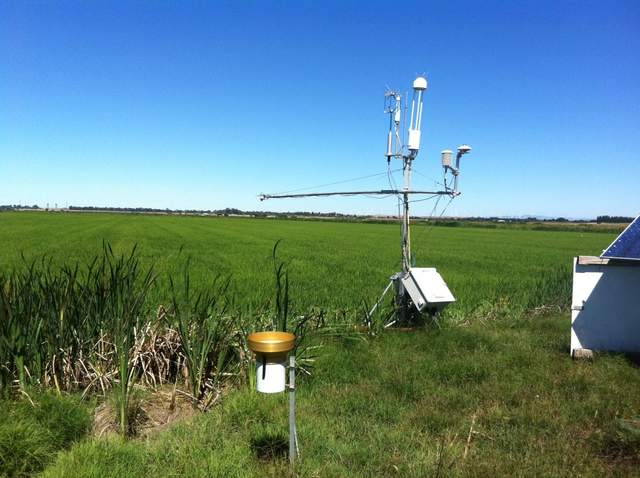
| Twitchell Rice 2013-06-27 We arrived about 10:15 PDT. It was warm/hot (25.5 C), sunny, and humid with a nice breeze. The rice continues to grow steadily, currently about knee high if standing in the water. There is a swath of ~chest high cattails growing along the margins where the field was not plowed. I cut down this swath in the direct vicinity of the tower (see photo) to avoid upward flow and unrepresentative radiation/ground sensor readings. Laurie and Yanel did spectra measurements and clip plots. I downloaded data and attended to the tower. 7500 readings: CO2 = 387 ppm (400 after cleaning) H2O = 920 mmol m-3 (820 after cleaning) signal strength = 75.6% (78.5% after cleaning) t = 25.2 C p = 102.2 kPa sos = 349.7 m s-1 7700 readings: CH4 = 1.8 ppm (same after cleaning) RSSI = 41.5 (bumped to 72 after cleaning) Topped off the reservoir (was about full). MET looked good, including the DO probe (reading about 4 mV). I cleaned some spider webs from the sonic and 7700. I also cleaned the radiation instruments. The net radiometer had some bird poop on it. Checked clock settings on the 7550: A-OK. |
2 photos found

20130627TW_cutdowncattails.jpg ( 2013-06-27 10:30:00 ) Full size: 1296x968
Cattails cut down

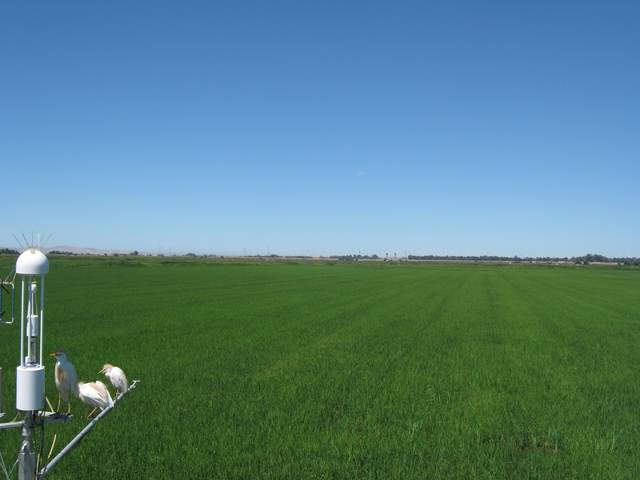
TW_autocam_20130628_1015.jpg ( 2013-06-28 10:15:02 ) Full size: 1920x1440
Egrets on the tower, leavs me sour
6 sets found
12 TW_met graphs found
5 TW_flux graphs found
Can't check TWSI_mixed
Can't check SIMBTWEE_met
1 TW_cam graphs found
Can't check TATWBABCSB_cam

