Field Notes
<--2013-03-14 09:30:00 | 2013-03-28 09:30:00-->Other sites visited today: Mayberry | Twitchell Rice | West Pond | DWR Corn
Phenocam link: Searching...
Sherman Island: 2013-03-21 09:30:00 (DOY 80)
Author: Cove Sturtevant
Others: Susie
Summary: Tested calibration of rain gauge, replaced #3 thermocouple rod. All good.
| Sherman
2013-03-21 We arrived about 09:30 PDT. It was cool and windy. The ground under the bridge on the way in remains cracked and dry. This was a maintenance trip. First, we tested the TE525 rain gauge bucket by running 16 fl. oz. of water through the funnel over about 30 minutes. About 10 mm of rainfall should have been recorded. I checked the logger output, and the 0900 time slot recorded 10.16 mm of rain. We were doing other things while our slow drip system (i.e. milk jug with tiny hole) did its thing, so we should be sure to check the 0930 slot when we download the data to be sure more wasn’t recorded in the next half hour. Second task was to replace the #3 thermocouple rod (2-32 cm depths) since the -32 cm depth was reading –INF. I accidentally dug up the #1 rod (0-50 cm depths) so we replaced it and repacked the dirt, then correctly switched out the #3 rod. New rod had all good readings after install. I should note that the new thermocouple rod is a more slim design than the previous. The new design is a plastic rod with a thin rubber sleeve over the thermocouples attached to the outside, while the previous design (and still present in #1 & #2 rods) encases the thermocouples inside a ~1" diameter pvc tube. There was a fire recently to the west, but there was no evidence of soot on the instruments. We cleaned all flux instruments regardless. LGR readings: 120.0 Torr (adjusted to 143 Torr), 16.82 us, 10 Hz, 1.89 ppm 7500 readings: CO2: 16.6 mmol m-3 H2O: 340 mmol m-3 diag: 248 MET looked good. |
1 photos found

SI_autocam_20130321_0745.jpg ( 2013-03-21 07:45:02 ) Full size: 1920x1440
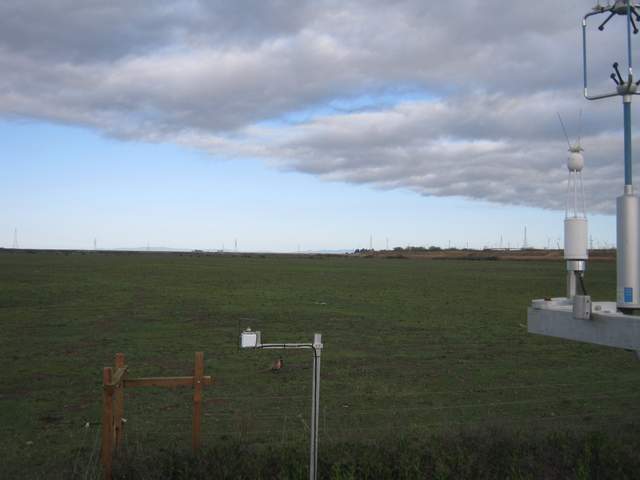
Ring necked phesant
7 sets found
No data found for SI_mp.
11 SI_met graphs found
Can't check SI_mixed
2 SI_mixed graphs found
4 SI_flx graphs found
3 SI_soilco2 graphs found
Can't check TWSI_mixed
Can't check SIMBTWEE_met

