Field Notes
<--2013-02-27 10:30:00 |
2013-03-13 10:00:00-->
Other sites visited today:
Vaira |
Tonzi
Phenocam link:
Searching...Tonzi: 2013-03-13 09:00:00 (DOY 72)
Author: Siyan Ma
Others: Joe
Summary: Standard field work.
When: Date: 3/13/2013 , Day: 072 ,
Watch Time: 9:00 am .
Where: Tonzi/Vaira Ranch
Who: Siyan Joe
Weather: sunny, warm
Phenology:
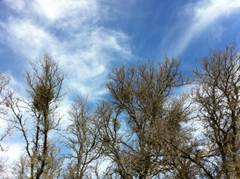 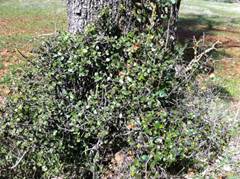
Figure 1. no-leaf on oak trees, but Joe found two ‘evergreen’ oak
trees near the soil CO2 fencing area. Shrubs had new leaves. About 11 cows
around.
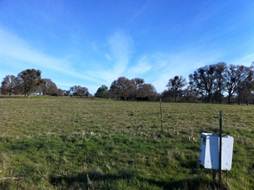 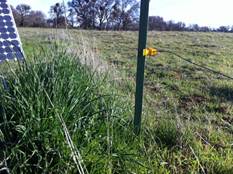
Figure 2. notice difference in grass
appearance between those in and out fence at Vaira. About 40 cows around the water
hole.
|
Summary
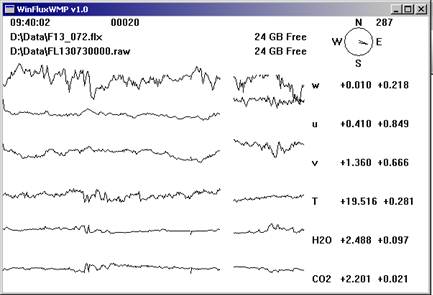
- Checked and downloaded data from PC at Tower, Floor. At
Floor, 10Hz raw data recorded by PC WinFlux had naming problem, skipping
Day 60. Would check next visit. Others worked well.
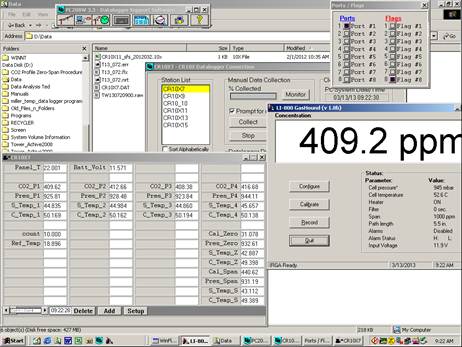
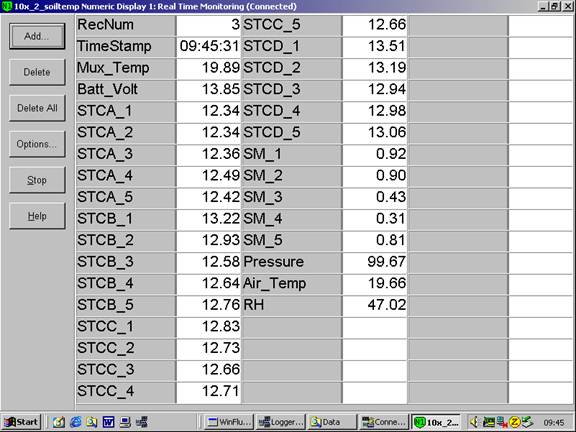
- Joe downloaded data at Vaira and got screen shops by
connecting to each datalogger directly.
- Joe swapped memory cards of CR1000s at three sites.
- Joe upgraded Tower PC, replacing PC208W with
LoggerNet. So, PC can talk to CR1000.
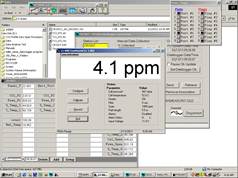
- Calibrated CO2 profile system; Zero and span seemed
not stable.
- Collected grass at Vaira in and out of fence to check
grazing effects
- Read dendrometers
- Measured soil moisture
- Measure groundwater well:
Date
|
DOY
|
Location
|
Depth without the black thing (feet)
|
3/13/2013
|
72
|
Floor
|
26.3
|
|
|
Tower
|
31.6
|
|
|
Roadside
|
36.6
|
Vaira_Grass Site
- Fence and gate power: 12 v.
- Panel and Batteries: - v; - amps;
- amps.
- Joe downloaded data at Vaira and got screen shops by
connecting to each datalogger directly and swapped the memory cards of
CR1000.
- Check the fans of air temp and relative humidity sensors
at Vaira. YES!
- Met data
- soil CO2 profile data
- Check levels of Radiation sensors, clear up surfaces.YES!
- Check rain gage, make sure not clogged. No!
- Closed gate and set up fence. YES!
- Collected grass at Vaira in and out of fence to check
grazing effects
Tonzi_Tower Site
- Fence and gate power: 12 v.
- Panel and Batteries: - v;
- amps; - amps.
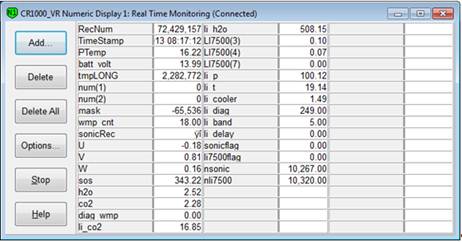
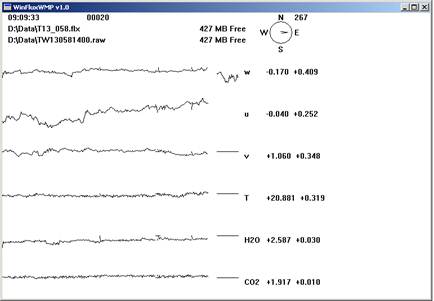
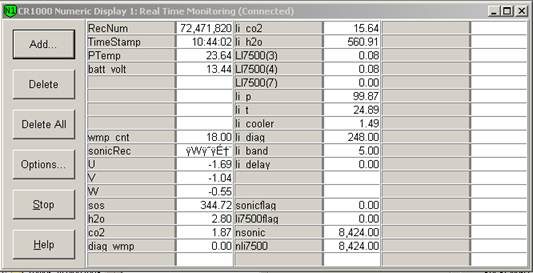
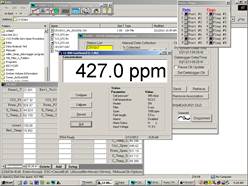
- Reading from Gillsonic screen before downloading data.
(The value of H2O and CO2 should be in the range of
0 – 5 v.)
- downloading data from PC.
- Swapped the memory cards of CR1000.
- check the fans of air temp. and relative humidity sensors
on the tower and the floor. Tower top not running
- Check rain gage, make sure not clogged. YES!
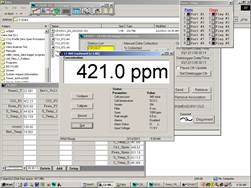
- Check calibration cylinders;
CO2 200 psig; flow 20 psi; 421.63 ppm.
N2 500 psig; flow 20 psi.
Is the pump running YES!
IRGA Calibration
zero
span
- close gate and set up fence. YES!
Toniz_Floor Site
- Fence and gate power: 12
v.
- Panel and Batteries: - v;
- amps; - amps.
- Reading from Gillsonic screen before downloading data.
(The value of H2O and CO2 should be in the range of
0 – 5 v.)
- downloading data from PC. YES!
- Swapped the memory cards of CR1000.
- Check MD-9 system connections YES!
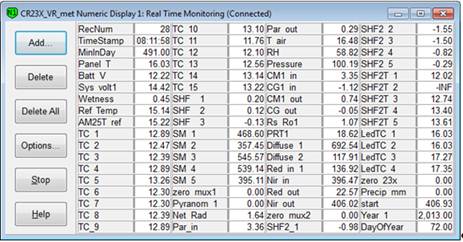
CR23X3 – floor-Met
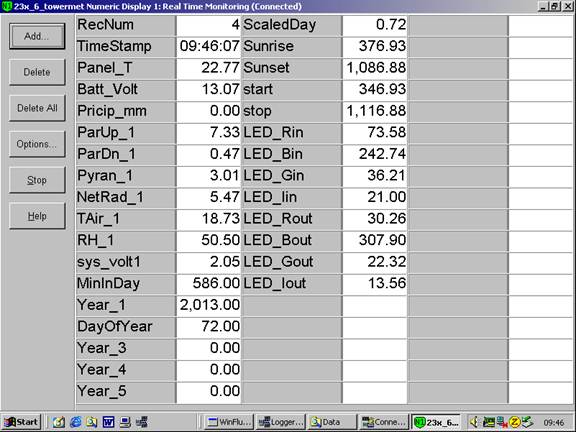
CR23X6 – tower-Met
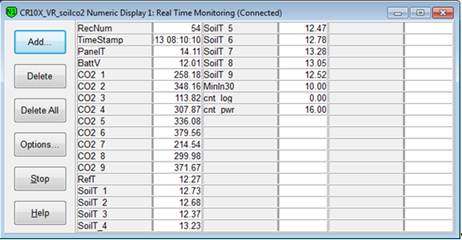
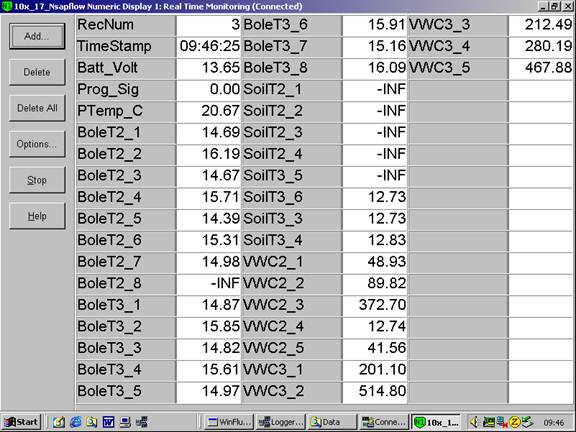
CR10X2 – floor-Met
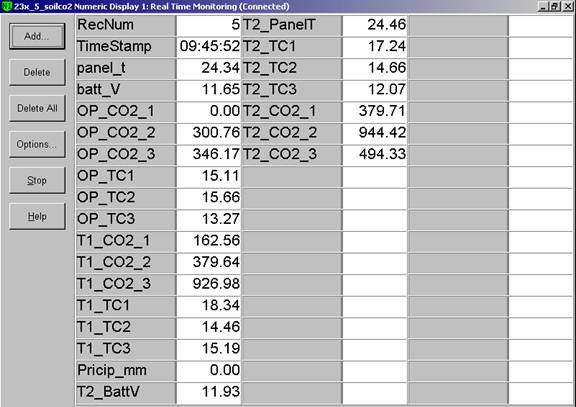
Soil CO2 profile: CR23X5
– soil CO2 profile

- Close gate and set up fence. YES!
Tonzi
|
|
|
|
Dendrometer
|
|
|
|
|
|
|
Date
|
Day
|
Tag
#
|
Reading (mm)
|
3/13/2013
|
72
|
1
|
24.1
|
|
|
2
|
18.1
|
|
|
3
|
20.5
|
|
|
4
|
4.5
|
|
|
5
|
24.1
|
|
|
7
|
17.5
|
|
|
8
|
8.8
|
|
|
72
|
14
|
|
|
79
|
14.2
|
|
|
102
|
16
|
|
|
245
|
12
|
tonzi
|
7931AFE
|
402165
|
574B4B
|
402FF3
|
574632
|
7A432E
|
7A3C6E
|
7A3B40
|
7A4AAA
|
3/13/2013
|
72
|
|
|
|
|
|
|
|
|
|
sm
|
|
|
|
|
|
|
|
|
0-15
|
30.0
|
13.2
|
37.6
|
14.4
|
16.6
|
21.2
|
21.2
|
14.7
|
14.1
|
15-30
|
34.0
|
22.5
|
28.3
|
31.6
|
25.1
|
19.4
|
27.1
|
28.9
|
14.8
|
30-45
|
40.3
|
37.4
|
38.8
|
38.4
|
45.2
|
20.9
|
26.2
|
31.0
|
30.7
|
45-60
|
37.3
|
54.3
|
63.5
|
45.4
|
39.7
|
25.9
|
37.4
|
45.1
|
25.9
|
|
|
|
|
|
|
|
|
|
|
|
A6D882B
|
A3D04E8
|
A6D72F5
|
|
|
|
|
|
|
|
|
|
|
|
|
|
|
|
|
0-15
|
22.0
|
20.0
|
13.3
|
|
|
|
|
|
|
15-30
|
25.2
|
10.0
|
26.1
|
|
|
|
|
|
|
30-45
|
32.7
|
31.0
|
32.7
|
|
|
|
|
|
|
45-60
|
40.8
|
48.0
|
48.7
|
|
|
|
|
|
|
|
|
|
|
|
|
|
|
|
|
vaira
|
7933dee
|
00000128B97F3
|
00000128B8072
|
00000128BDDE8
|
|
|
|
|
0-15
|
7.7
|
13.95
|
7.1
|
4.35
|
|
|
|
|
|
15-30
|
20.0
|
17.15
|
10.0
|
11.95
|
|
|
|
|
|
30-45
|
21.2
|
10.6
|
13.9
|
19.7
|
|
|
|
|
|
45-60
|
33.6
|
20.05
|
12.5
|
23.5
|
|
|
|
|
|
|
Field Data
No tank data
Well Depth
| Date | Location | Depth (feet) |
|---|
| 2013-03-13 | TZ_floor | 26.3 |
| 2013-03-13 | TZ_road | 36.6 |
| 2013-03-13 | TZ_tower | 31.6 |
No TZ Moisture Point data found
No VR Moisture Point data found
No TZ grass heigth found
No VR grass heigth found
Tree DBH
| Date | Tag# | Reading (mm) |
|---|
| 2013-03-13 | 1 | 24.1 |
| 2013-03-13 | 102 | 16 |
| 2013-03-13 | 2 | 18.1 |
| 2013-03-13 | 245 | 12 |
| 2013-03-13 | 3 | 20.5 |
| 2013-03-13 | 4 | 4.5 |
| 2013-03-13 | 5 | 24.1 |
| 2013-03-13 | 7 | 17.5 |
| 2013-03-13 | 72 | 14 |
| 2013-03-13 | 79 | 14.2 |
| 2013-03-13 | 8 | 8.8 |
No water potential data found
No TZ Grass Biomass data found
No TZ OakLeaves Biomass data found
No TZ PineNeedles Biomass data found
3 photos found
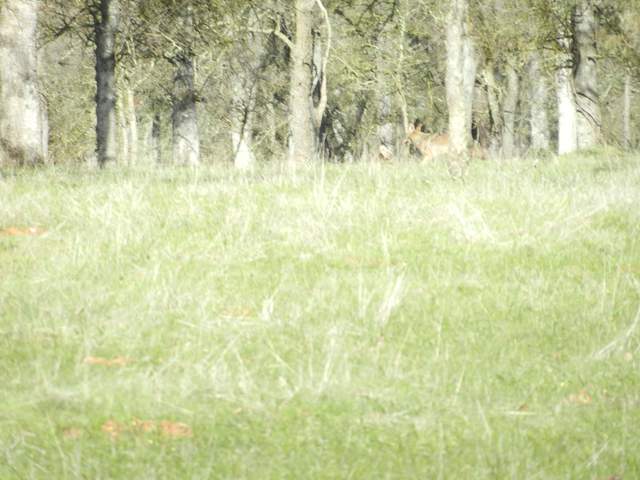
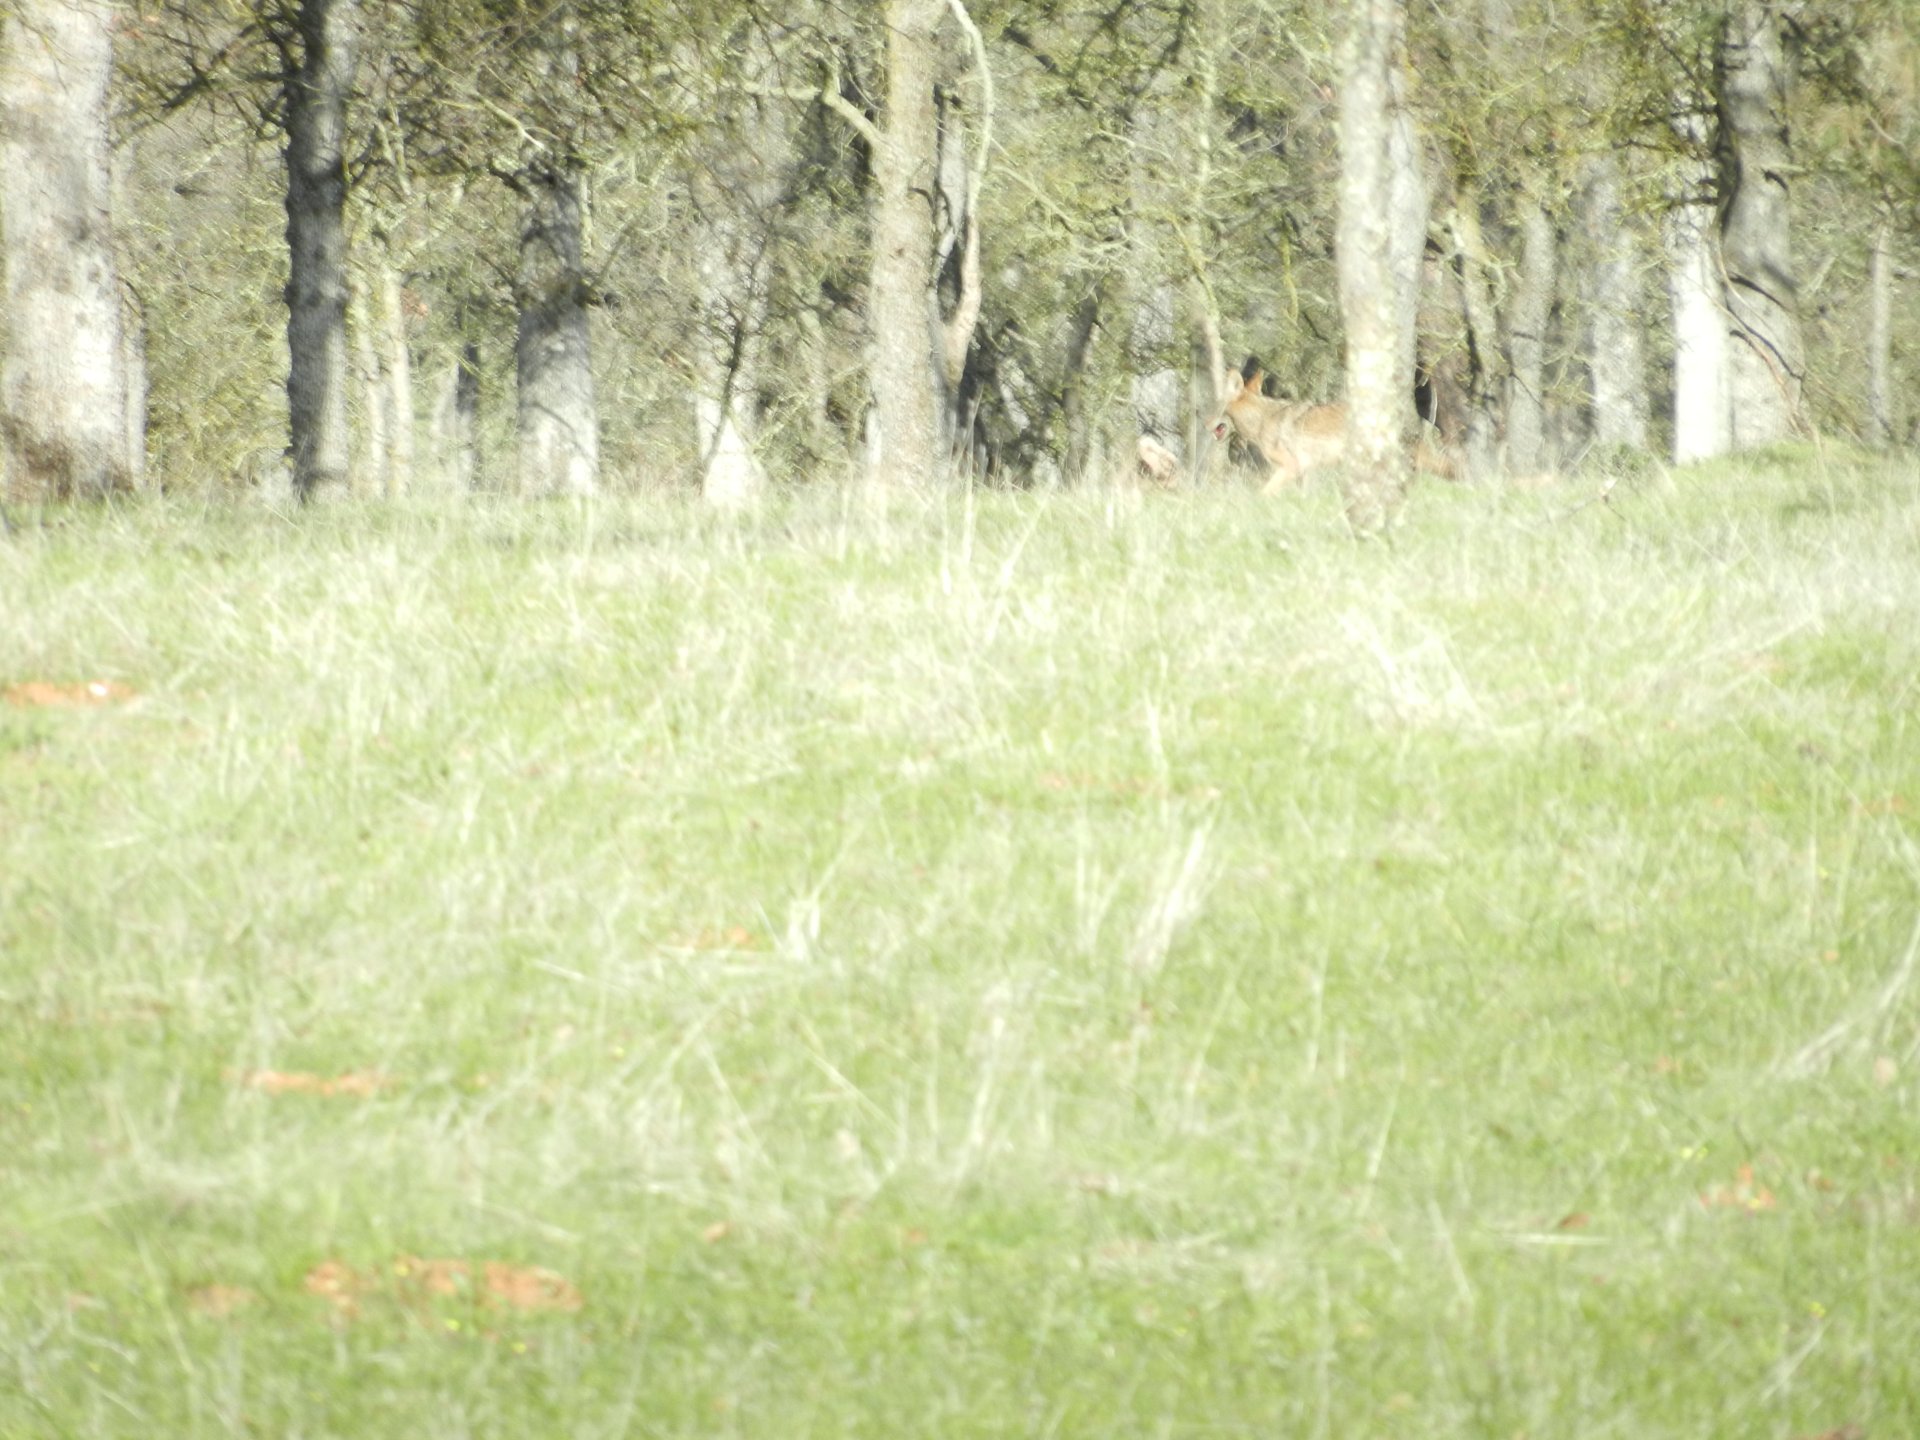
20130313TZ_Coyote.jpg ( 2013-03-13 10:05:43 ) Full size: 1920x1440
Coyote running off
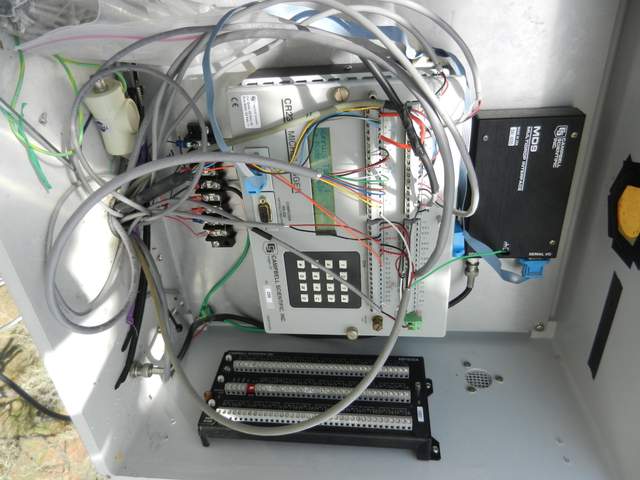
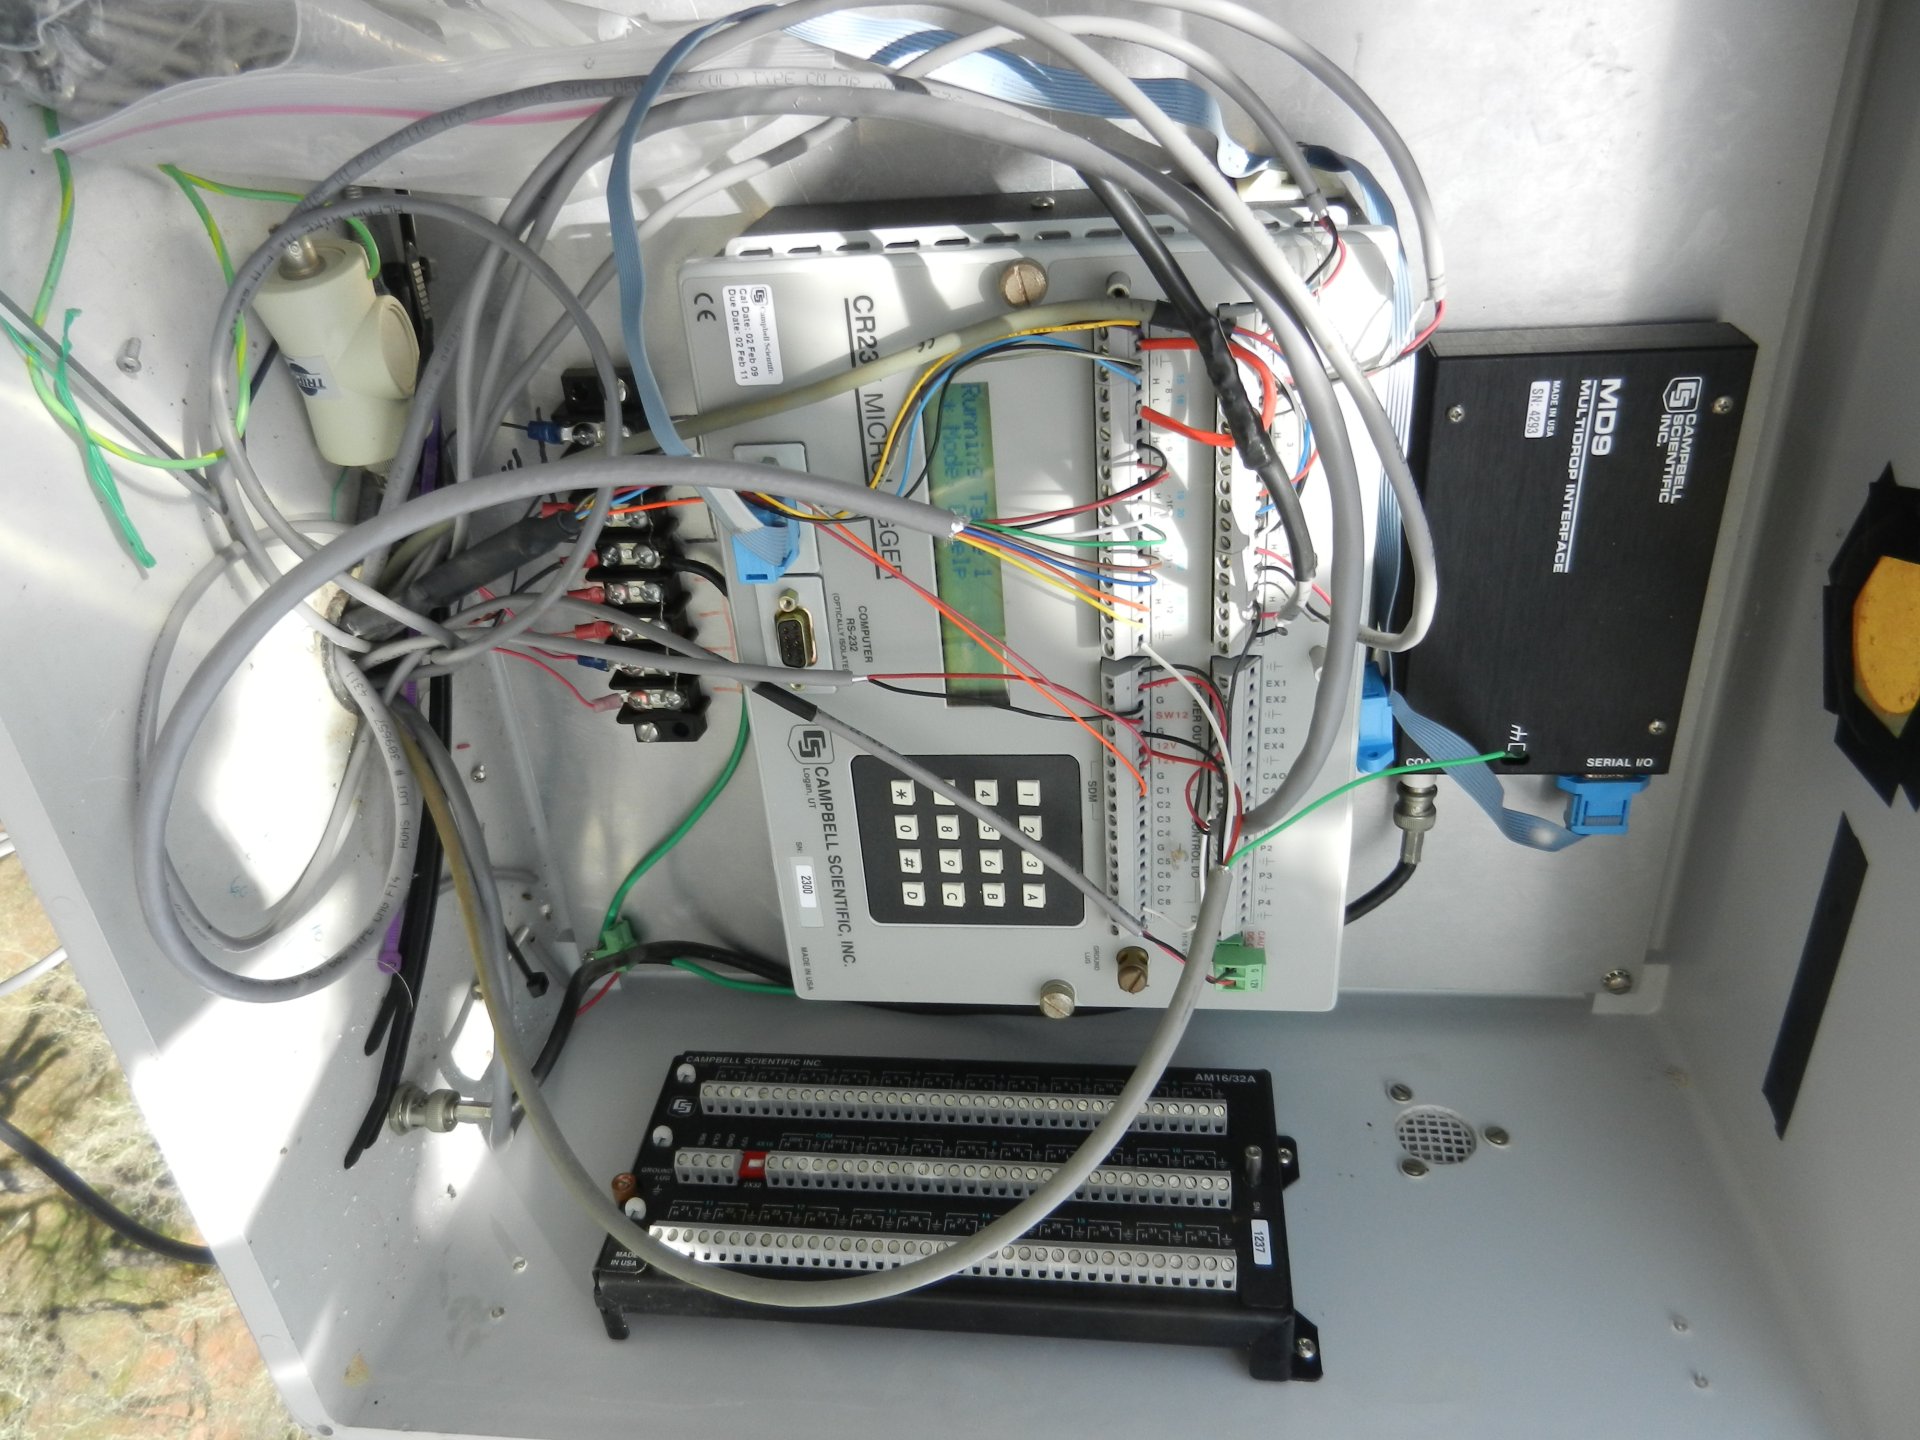
20130313TZ_Tower23X.jpg ( 2013-03-13 11:40:20 ) Full size: 1920x1440
Tower 23x data logger wiring

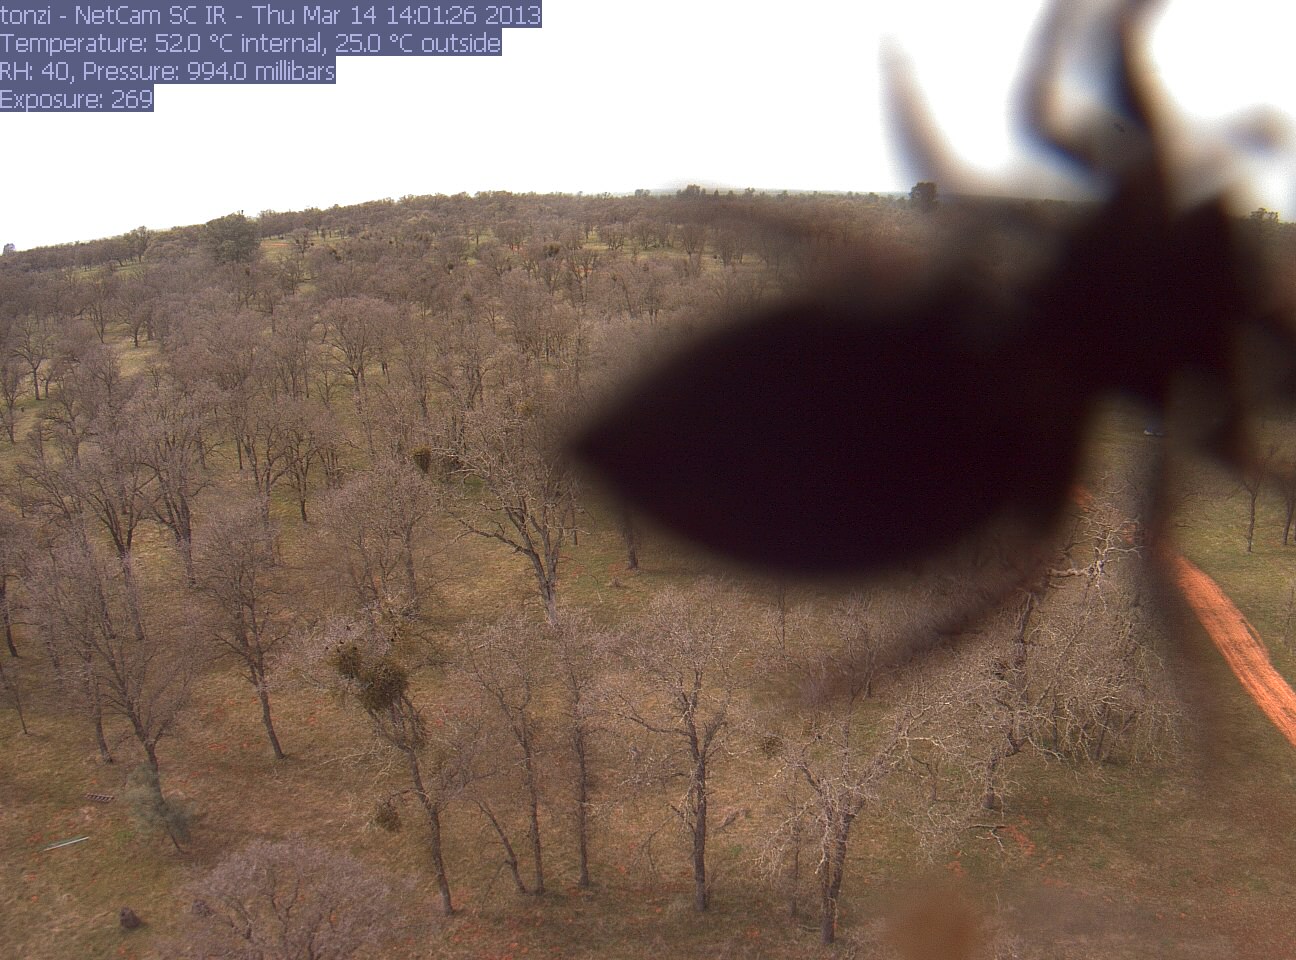
tonzi_2013_03_14_140117.jpg ( 2013-03-14 14:01:32 ) Full size: 1296x960
Spider
16 sets found
No data found for TZ_Fenergy.
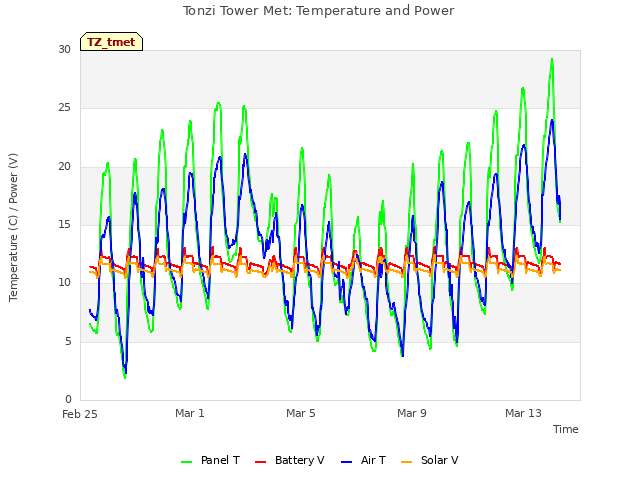
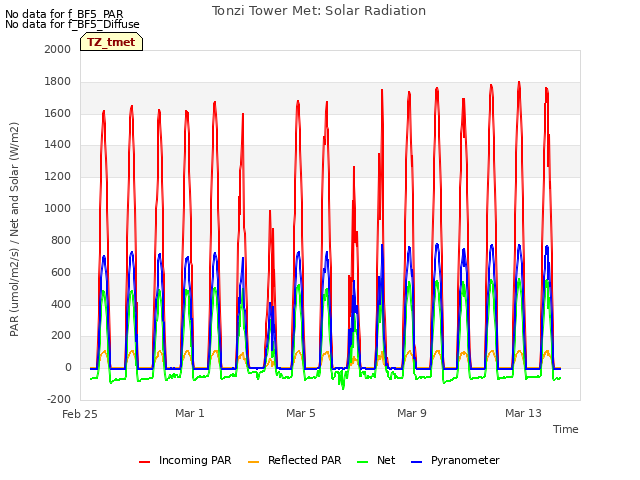
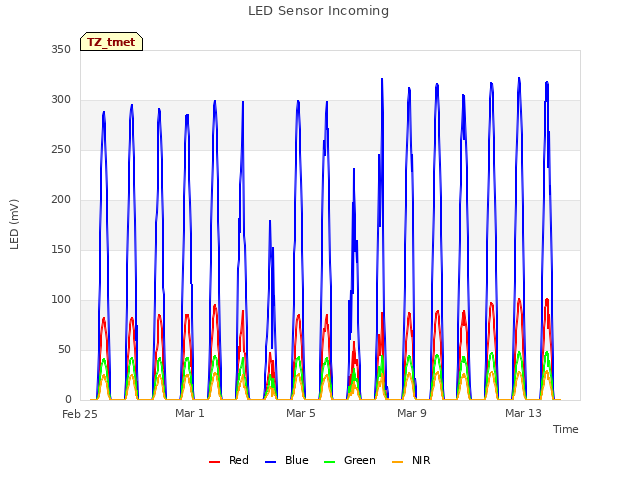
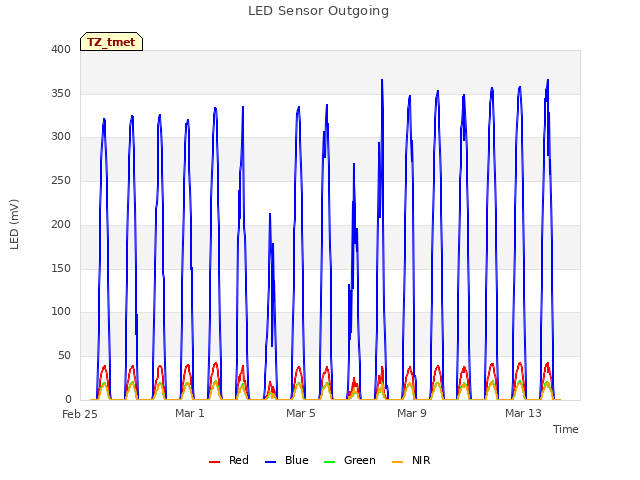
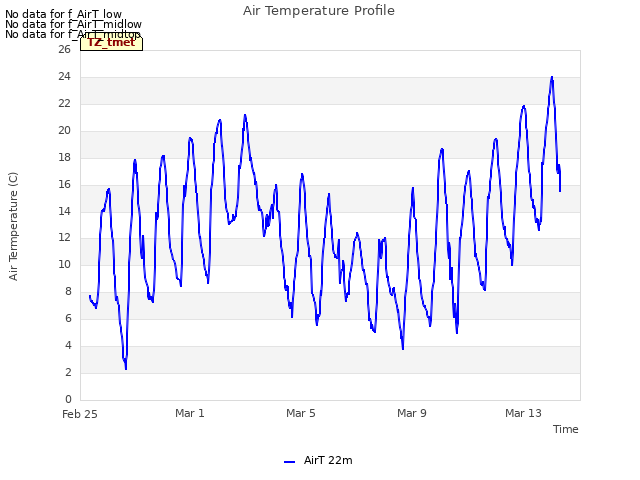
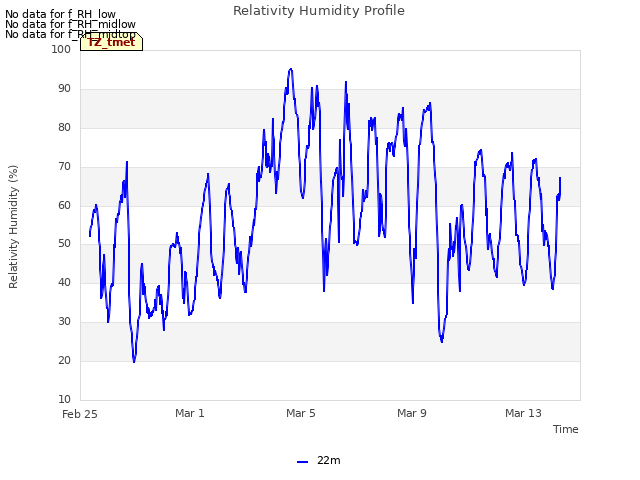
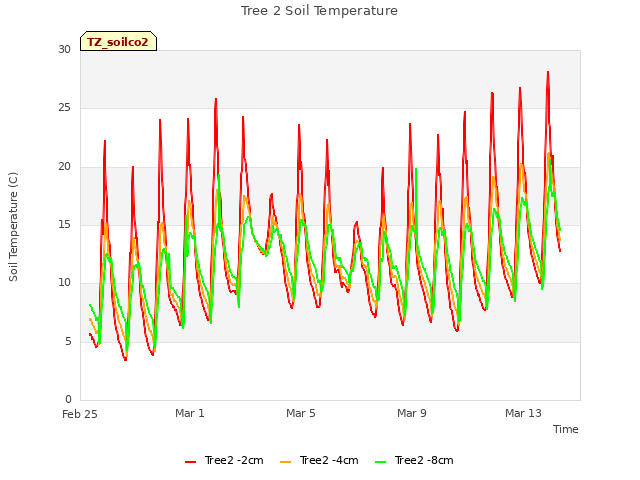
11 TZ_tmet graphs found


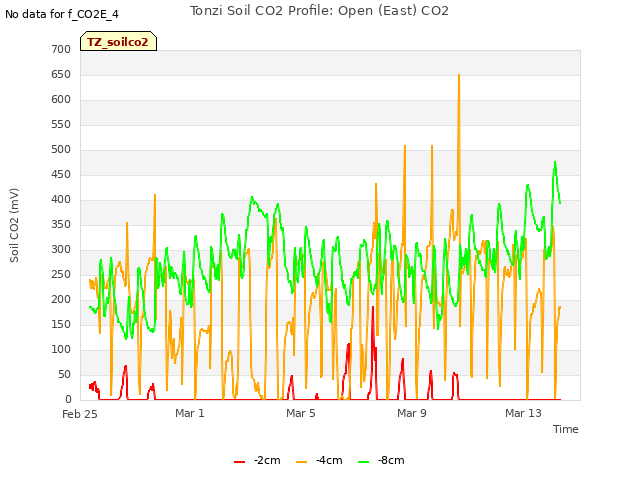
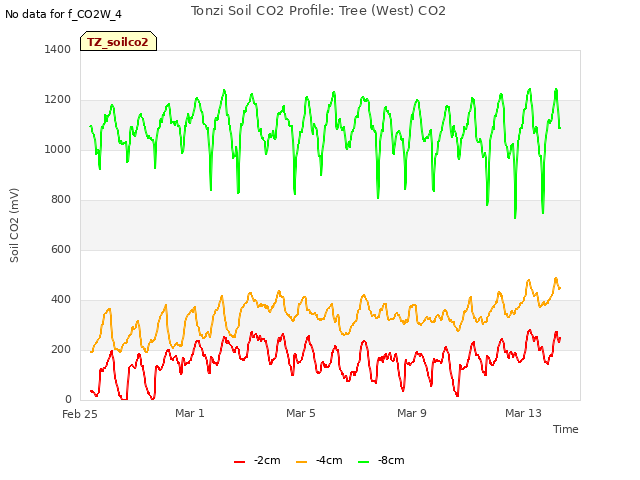
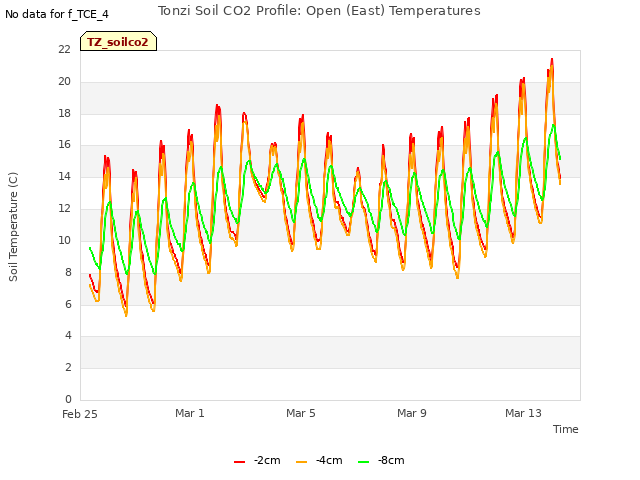
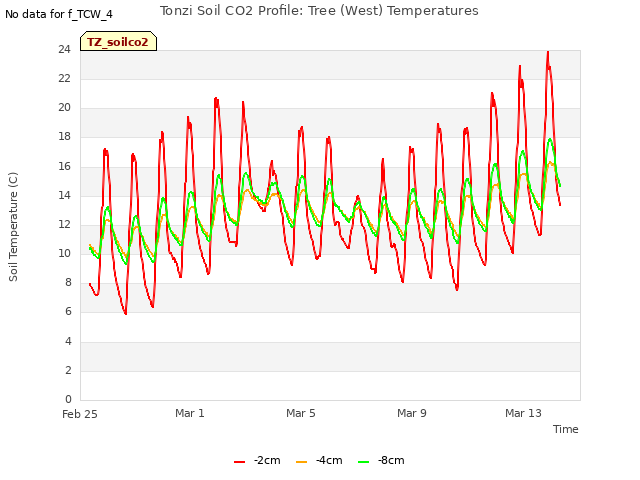
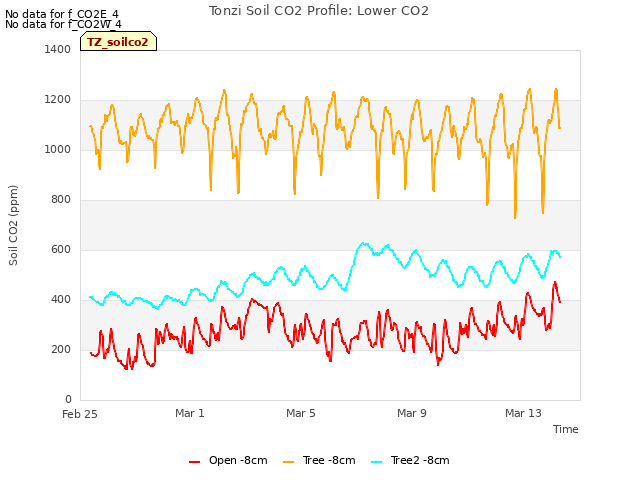
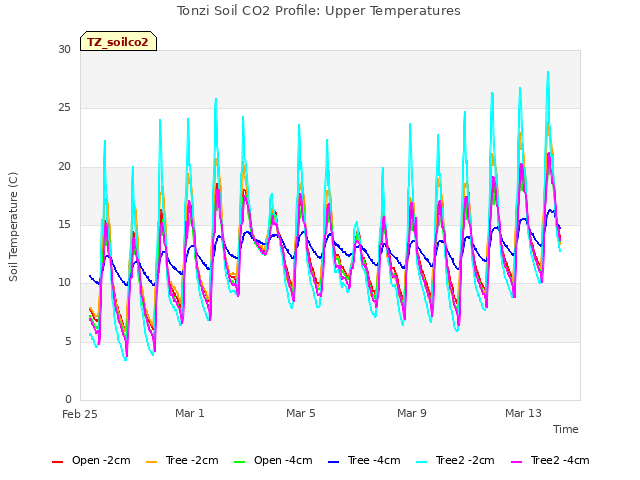
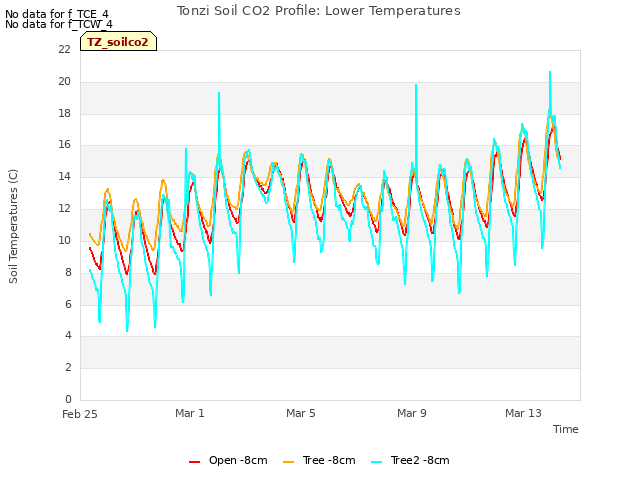
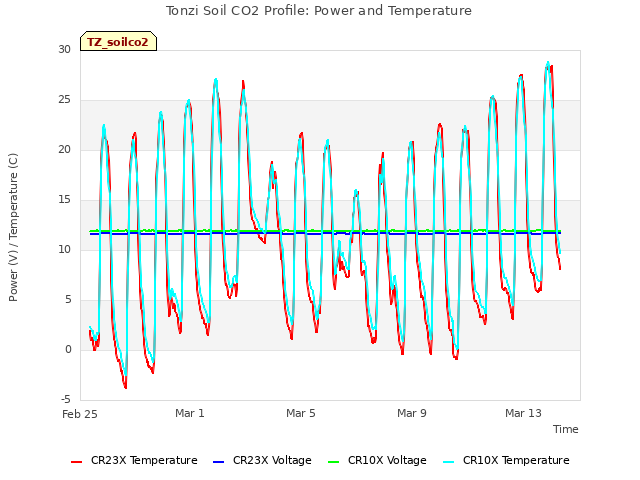
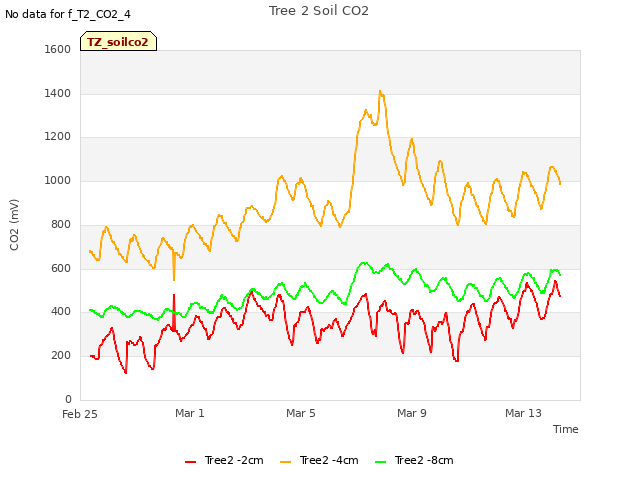
11 TZ_soilco2 graphs found
Can't check TZ_mixed
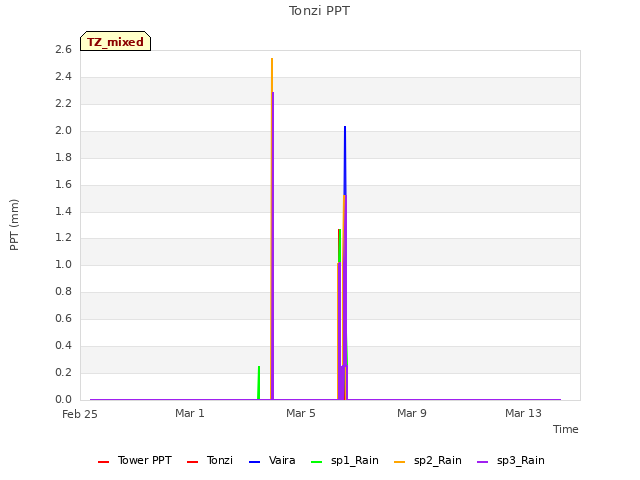
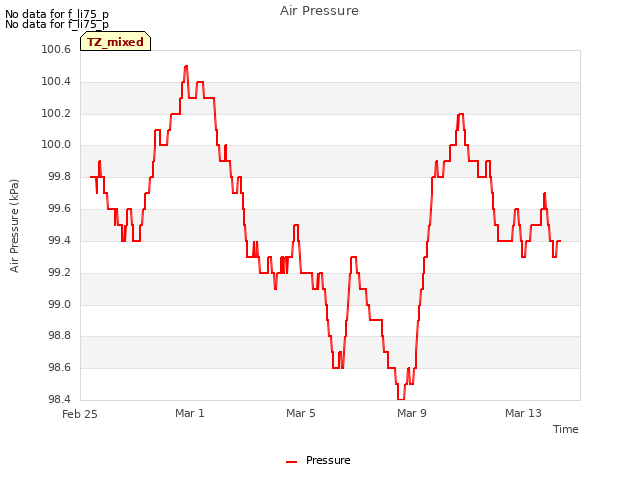
3 TZ_mixed graphs found

1 TZ_fflux graphs found

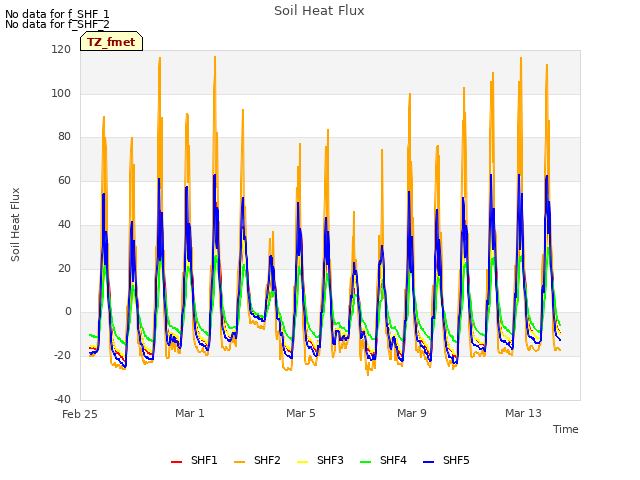
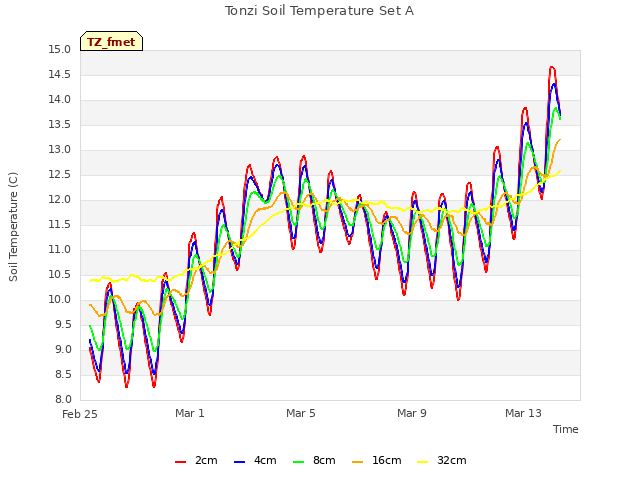
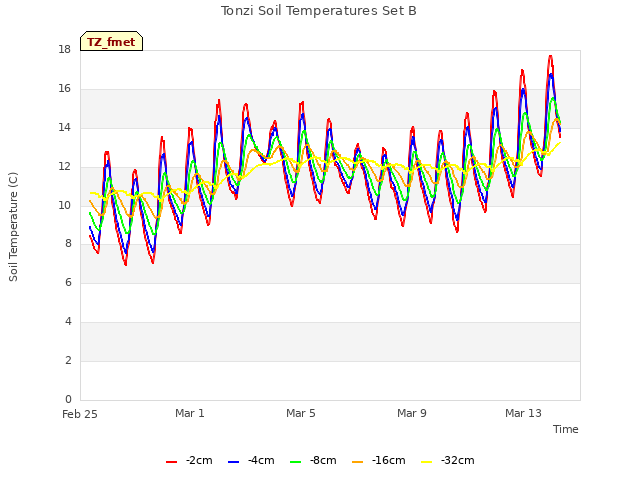
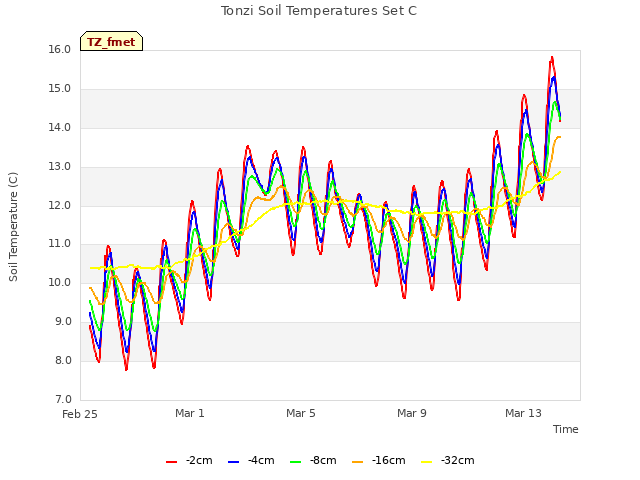
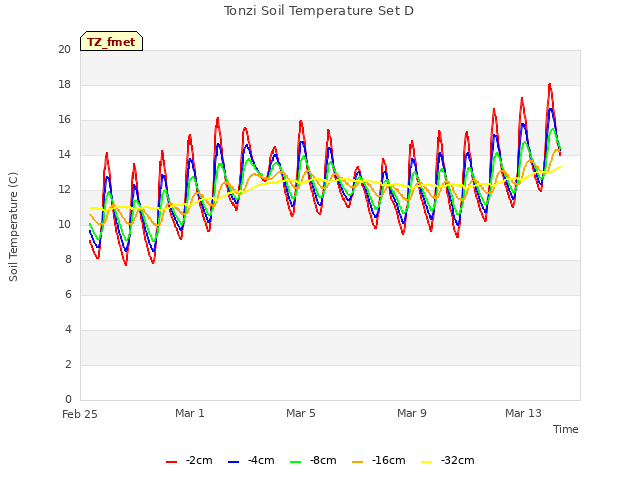
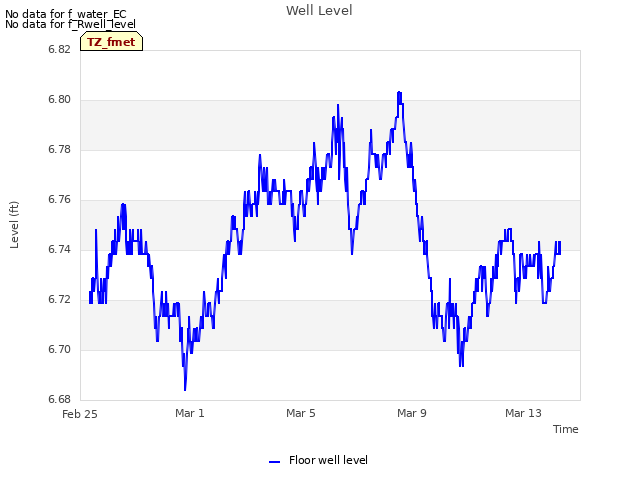
8 TZ_fmet graphs found


No data found for TZ_tram.
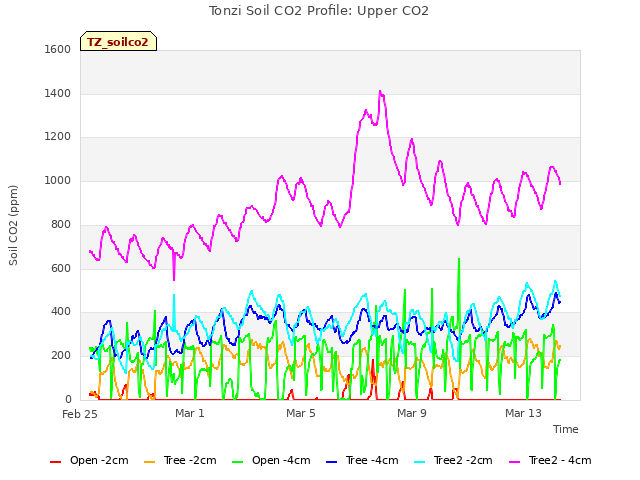
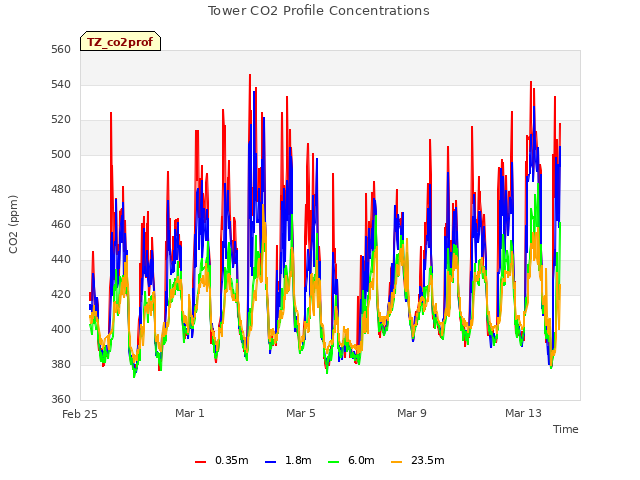
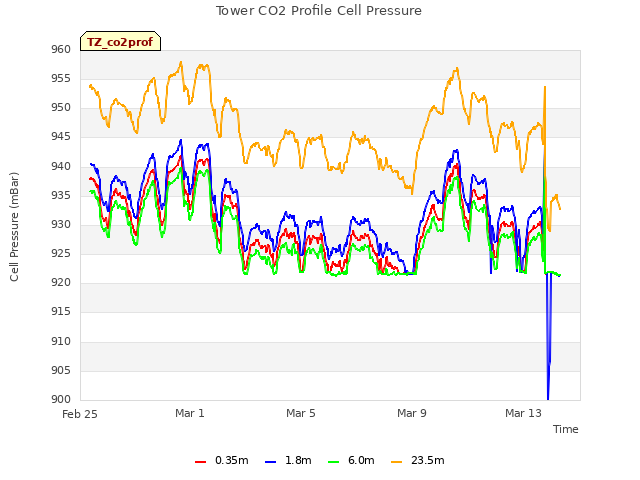
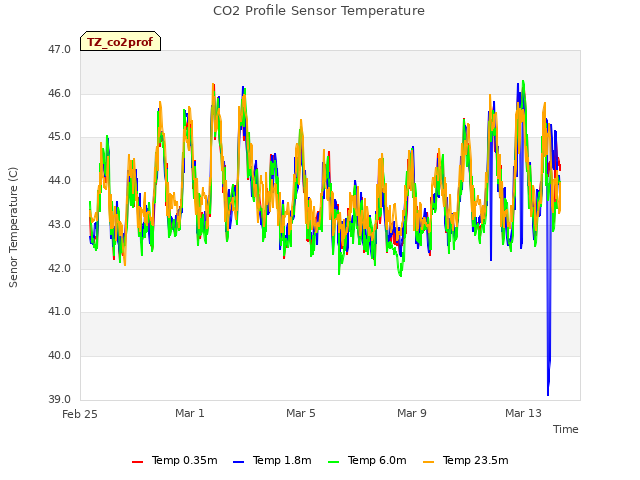
3 TZ_co2prof graphs found
No data found for TZ_irt.
No data found for TZ_windprof.
1 TZ_tflux graphs found

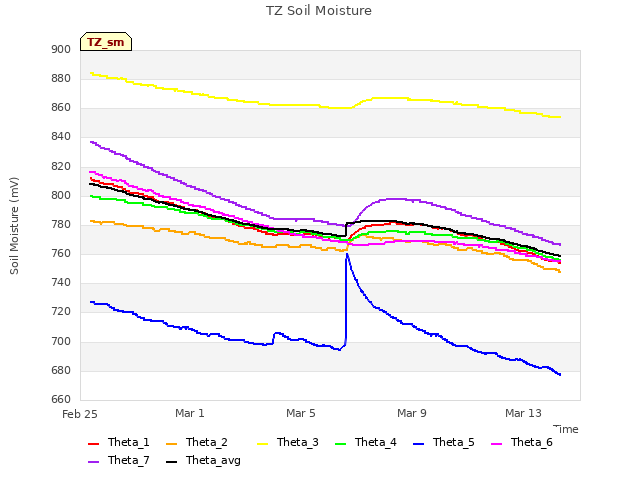
2 TZ_sm graphs found

Can't check TZ_met
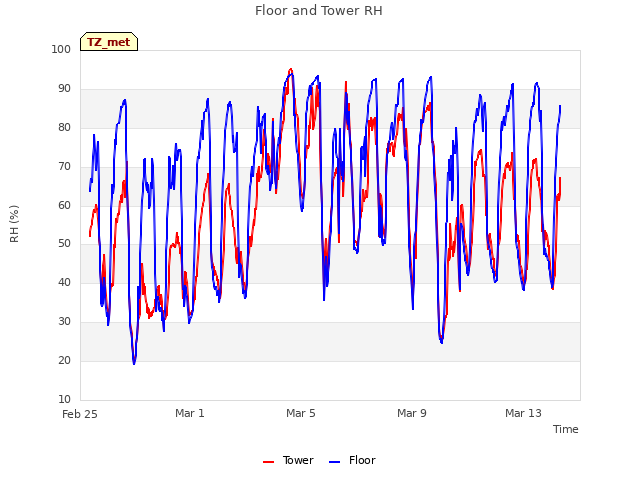
1 TZ_met graphs found
Can't check TZVR_mixed
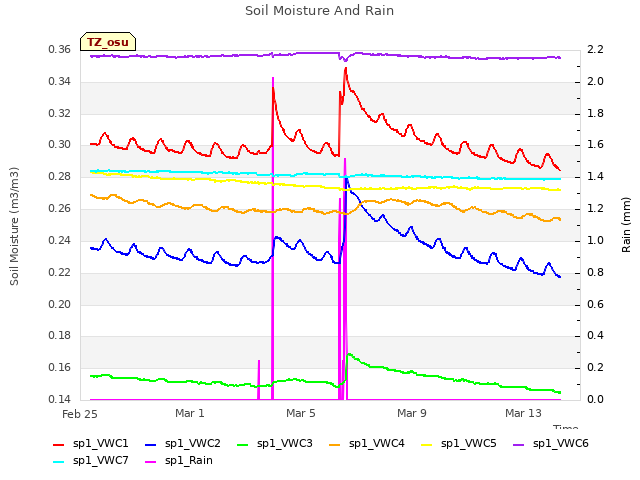
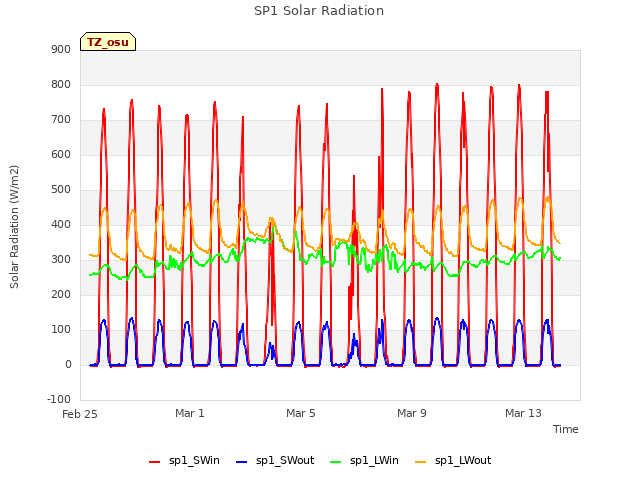
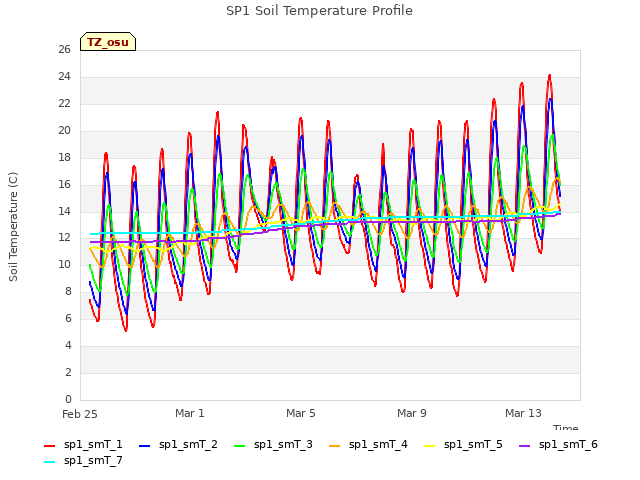
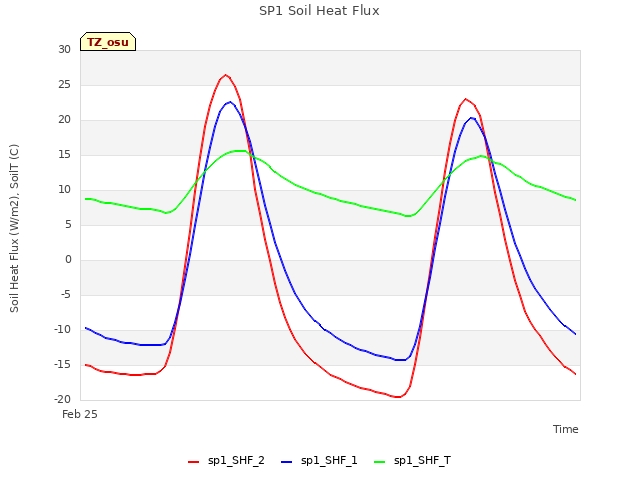
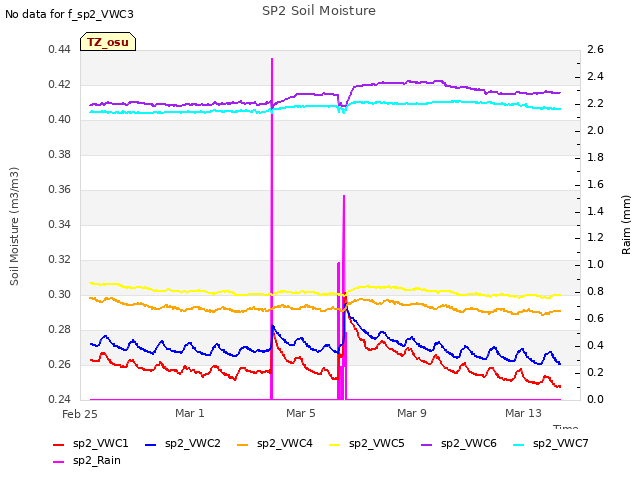
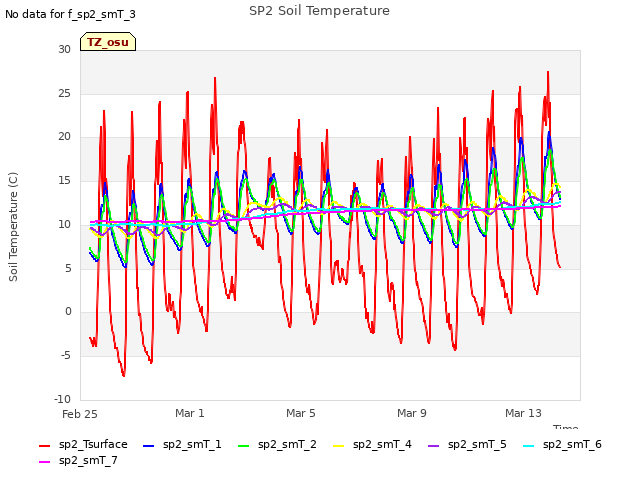
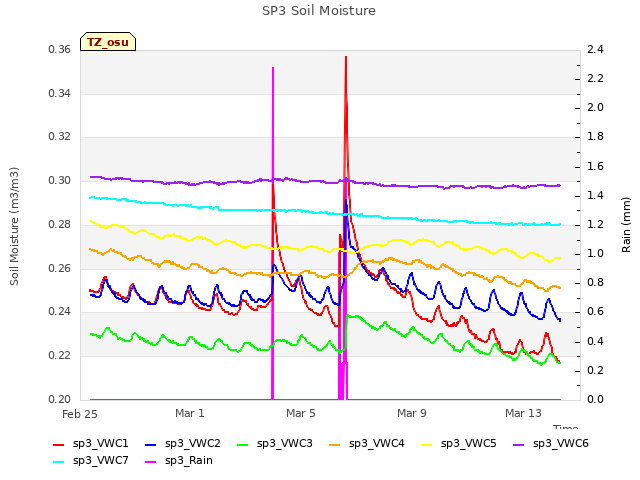
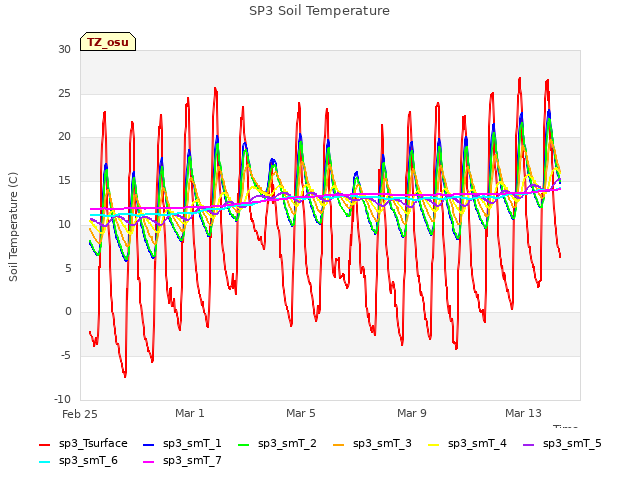
8 TZ_osu graphs found
No data found for TZ_fd.
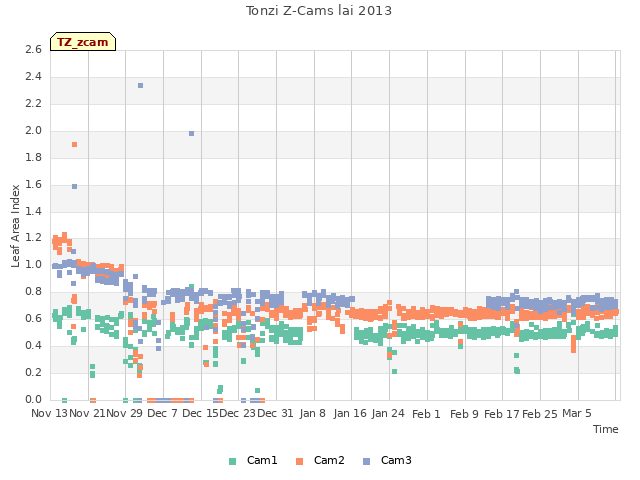
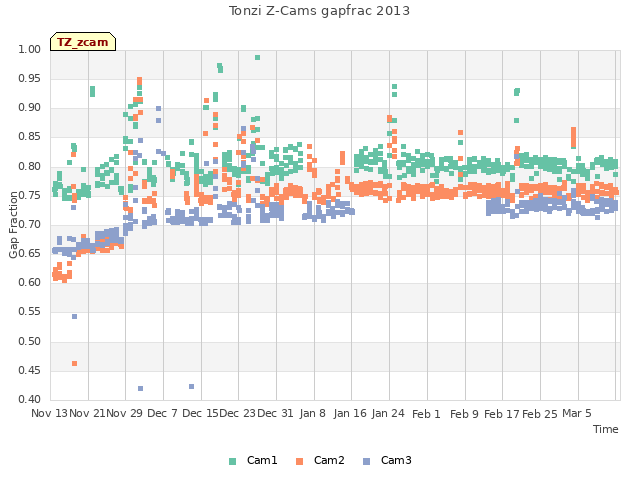
Tonzi Z-cam data