
Field Notes
<--2013-03-13 09:00:00 | 2013-03-27 10:00:00-->Other sites visited today: Vaira | Tonzi
Phenocam link: Searching...
Tonzi: 2013-03-13 10:00:00 (DOY 72)
Author: Joe Verfaillie
Others: Siyan
Summary: Standard fieldwork, added AM16/32 to tower 23x box, swapped co2 profile filter near IRGA, tried tram but wheels too narrow, upgraded tower computer to Loggernet, things look dry for this time of year.
| Tonzi
2013-03-13 I arrived about 10am PDT with Siyan. It was clear, sunny and warm with little to no wind. There was patchy fog in the Delta and Central Valley on the way up. The grass in the entire area looks dry and over grazed. The low spot in the road near the tower still has some standing water. I found a couple trees near the soil CO2 fence that still have a sprinkling of mature, healthy looking leaves that apparently were not lost in the fall. I put the tram back on the track, but when it started to run the drive wheels were too narrow in a few spots. I brought it back in for another try. It would also be good to get the weight off the motors and on some bearings instead. The CO2 profile system seemed to be running okay. However, I swapped out the plastic filter in the box with a stainless steel 2um filter. We will see if this keeps the IRGA cleaner. I added an AM16/32 (sn 1237) to the tower CR23X box in preparation for adding the new diffuse PAR and 4-band radiometers next time. I cleaned the radiometers but they were pretty clean to begin with. The hmp45 fan at the tower top was not running. I connected a serial line to the Tower CR1000. However, the old PC208W cannot talk to CR1000s so I setup Loggernet to talk to the CR1000 and the Tram and then CO2 Profile data loggers. I also had to change the daily rename MD9 programs that were set up as tasks in PC208W. These now run as daily rename batch files from the Windows Task Manager. The CR1000 data is not being transferred to the computer. I swapped the card on the CR1000. The D drive on the computer is running out of space again. It was down to about 500MB. I need to move off some old data again – there’s data back to 2008 on the drive. I cleaned the windows on the z-cams. I removed the card from the Floor CR1000 and uploaded a new program. The new program is driven by the sonic timing but does a better job writing the 30min data. After the new program was running I inserted in a new card. The tram has five 10ft sections. I think we should be able to break it into two pieces to move it. The junctions between the 10ft sections are a little sloppy and could be redone. There are screw in tie downs under each tripod. I could build a better stand for the solar panels and batteries. The panels are BP US20X and about 16x20 inches. I pulled two fences posts near the water potential table relatively easily by hand, so the ground is still pretty soft. |
Field Data
No tank data
Well Depth
| Date | Location | Depth (feet) |
|---|---|---|
| 2013-03-13 | TZ_floor | 26.3 |
| 2013-03-13 | TZ_road | 36.6 |
| 2013-03-13 | TZ_tower | 31.6 |
No TZ Moisture Point data found
No VR Moisture Point data found
No TZ grass heigth found
No VR grass heigth found
Tree DBH
| Date | Tag# | Reading (mm) |
|---|---|---|
| 2013-03-13 | 1 | 24.1 |
| 2013-03-13 | 102 | 16 |
| 2013-03-13 | 2 | 18.1 |
| 2013-03-13 | 245 | 12 |
| 2013-03-13 | 3 | 20.5 |
| 2013-03-13 | 4 | 4.5 |
| 2013-03-13 | 5 | 24.1 |
| 2013-03-13 | 7 | 17.5 |
| 2013-03-13 | 72 | 14 |
| 2013-03-13 | 79 | 14.2 |
| 2013-03-13 | 8 | 8.8 |
No water potential data found
No TZ Grass Biomass data found
No TZ OakLeaves Biomass data found
No TZ PineNeedles Biomass data found
3 photos found
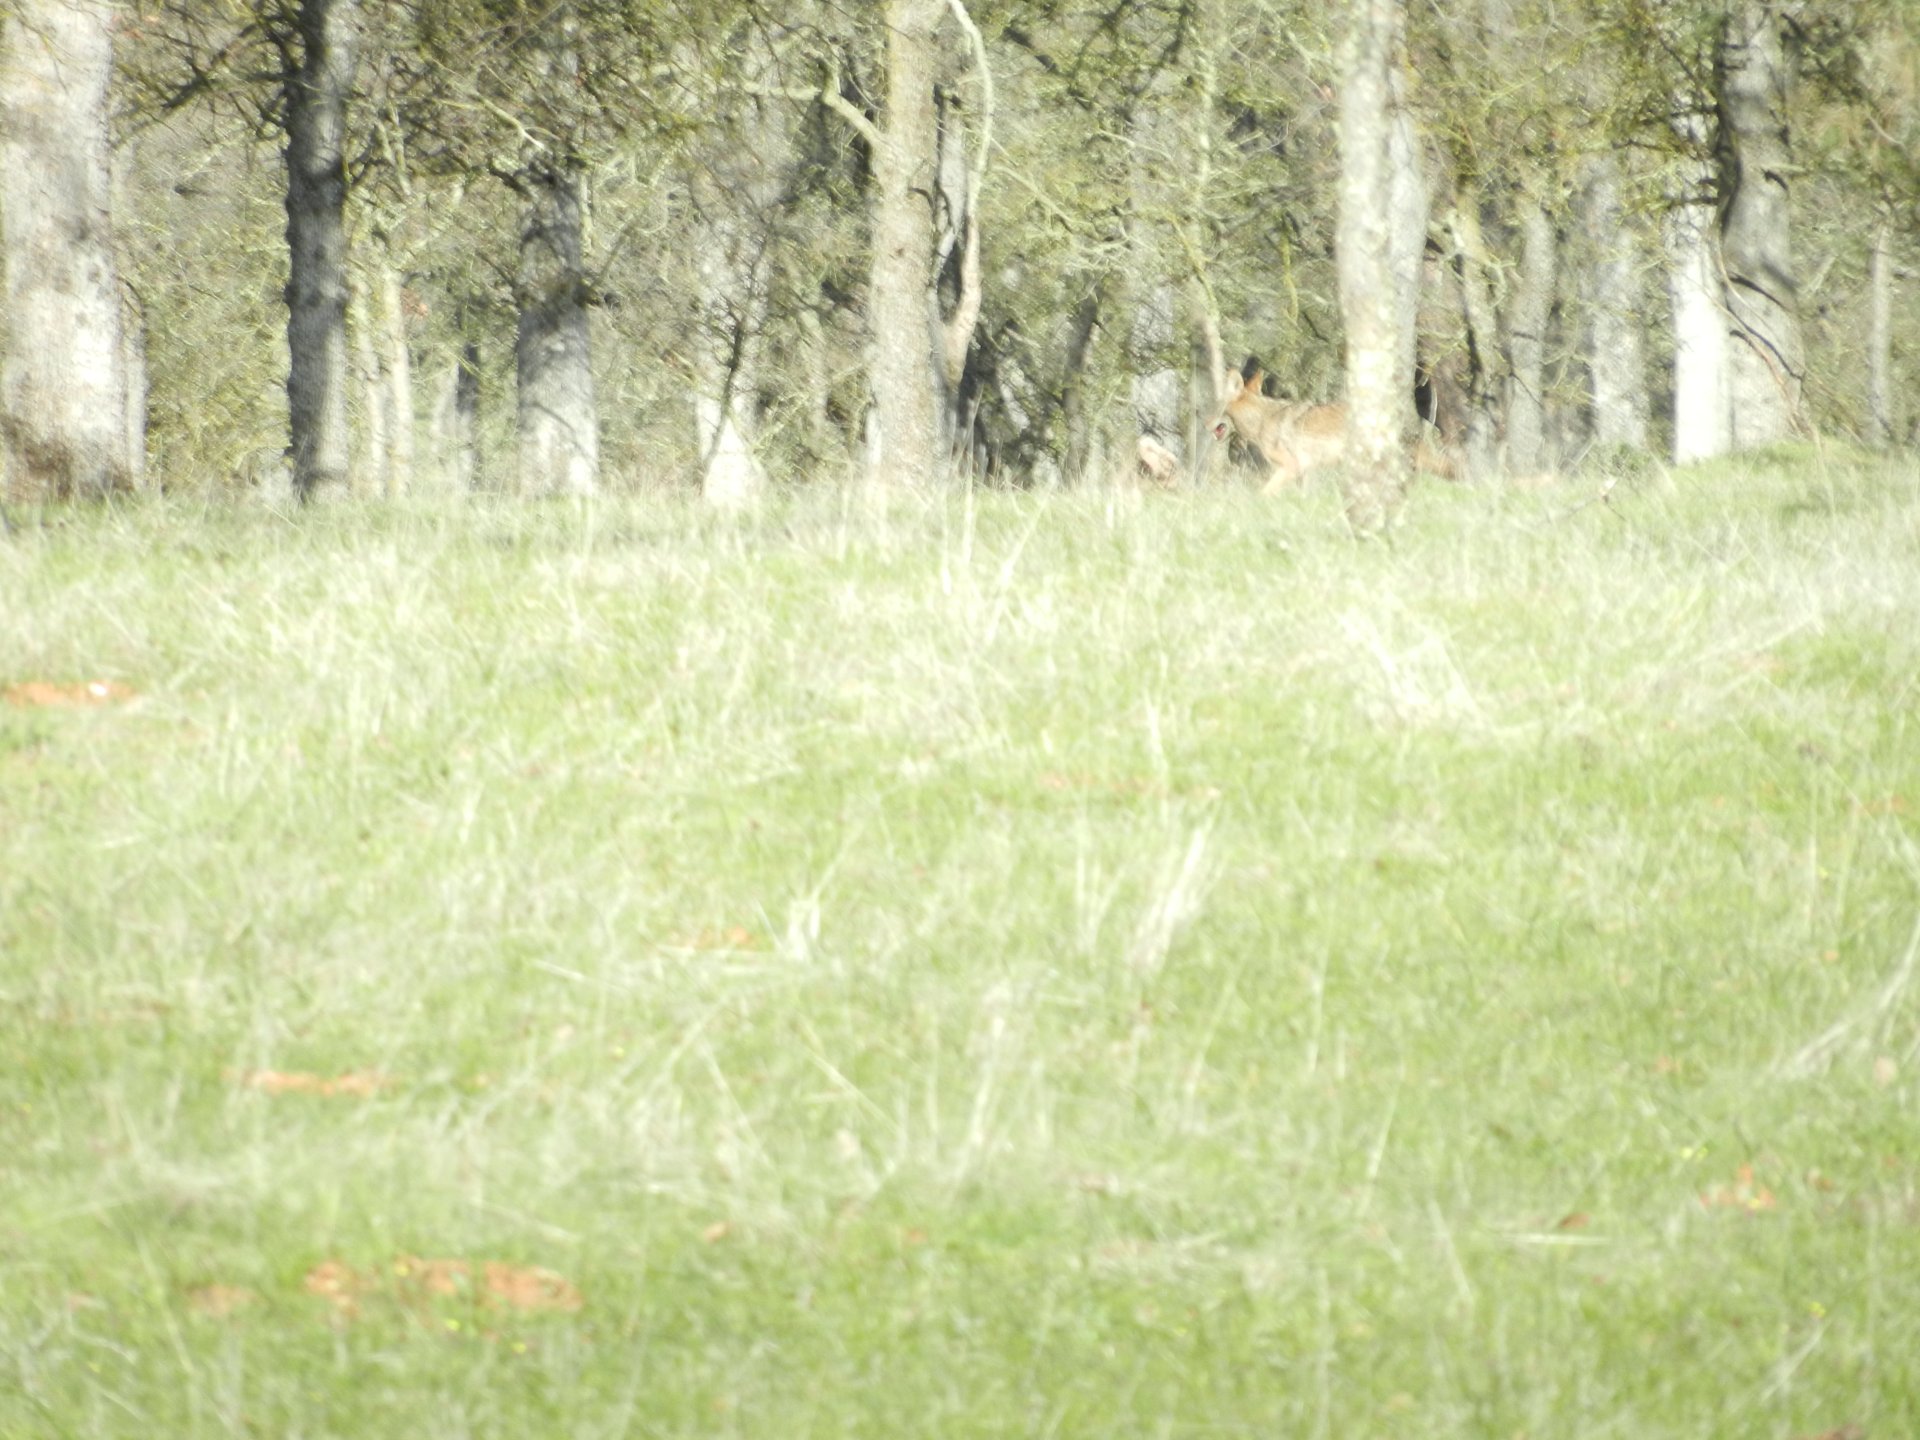
20130313TZ_Coyote.jpg ( 2013-03-13 10:05:43 ) Full size: 1920x1440
Coyote running off
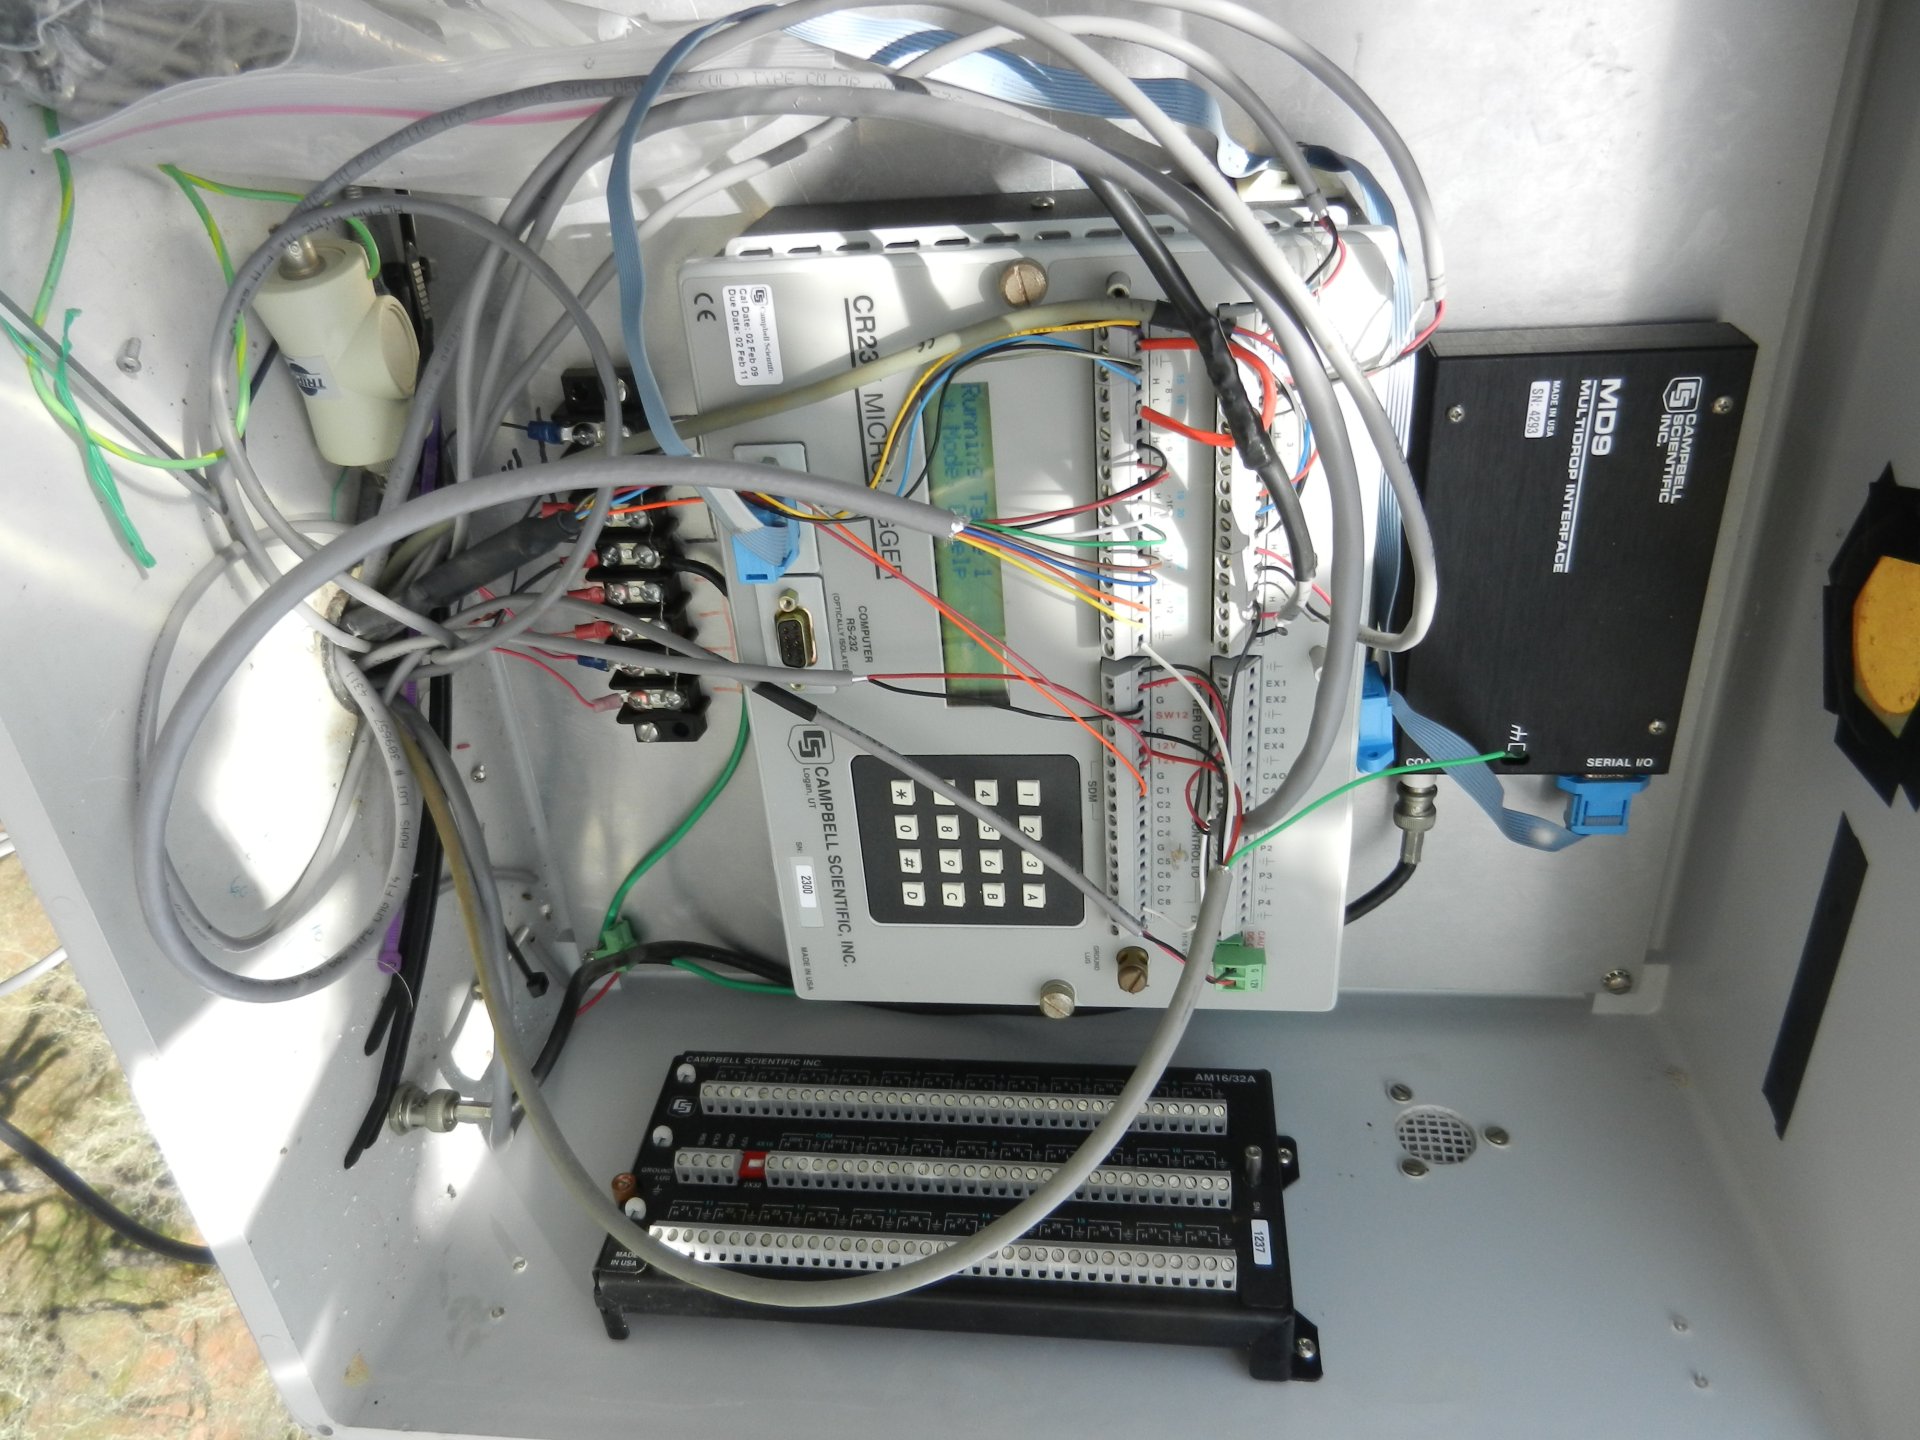
20130313TZ_Tower23X.jpg ( 2013-03-13 11:40:20 ) Full size: 1920x1440
Tower 23x data logger wiring
tonzi_2013_03_14_140117.jpg ( 2013-03-14 14:01:32 ) Full size: 1296x960
Spider
16 sets found
No data found for TZ_Fenergy.
11 TZ_tmet graphs found
11 TZ_soilco2 graphs found
Can't check TZ_mixed
3 TZ_mixed graphs found
1 TZ_fflux graphs found
8 TZ_fmet graphs found
No data found for TZ_tram.
3 TZ_co2prof graphs found
No data found for TZ_irt.
No data found for TZ_windprof.
1 TZ_tflux graphs found
2 TZ_sm graphs found
Can't check TZ_met
1 TZ_met graphs found
Can't check TZVR_mixed
8 TZ_osu graphs found
No data found for TZ_fd.
Tonzi Z-cam data