Field Notes

<--2013-01-16 10:15:00 | 2013-02-06 09:15:00-->
Other sites visited today: Vaira | Twitchell Rice
Phenocam link: Searching...

Tonzi: 2013-01-24 00:00:00 (DOY 24)
Author: Joe Verfaillie
Others: Cove

Summary: Brought tram in, Fixed soil CO2 relay system, Cleaned Phenocam and tower top sensors, changed Floor CR1000 program to be driven by sonic clock, raining

Tonzi
2013-01-24

I arrived about 10:45 with Cove. It was cool and overcast with little to no wind. A light spotty rain was falling when we arrive and increased to a steady light rain when we left. The road was in better condition this time, but it looks like the truck that services the outhouse got stuck sometime in the last few days.

The tram was stopped partway down the track. We reset it but its batter seemed weak. Later when is started up again it quit partway down the track again so we brought it in.

We added a power relay to the Vaisala probes at Tree one and rewired the other relays at the soil CO2 site. With the new relay and wiring, turning the Vaisala probes on and off seemed to work correctly.

I copied the data from the Floor CR1000 and uploaded a new program to use the sonic’s timing to drive the data collection. The new program is running in sequential mode and cycling at 50Hz but data is still being collected at 10Hz. When a message comes in from the sonic the program gets data from the LI7500 to match with it. A couple of the empty 50Hz cycles missed while this happens.

Cove cleaned all the sensors at the top of the tower including the phenocam that had a spot in its images.

Field Data

No tank data

No TZ Well data found

No TZ Moisture Point data found

No VR Moisture Point data found

No TZ grass heigth found

No VR grass heigth found

No TZ Tree DBH found

No water potential data found

No TZ Grass Biomass data found

No TZ OakLeaves Biomass data found

No TZ PineNeedles Biomass data found

4 photos found
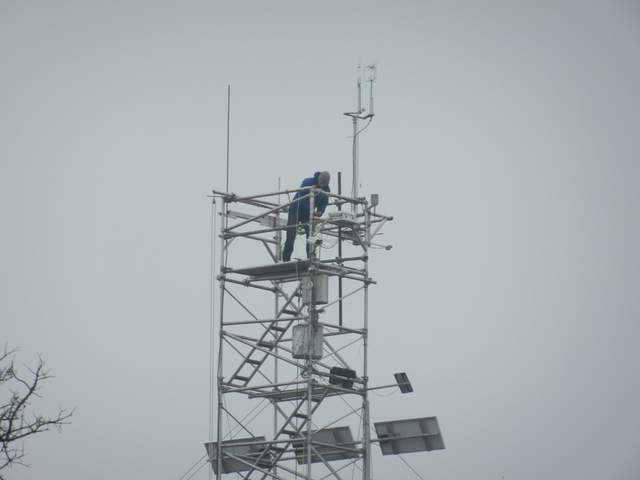
Cove on the tower top
20130124TZ_CoveAtTowerTop.jpg ( 2013-01-24 13:04:42 ) Full size: 1920x1440
Cove on the tower top
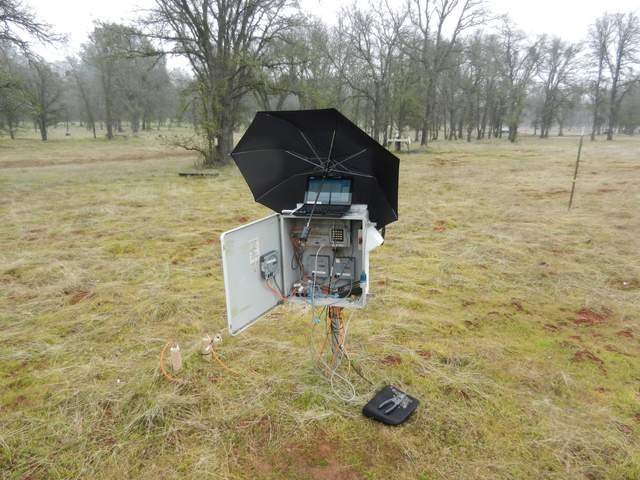
Rain at Tonzi
20130124TZ_SoilCO2InTheRain.jpg ( 2013-01-24 13:04:11 ) Full size: 1920x1440
Rain at Tonzi
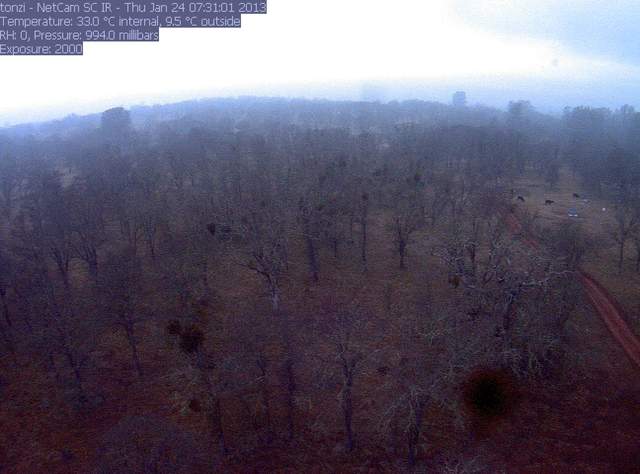
Cows near soil co2 fence and fog
tonzi_2013_01_24_073101.jpg ( 2013-01-24 07:31:38 ) Full size: 1296x960
Cows near soil co2 fence and fog
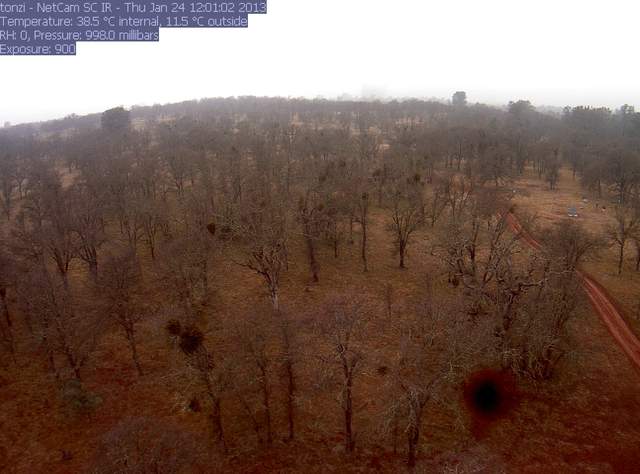
Joe and Cove at soil co2
tonzi_2013_01_24_120102.jpg ( 2013-01-24 12:01:38 ) Full size: 1296x960
Joe and Cove at soil co2

Graphs display:
16 sets found

No data found for TZ_Fenergy.
11 TZ_tmet graphs found

Explore the graph:Tonzi Tower Met: Temperature and Power in a new window

Explore the graph:Tonzi Tower Met: Solar Radiation in a new window

Explore the graph:Tonzi Tower Met: IRT Sensors in a new window

Explore the graph:LED Sensor Incoming in a new window

Explore the graph:LED Sensor Outgoing in a new window

Explore the graph:4-Band Solar Radiation in a new window

Explore the graph:Air Temperature Profile in a new window

Explore the graph:Relativity Humidity Profile in a new window

Explore the graph:Tonzi Tower PRI in a new window

Explore the graph:SRS PRI/NDVI in a new window

Explore the graph:SRS NDVI in a new window

11 TZ_soilco2 graphs found

Explore the graph:Tonzi Soil CO2 Profile: Open (East) CO2 in a new window

Explore the graph:Tonzi Soil CO2 Profile: Tree (West) CO2 in a new window

Explore the graph:Tonzi Soil CO2 Profile: Open (East) Temperatures in a new window

Explore the graph:Tonzi Soil CO2 Profile: Tree (West) Temperatures in a new window

Explore the graph:Tonzi Soil CO2 Profile: Upper CO2 in a new window

Explore the graph:Tonzi Soil CO2 Profile: Lower CO2 in a new window

Explore the graph:Tonzi Soil CO2 Profile: Upper Temperatures in a new window

Explore the graph:Tonzi Soil CO2 Profile: Lower Temperatures in a new window

Explore the graph:Tonzi Soil CO2 Profile: Power and Temperature in a new window

Explore the graph:Tree 2 Soil CO2 in a new window

Explore the graph:Tree 2 Soil Temperature in a new window

Can't check TZ_mixed
3 TZ_mixed graphs found

Explore the graph:Tonzi PPT in a new window

Explore the graph:Tonzi CO2 and H2O Densities in a new window

Explore the graph:Air Pressure in a new window

1 TZ_fflux graphs found

Explore the graph:Tonzi Wind Speed in a new window

8 TZ_fmet graphs found

Explore the graph:Soil Heat Flux in a new window

Explore the graph:Tonzi Soil Temperature Set A in a new window

Explore the graph:Tonzi Soil Temperatures Set B in a new window

Explore the graph:Tonzi Soil Temperatures Set C in a new window

Explore the graph:Tonzi Soil Temperature Set D in a new window

Explore the graph:Well Level in a new window

Explore the graph:Well Water Temperature in a new window

Explore the graph:Soil Water Potential in a new window

1 TZ_tram graphs found

Explore the graph:Tonzi Tram Incoming PAR in a new window

3 TZ_co2prof graphs found

Explore the graph:Tower CO2 Profile Concentrations in a new window

Explore the graph:Tower CO2 Profile Cell Pressure in a new window

Explore the graph:CO2 Profile Sensor Temperature in a new window

No data found for TZ_irt.
No data found for TZ_windprof.
1 TZ_tflux graphs found

Explore the graph:Tower CO2 and H2O in a new window

2 TZ_sm graphs found

Explore the graph:Floor Solar Radiations in a new window

Explore the graph:TZ Soil Moisture in a new window

Can't check TZ_met
1 TZ_met graphs found

Explore the graph:Floor and Tower RH in a new window

Can't check TZVR_mixed
8 TZ_osu graphs found

Explore the graph:Soil Moisture And Rain in a new window

Explore the graph:SP1 Solar Radiation in a new window

Explore the graph:SP1 Soil Temperature Profile in a new window

Explore the graph:SP1 Soil Heat Flux in a new window

Explore the graph:SP2 Soil Moisture in a new window

Explore the graph:SP2 Soil Temperature in a new window

Explore the graph:SP3 Soil Moisture in a new window

Explore the graph:SP3 Soil Temperature in a new window

No data found for TZ_fd.
Tonzi Z-cam data

plot of Tonzi z-cam LAI

plot of Tonzi z-cam gap fration