Field Notes
<--2010-06-03 11:30:00 | 2010-06-22 08:30:00-->Other sites visited today: Twitchell Rice
Phenocam link: Searching...
Sherman Island: 2010-06-16 08:00:00 (DOY 167)
Author: Joe Verfaillie
Others: Jaclyn Hatala
| Sherman
6-16-2010 Arrived about 8am with Jaclyn. Clear, sunny, nice wind from west, warming. The pepper weed is still in heavy bloom but the pollen seems less strong than two weeks ago. Cows far to the west. All systems running. I swapped cards on the CR1000 and changed the program back to before the LI7700 was installed. LGR: 7:48, 26.61C, 136.75Torr, 16.088usec, 10Hz, 1.893ppm, 2457.7hrs In removing the LI7700 I noticed that the cap on the bottom of the water trap closest to the LGR inlet was missing. When I tried to put another cap on, the tubing broke being very brittle. I removed the water trap tubing and put a cap directly on the T-fitting. A good amount of the flow was going through the water trap. After capping, the LGR pressure fell about 10 Torr. The 40um filter was fouled. I didn’t have a new filter, but I had a used one in a littler better shape that I swapped in. Pressure improved. Copied data. Cleaned radiometers and rain bucket. Pulled three moisture point probes in the field. Left for Twitchell about 9:30 Returned about 2pm Swapped card at the Levee tower. |
3 photos found

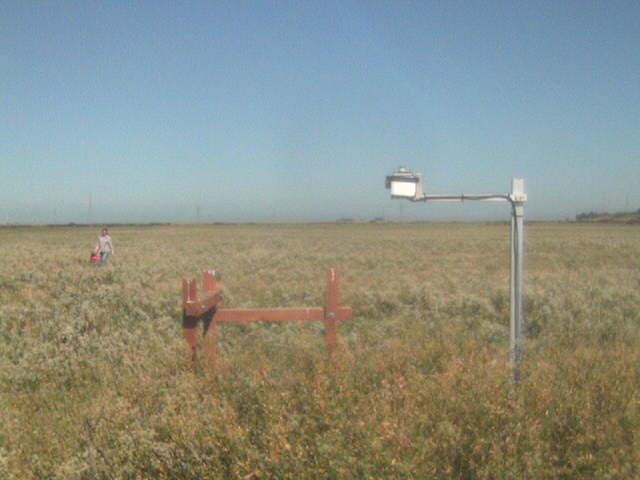
SI_webcam_20101670815.jpg ( 2010-06-16 08:15:06 ) Full size: 640x480
Jaclyn in the field

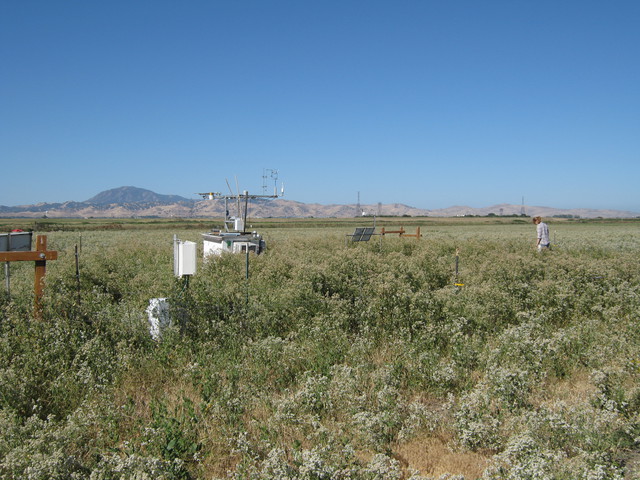
20100616SI_SiteJaclyn.jpg ( 2010-06-16 09:08:06 ) Full size: 3648x2736
Looking south at tower and Mt Diablo. Jaclyn doing fieldwork.

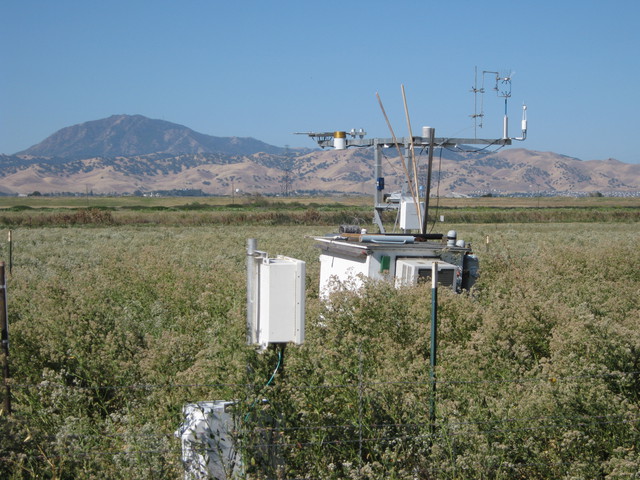
20100616SI_TowerDiablo.jpg ( 2010-06-16 09:08:20 ) Full size: 3648x2736
Looking south at the tower and Mt. Diablo.
7 sets found
No data found for SI_mp.
11 SI_met graphs found
Can't check SI_mixed
2 SI_mixed graphs found
5 SI_flx graphs found
2 SI_soilco2 graphs found
Can't check TWSI_mixed
Can't check SIMBTWEE_met

