Field Notes
<--2010-06-16 08:00:00 | 2010-07-01 08:30:00-->Other sites visited today: Twitchell Rice
Phenocam link: Searching...
Sherman Island: 2010-06-22 08:30:00 (DOY 173)
Author: Joe Verfaillie
Others:
| Sherman
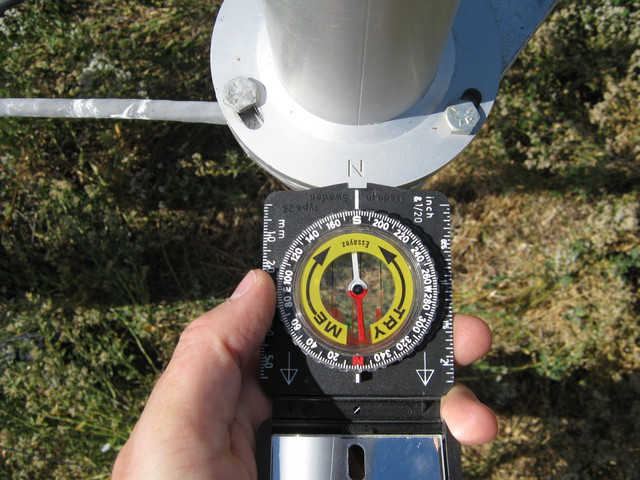
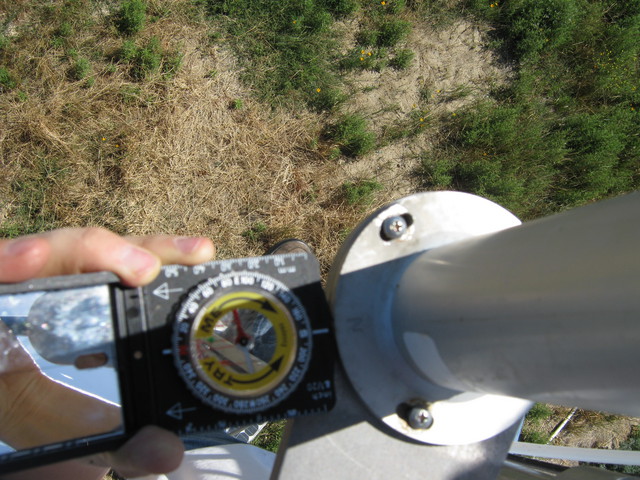
6/22/2010 Arrived about 8:30am. Warm, clear and sunny. No wind to begin but quickly picking up to a few m/s. The pepper weed flowers have yellowed. Cows far to the west. All was running however, the second water trap just before the exterior broke just like the other one. The tubing that the water traps were made from seems different that the rest of the lines. The water trap tubing was kind of opaque, while the rest is more translucent and seems in better condition – not brittle. LGR while sucking through water trap: 8:31, 28.10C 142.11Torr, 16.071usec, 10Hz, 1.932ppm, 2602.4hr After putting in a new 40um filter and capping the water trap, the pressure dropped to 138.2Torr Checking cal of LGR: last cal May 28, 1.976ppm 700psi 8:51, 156.45Torr, 1.976+-0.002ppm - NO CALIBRATION needed Last reading from LGR 8:56, 138.9Torr, 1.917ppm, 10Hz I checked the sonic heading (see photo). Its heading is about -3 degrees west of magnetic north making it 11 degrees true, which agrees with the Google earth method I checked on the levee tower. Data looked okay. Raccoon or otter footprints on the solar panels. I checked the heading of the sonic (see photo). Its heading is about -84 degrees magnetic or –70 true or 290 true, which agrees with the Google earth method. Left for Twitchell about 10:30 |
3 photos found

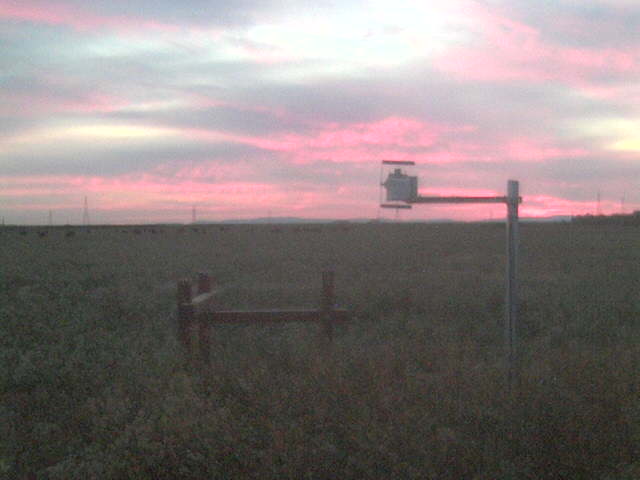
SI_webcam_20101731945.jpg ( 2010-06-22 19:45:04 ) Full size: 640x480
Pink clouds at sunset.

20100622SI_CPSonicHeading.jpg ( 2010-06-22 10:00:30 ) Full size: 3648x2736
Magnetic heading of sonic.

20100622SI_LeveeSonicHeading.jpg ( 2010-06-22 10:25:32 ) Full size: 3648x2736
Magnetic heading of sonic.
7 sets found
1 SI_mp graphs found
11 SI_met graphs found
Can't check SI_mixed
2 SI_mixed graphs found
5 SI_flx graphs found
2 SI_soilco2 graphs found
Can't check TWSI_mixed
Can't check SIMBTWEE_met

