
Field Notes
<--2012-08-30 10:25:00 | 2012-09-06 11:00:00-->Other sites visited today: Sherman Island | Twitchell Rice | DWR Corn | West Pond | Mayberry
Phenocam link: Searching...
Twitchell Rice: 2012-08-30 11:00:00 (DOY 243)
Author: Jaclyn Hatala
Others: Joe, Emily Gilson
Summary: changed sonic analog out from 0-5V to +/- 5 V, reconnected power cord to LI-7700 reservoir
| Arrived at the site around 11am local time - 28 degrees and very still. Heard possible otters cavorting in the paddy south of the tower.
We tried to troubleshoot the weird values in the sonic speed of sound (and thus, sonic temperature). We converted the sonic analog out to +/- 5V, and changed the coefficients for U, V, W, and SOS in the LI-7550A software accordingly and saved the new config settings onto the field laptop: U,V: a=12, b=-30 to a=6, b=0 W: a=2, b=-5 to a=1, b=0 SOS: a=14, b=300 to a=7, b=335 However, this did not improve the SOS readings. Joe also tried checking some different possible grounding issues with the tower and sonic power, but that didn't change anything either. We took a photo of the pins in the sonic to cross-check with other sites, although comparing in the lab everything looked the same. For the LI-7700, RSSI was 17; forcing it to clean itself, we realized that the power cable to the LI-7700 reservoir was loose, so it was unable to clean itself. We reconnected the cable, it washed itself, and RSSI jumped to 63. CH4 = 1.9ppm CO2 = 381ppm H2O = 600 mmol/m3 [Joe] We tried swapping the 7500 head again. Putting on the new head caused the 7550 box to enter a reboot cycle. Ended up leaving the original head. I will need to talk to Licor. Collected all data. |
2 photos found
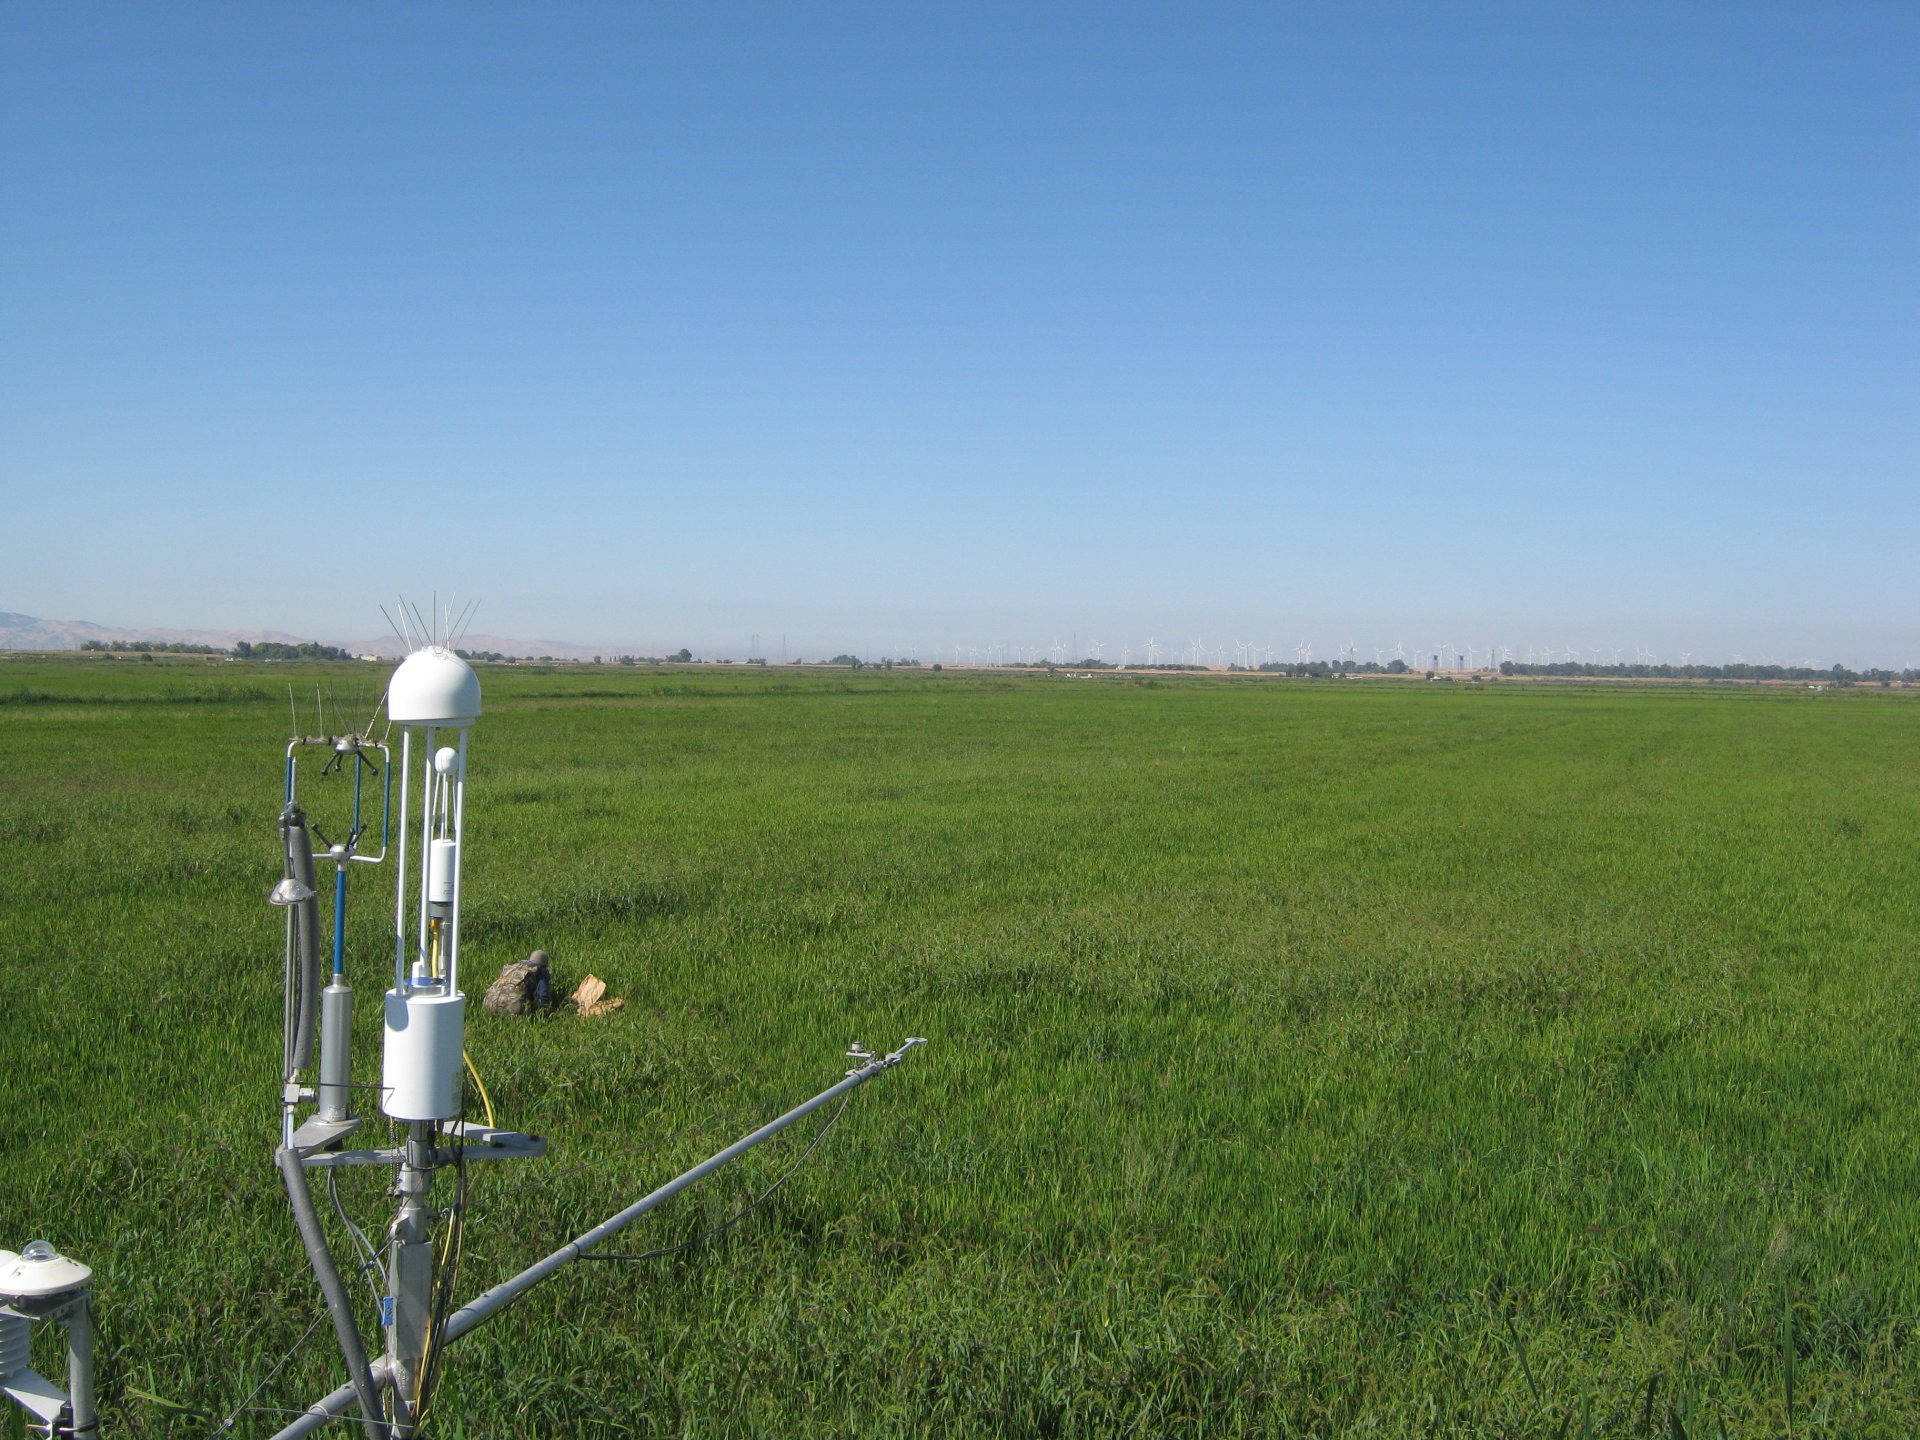
TW_autocam_20120830_0945.jpg ( 2012-08-30 09:45:02 ) Full size: 1920x1440
Field visit biomass samples
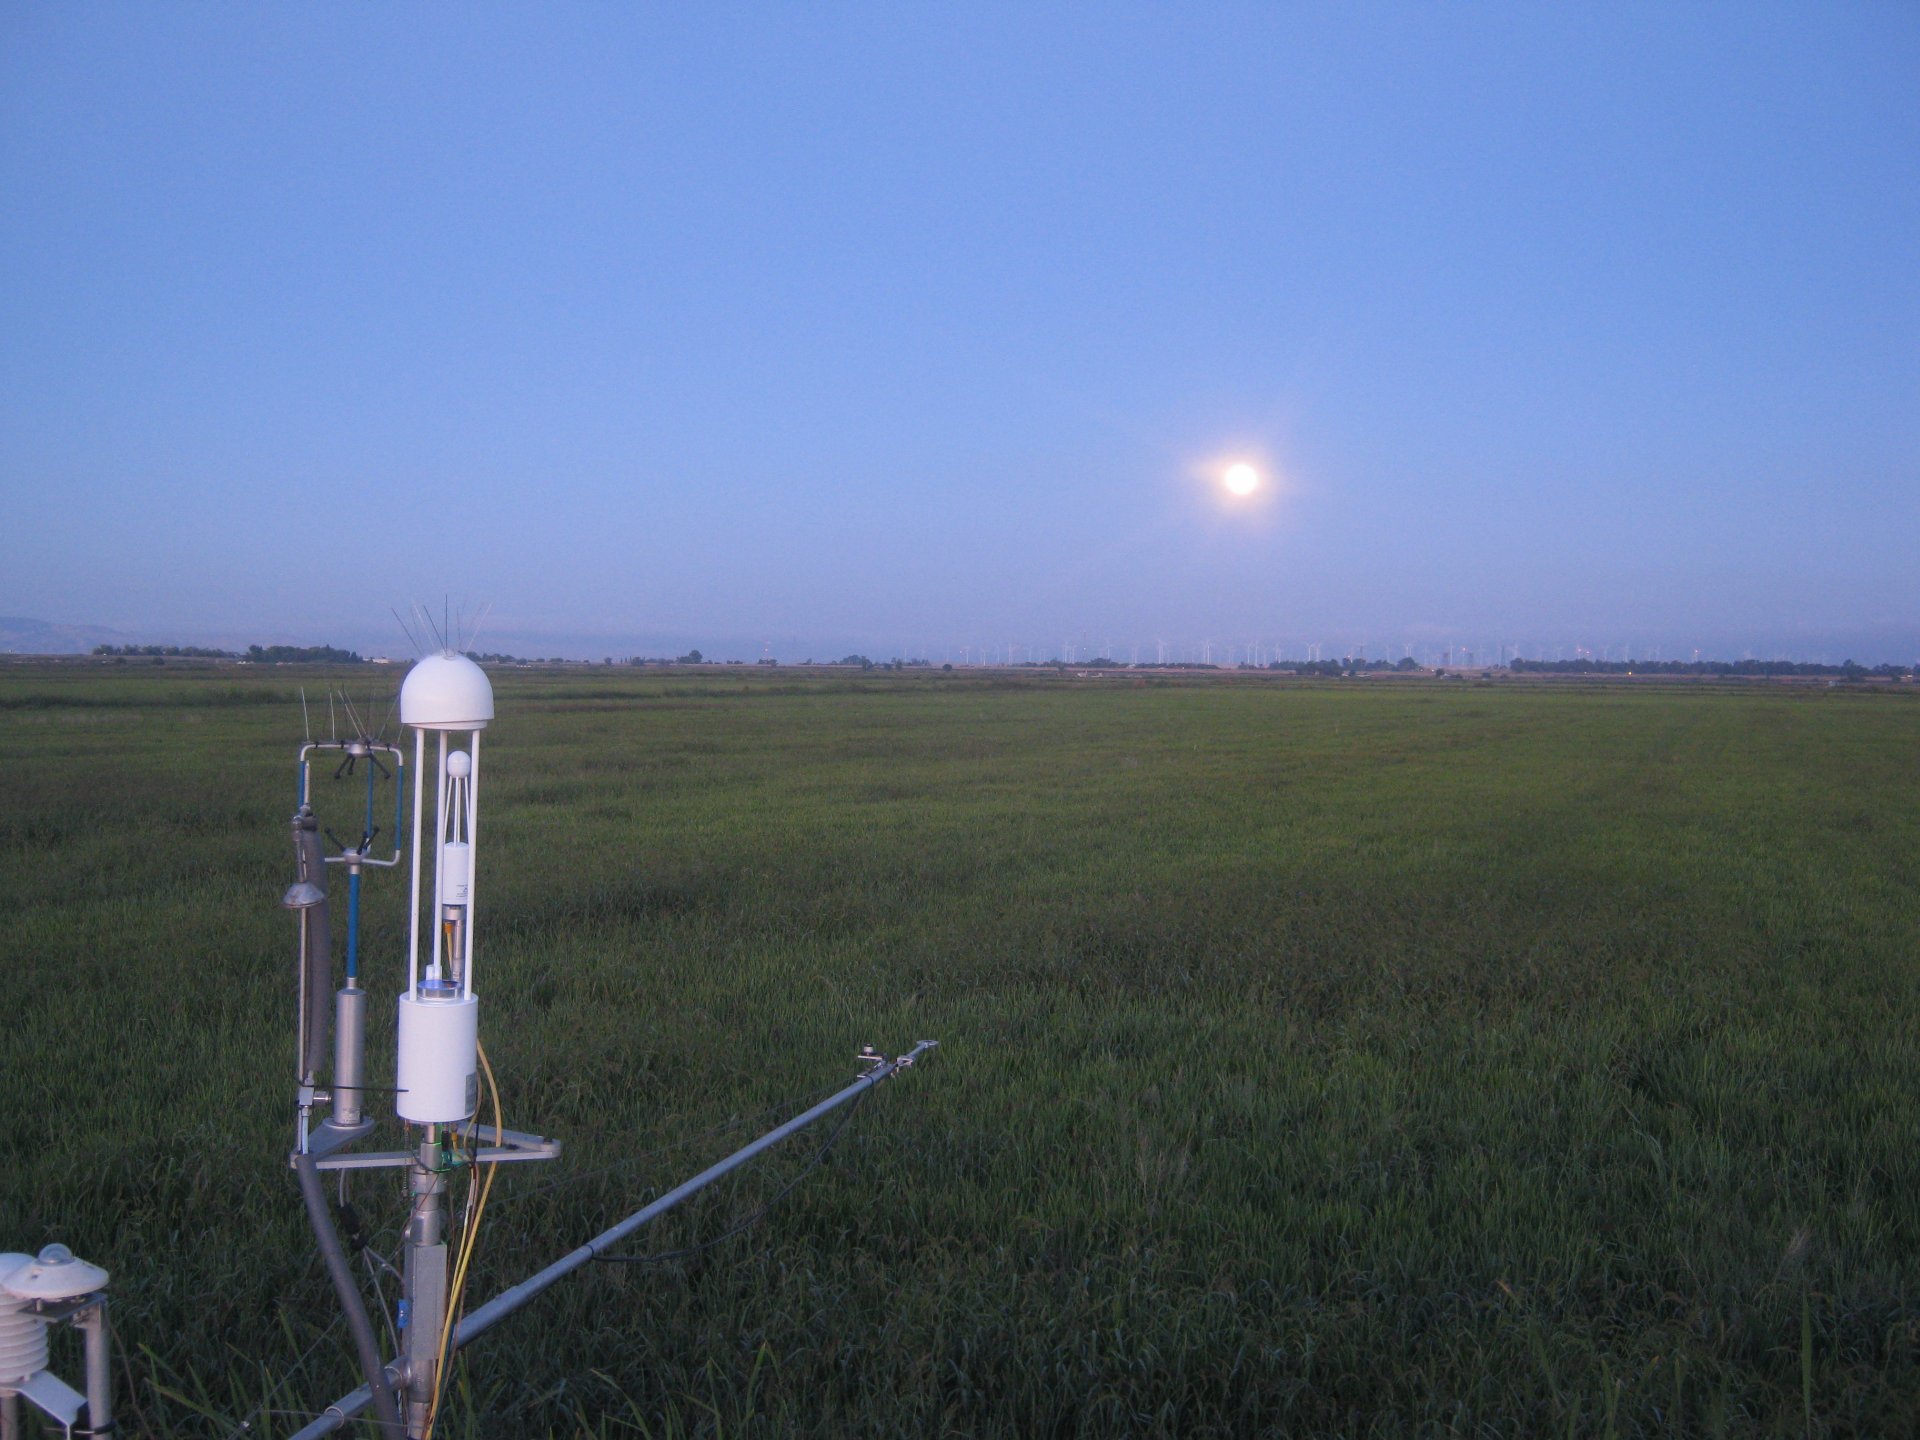
TW_autocam_20120831_0515.jpg ( 2012-08-31 05:15:10 ) Full size: 1920x1440
Moom at dawn
6 sets found
12 TW_met graphs found
5 TW_flux graphs found
Can't check TWSI_mixed
Can't check SIMBTWEE_met
1 TW_cam graphs found
Can't check TATWBABCSB_cam