
Field Notes
<--2012-07-25 05:30:00 | 2012-08-22 10:00:00-->Other sites visited today: Vaira
Phenocam link: Searching...
Tonzi: 2012-08-08 10:30:00 (DOY 221)
Author: Joe Verfaillie
Others: Martin, Erika, USC
Summary: Overhaul CO2 profile system, service z-cams, leaf survey, USC soil moisture orientation.
| Tonzi
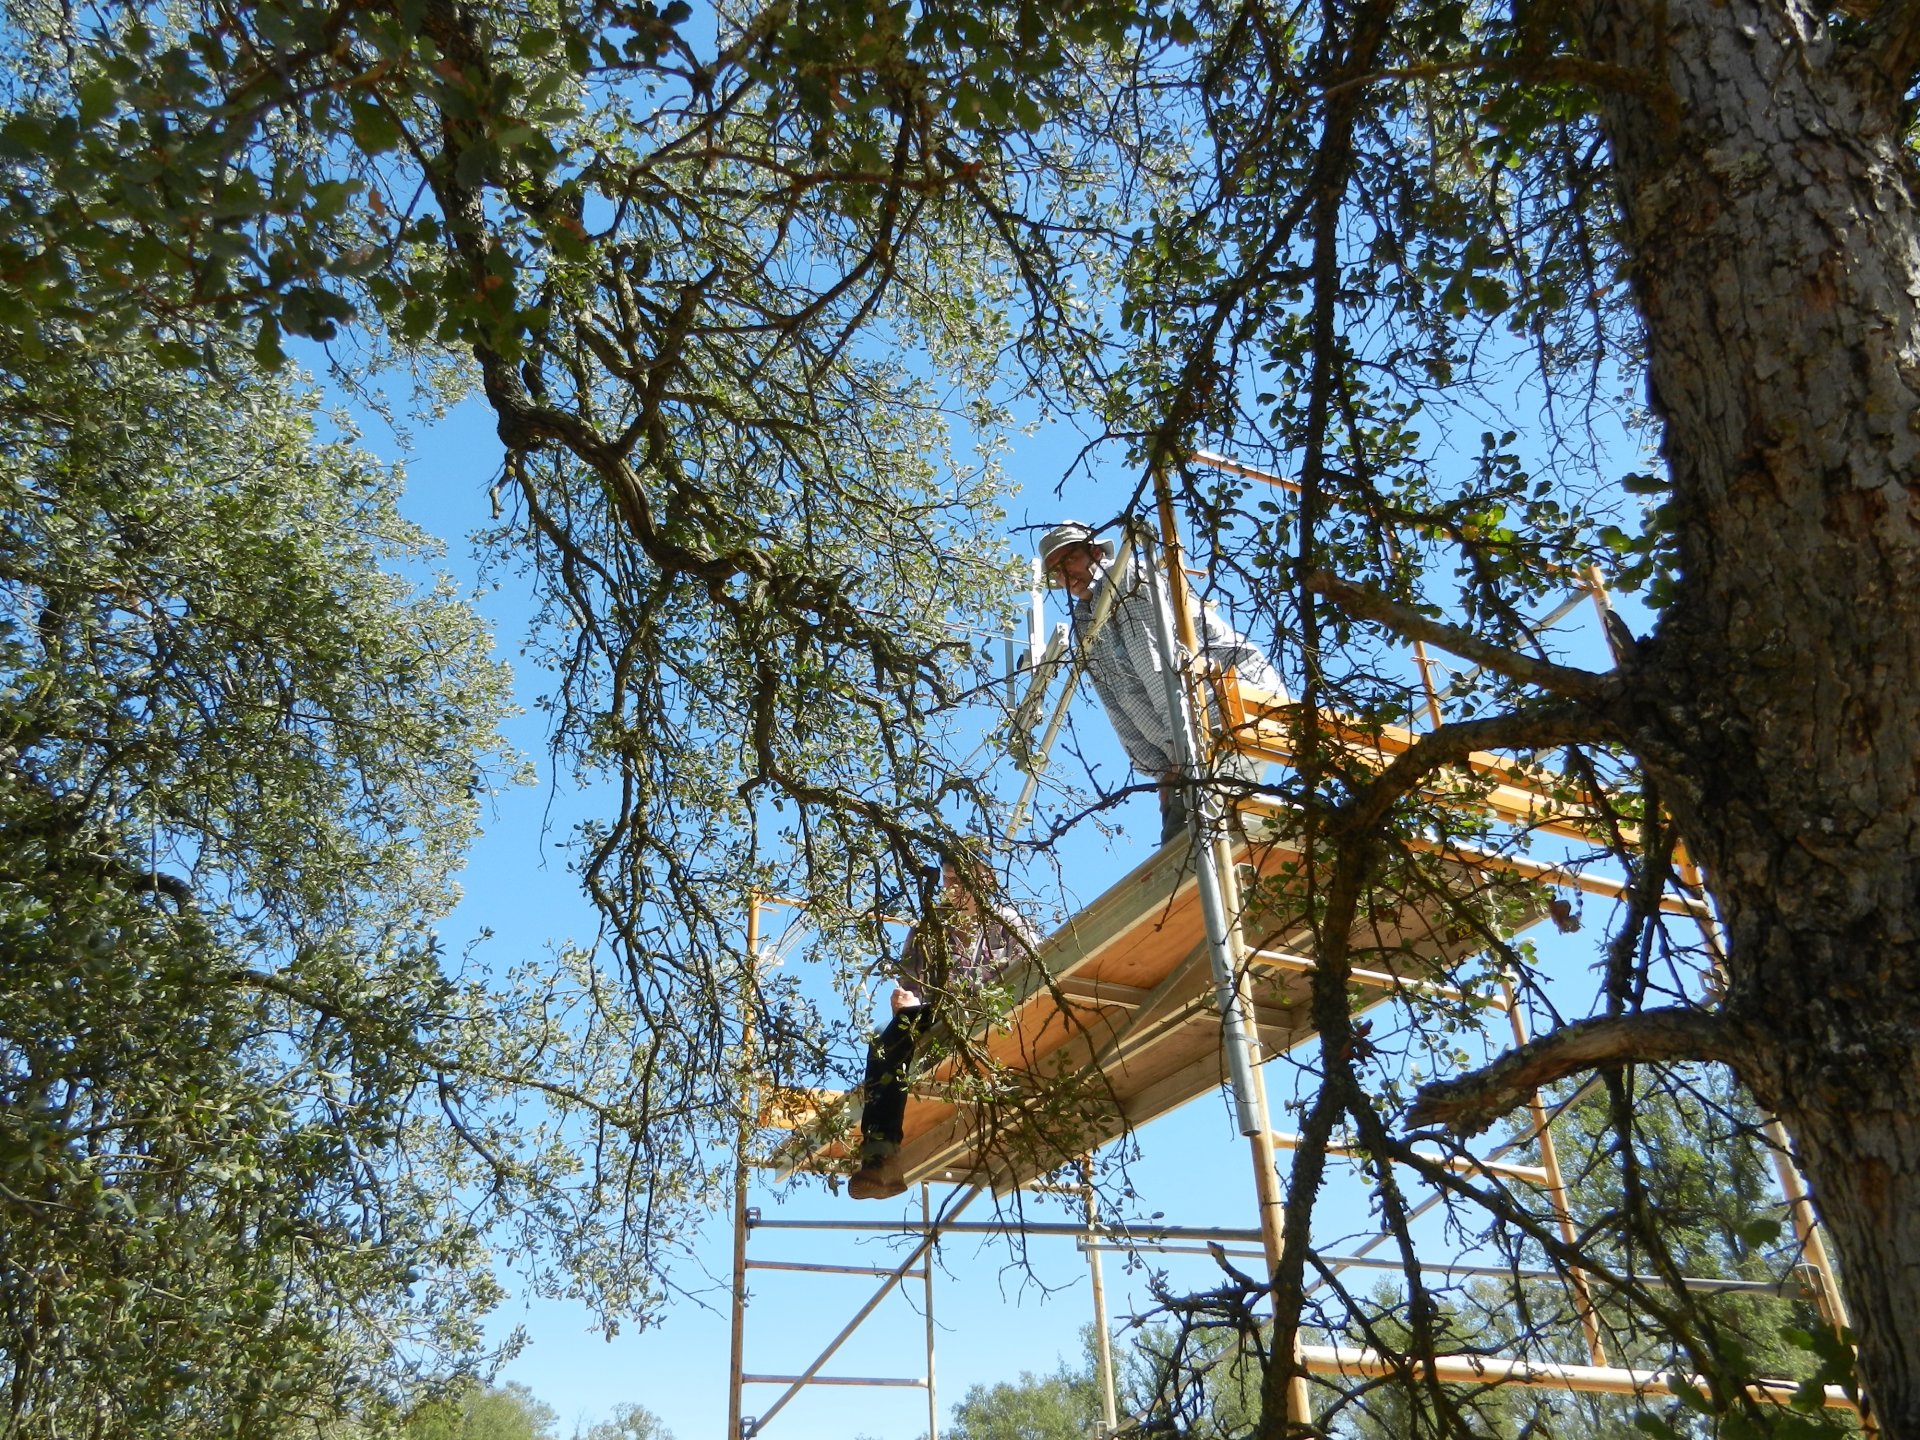
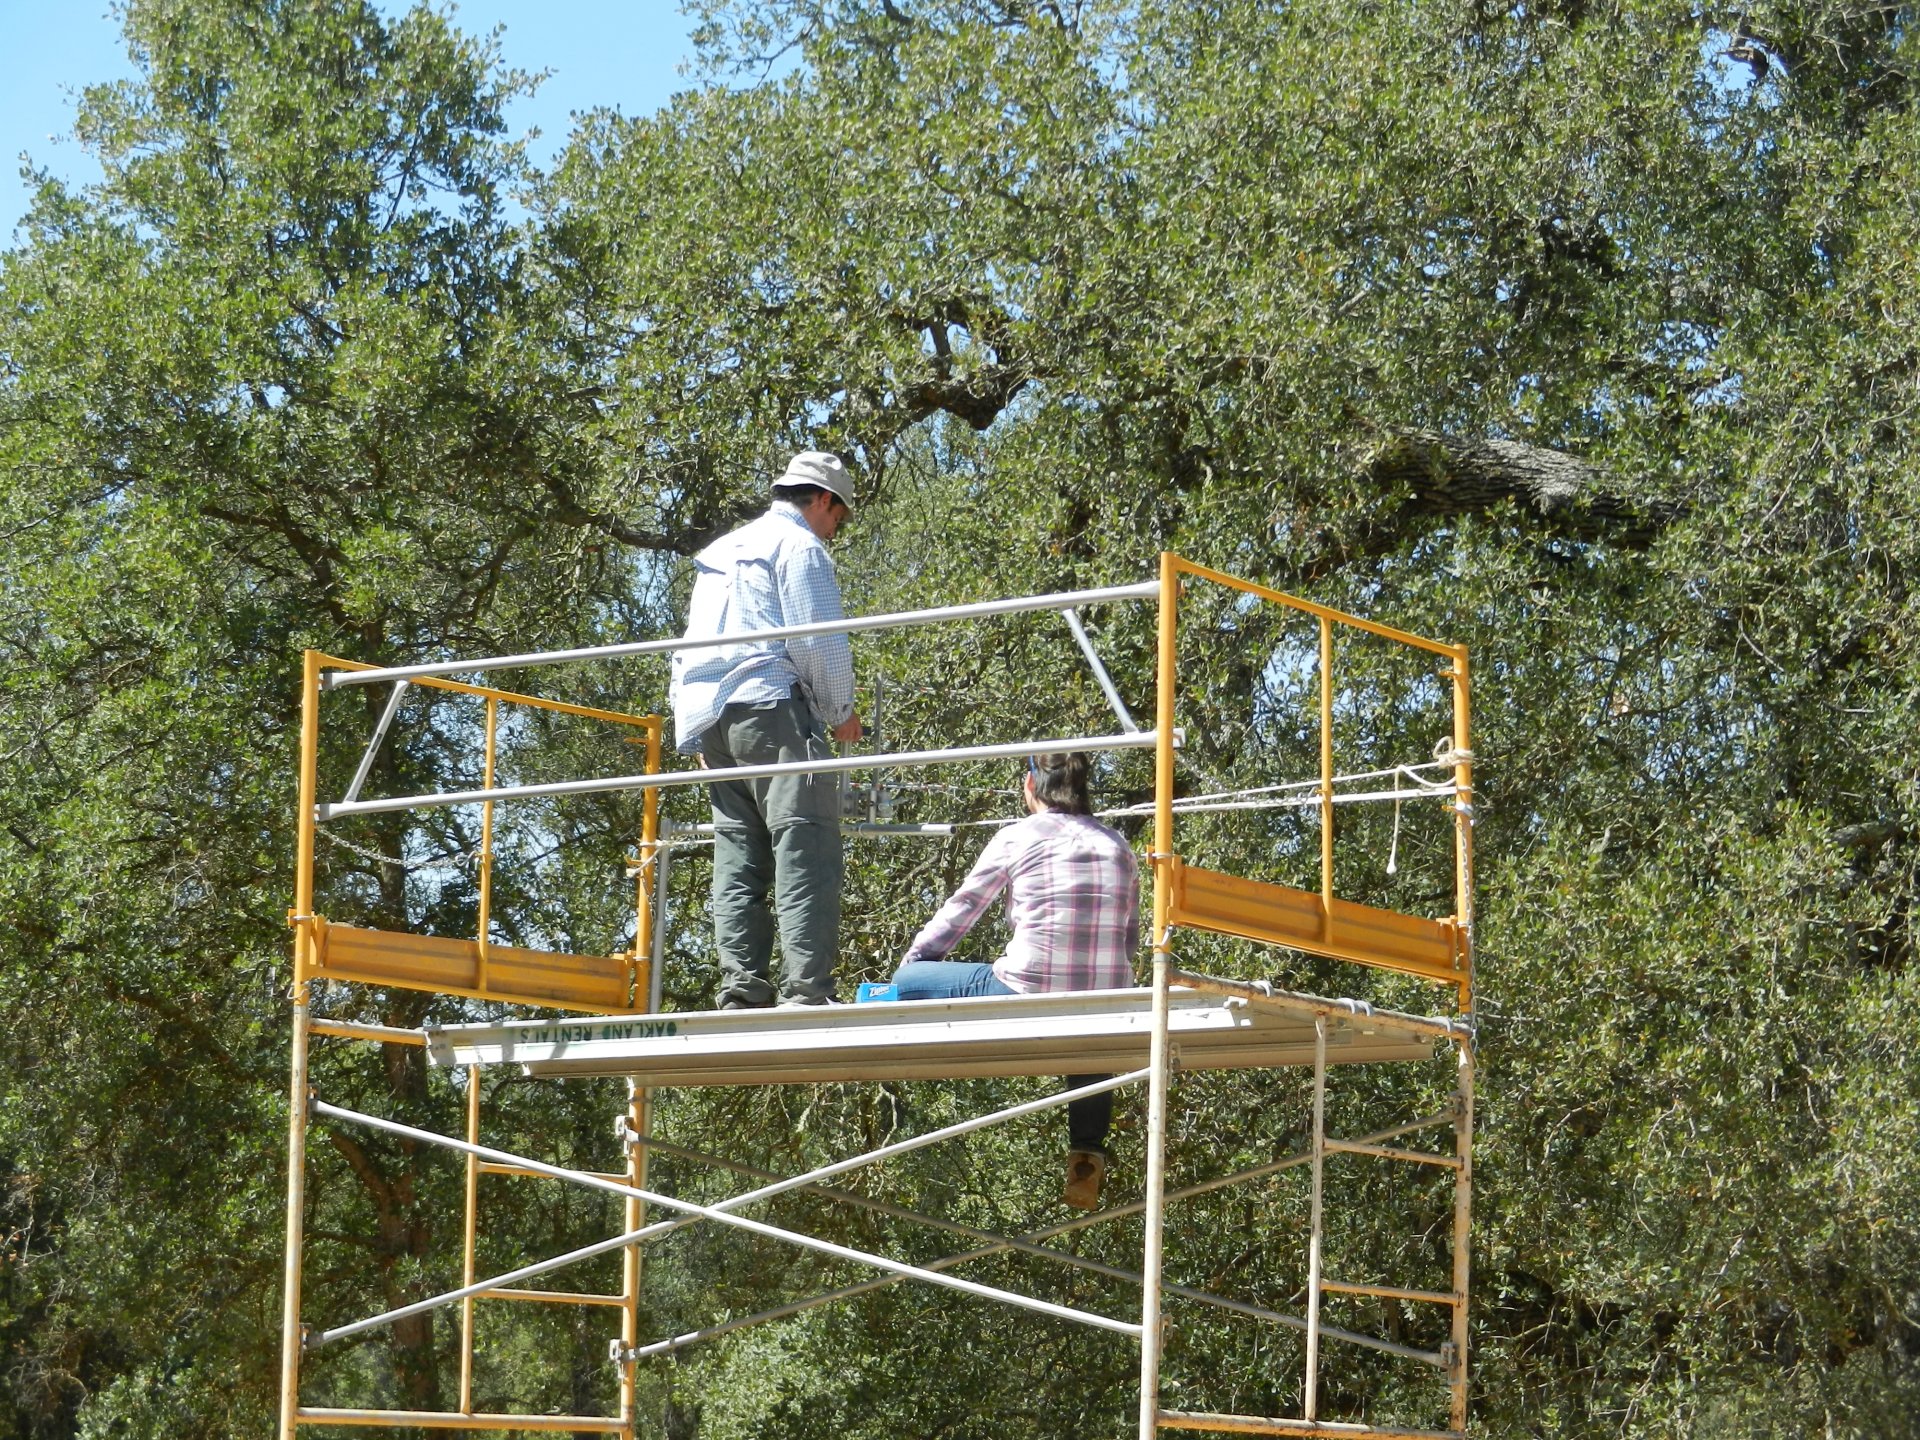
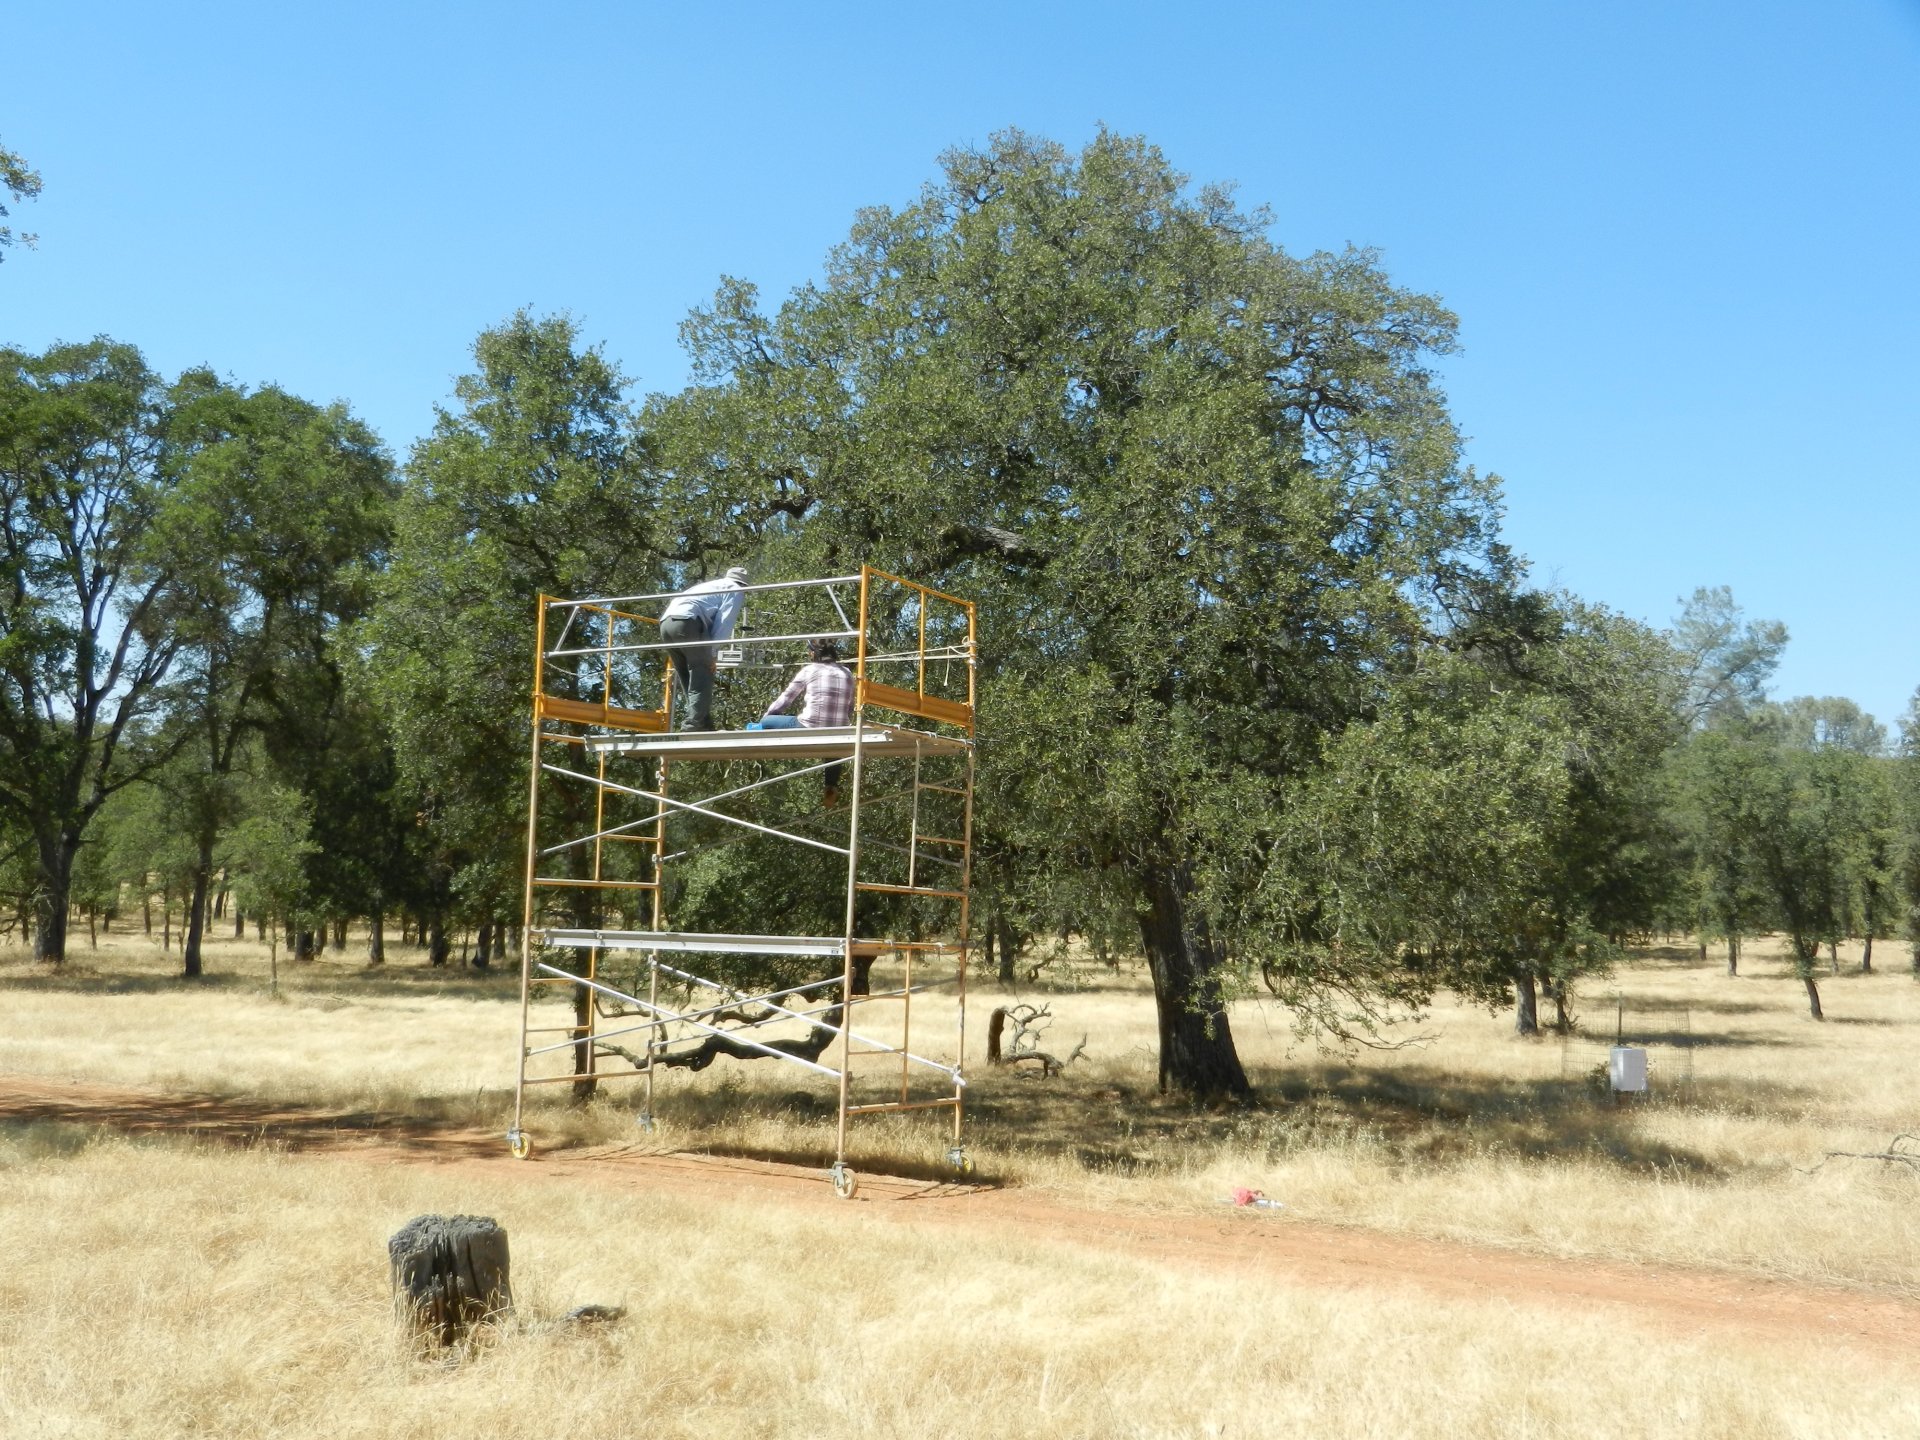
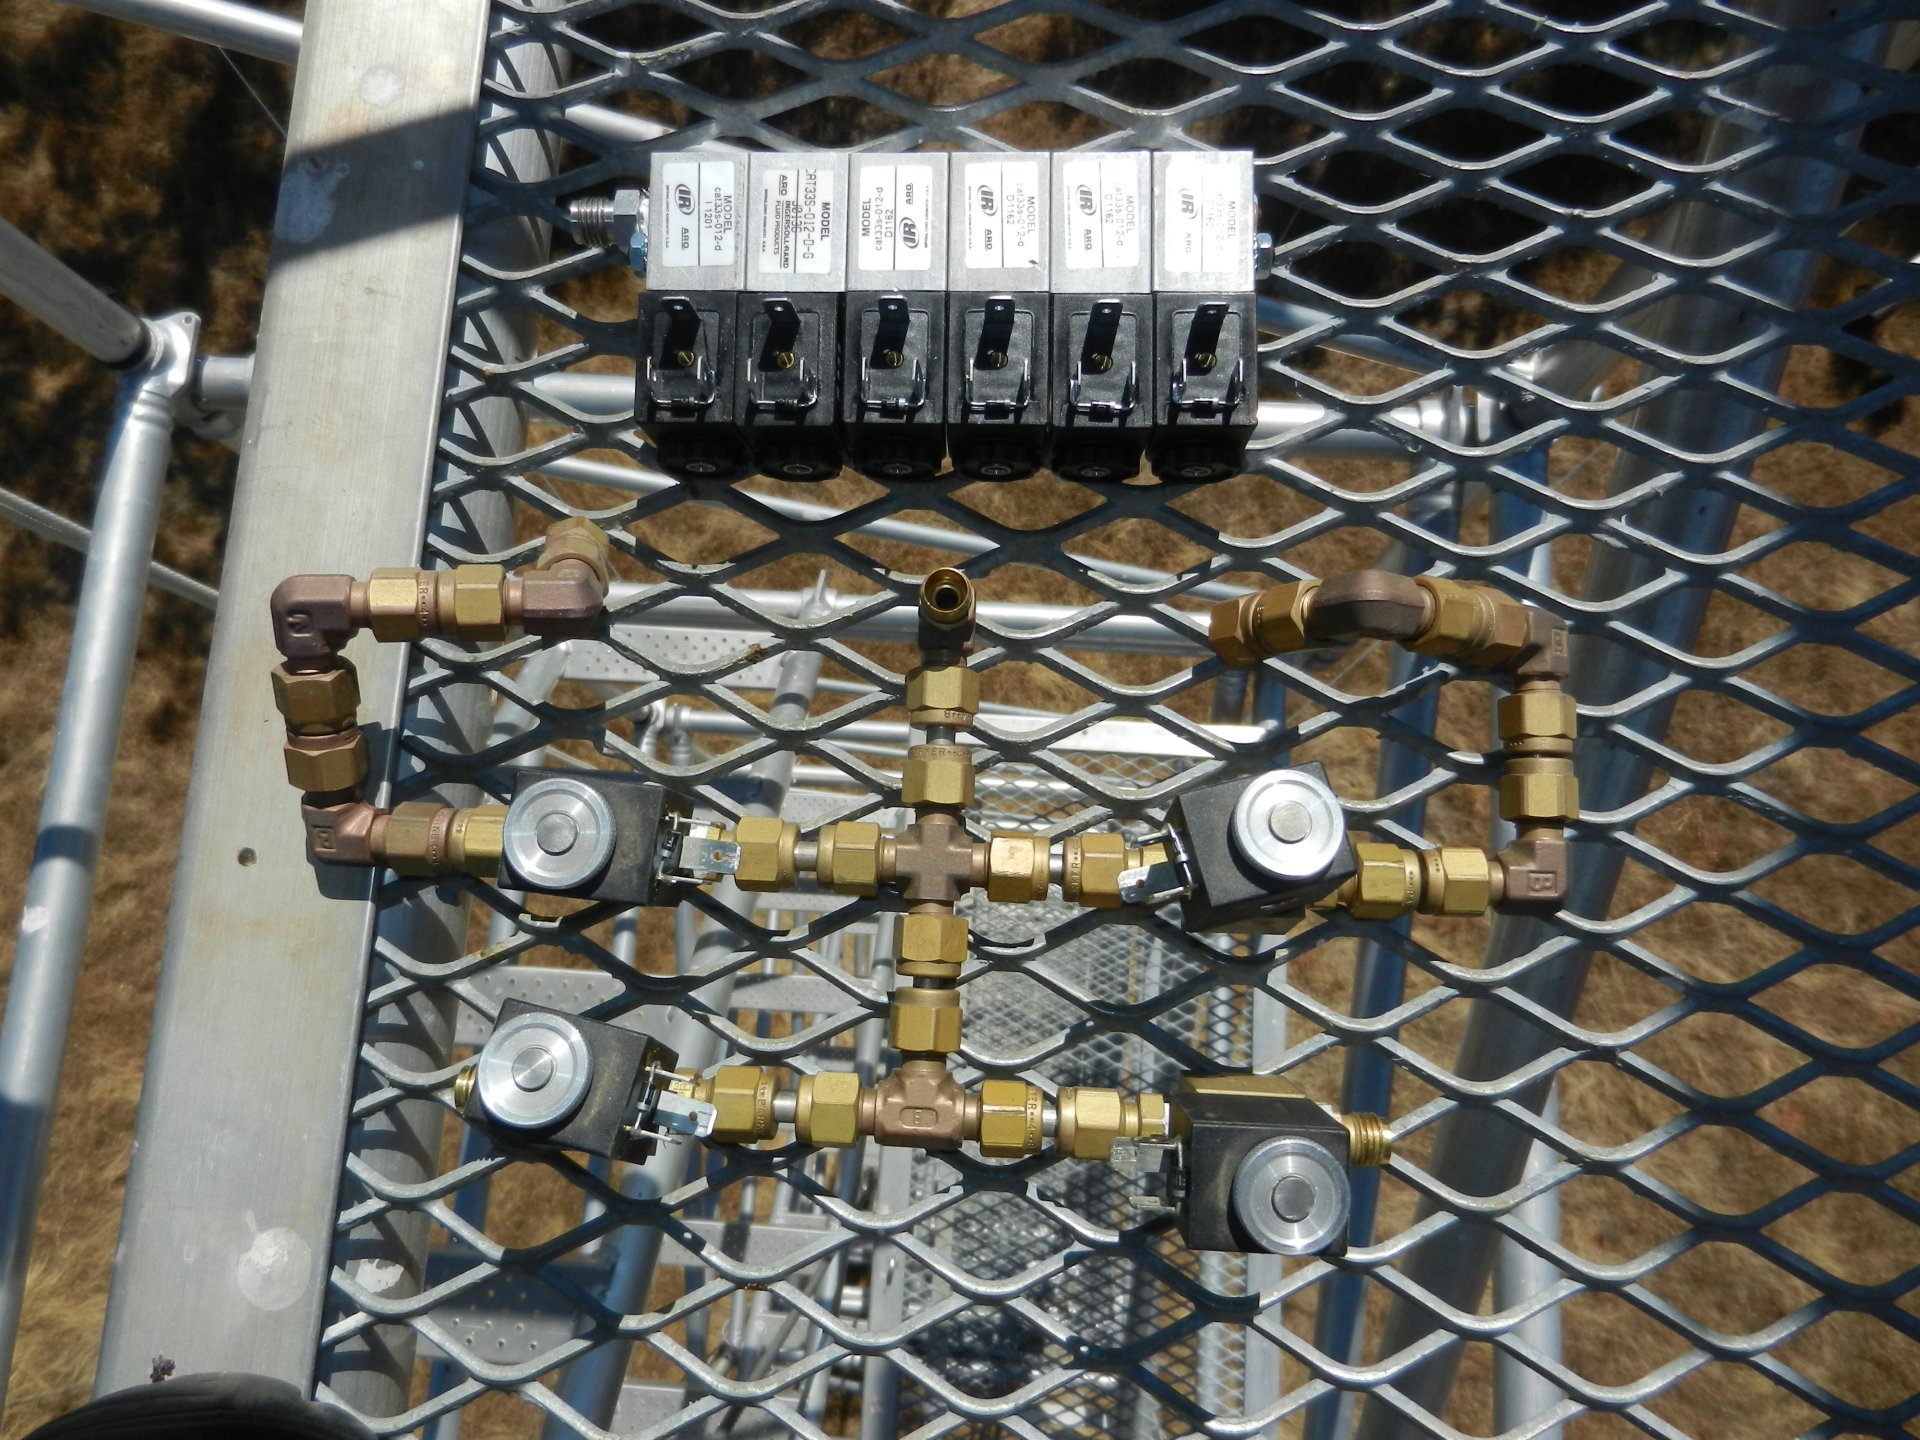
2012-08-08 I arrived about 10:30. Martin and Erika had arrived shortly before me and were just finishing setting up the scaffolding we rented on our way out of Berkeley. Martin and Erkia did leaf surveys all day leaving Tonzi about 7pm. The day was clear, sunny and hot with a little breeze. Sitting in the sun was uncomfortable but the shade was not bad. The trees are beginning to look at little stressed some with yellow or brown leaves. I worked on retrofitting the CO2 profile plumbing. I removed the four old solenoids and tube fittings. I replaced them with six new, stackable solenoids two of which are capped and not connected to relays. These two extra solenoids are for the future addition of two more inlet locations. The four other solenoids were connected to the inlet ports by bev-a-line tubing and to the existing relays. The relays have a relay, a transistor and a resistor jammed into an IC mount and a 200mA fuse. I installed one of the old KNF pumps that I blew the carbon out of and seemed to be in working order. I cleaned up some of the wiring in the IRGA box. I replaced all the filters. The ones at the inlets were brown with dust the one after the solenoids was relatively clean. I had to lower the sonic and IRGA briefly to reach the top inlet. After getting all the hardware swapped out I calibrated the system. Siyan had turned off the gas tanks. I turned them back on. The N2 tank was at 1400psi and the CO2 tank of 421.63ppm CO2 in air was at 1100psi. At 12:48 PST the Licor reported: 947mBar, 52.6C, Heat ON, filter zero, span 1000ppm, path 5.5cm. Zero was off by -6.5ppm and span was nearly right on and 423.5ppm. I service the Z-cams. The tram was running. The computers and data streams seemed okay. The HMP45 fans were running and the radiometers looked clean. Siyan mentioned that the tower computer was making noise, but it wasn’t while I was there. I checked its fan and it seemed okay. I removed some of the 2008 archived data and some of the archived stardot images to free up space on the hard drives. The 2cm and 4cm CO2 probes under tree one were reporting strange numbers. The two cm one was close to zero and the 4cm was maxed. I removed both from their cases and unplugged them from their cables. After plugging them in again the 4cm one seemed okay but the 2cm was still reading about zero. It looked like a little bit of water may have leaked in from the top, or dripped from condensation. There may have been a little bit of corrosion on the bottom end of the probes. I replaced them in there encasements and resealed them with silicone. About 4pm the group from USC arrived to get a quick orientation before starting to install soil moisture probes over the next week. They plan to hang a box, small solar panel and antenna on the tower and to install up to 30 remote nodes in the surrounding area within 300m of the tower. |
Field Data
No tank data
No TZ Well data found
No TZ Moisture Point data found
No VR Moisture Point data found
No TZ grass heigth found
No VR grass heigth found
No TZ Tree DBH found
No water potential data found
No TZ Grass Biomass data found
No TZ OakLeaves Biomass data found
No TZ PineNeedles Biomass data found
15 photos found
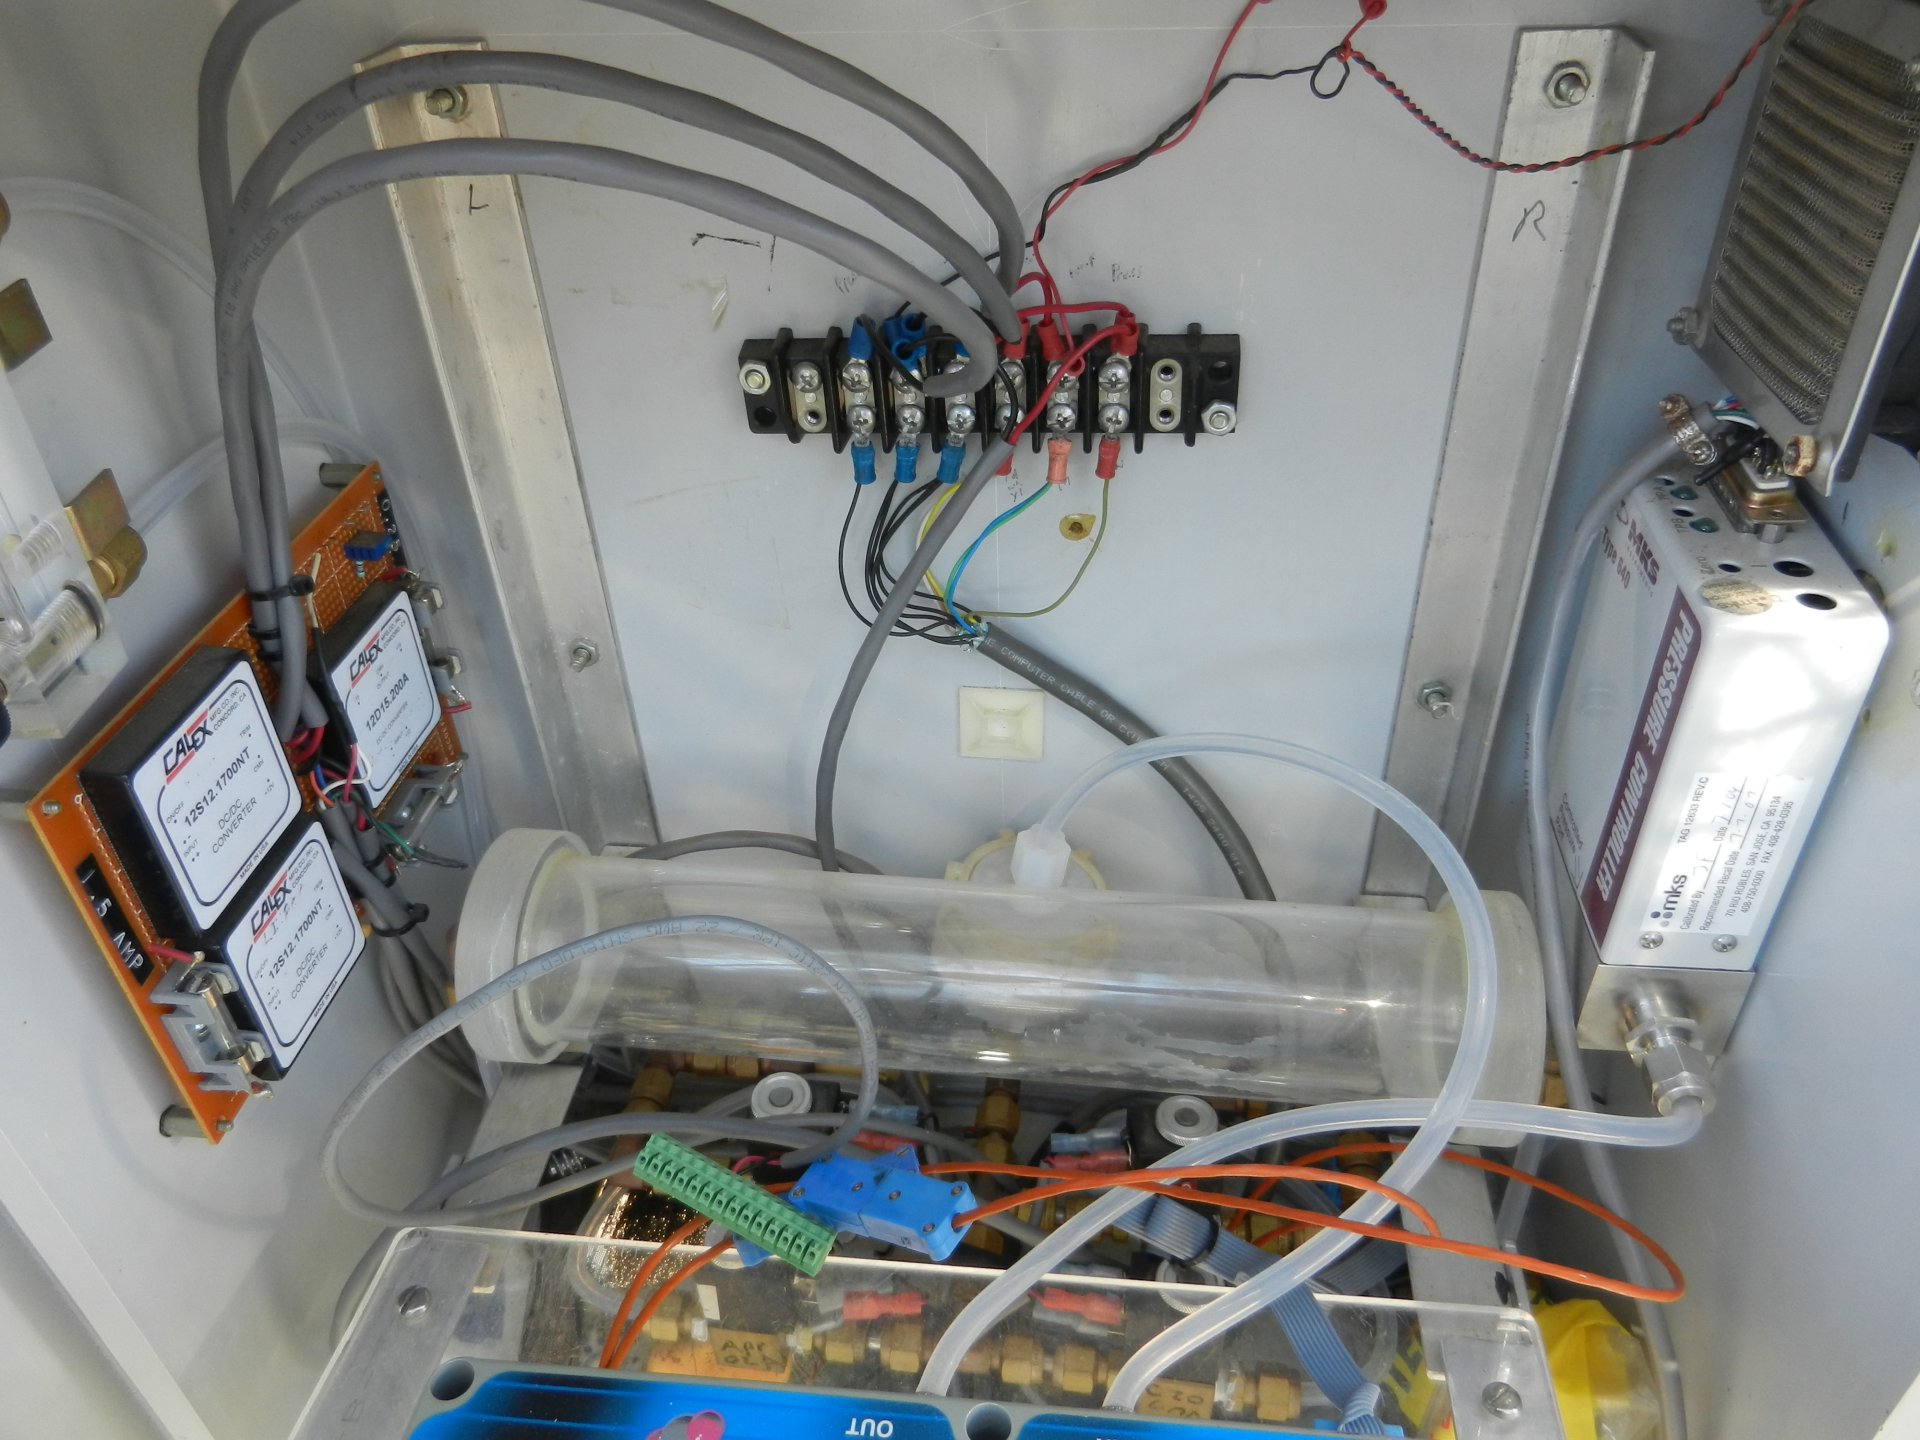
20120808TZ_CO2ProfileBox.jpg ( 2012-08-08 10:36:02 ) Full size: 1920x1440
Wiring inside the CO2 profile box on the Tonzi Tower
20120808TZ_LeafSurvey.jpg ( 2012-08-08 15:00:52 ) Full size: 1920x1440
Martin and student on scaffolding for oak leaves
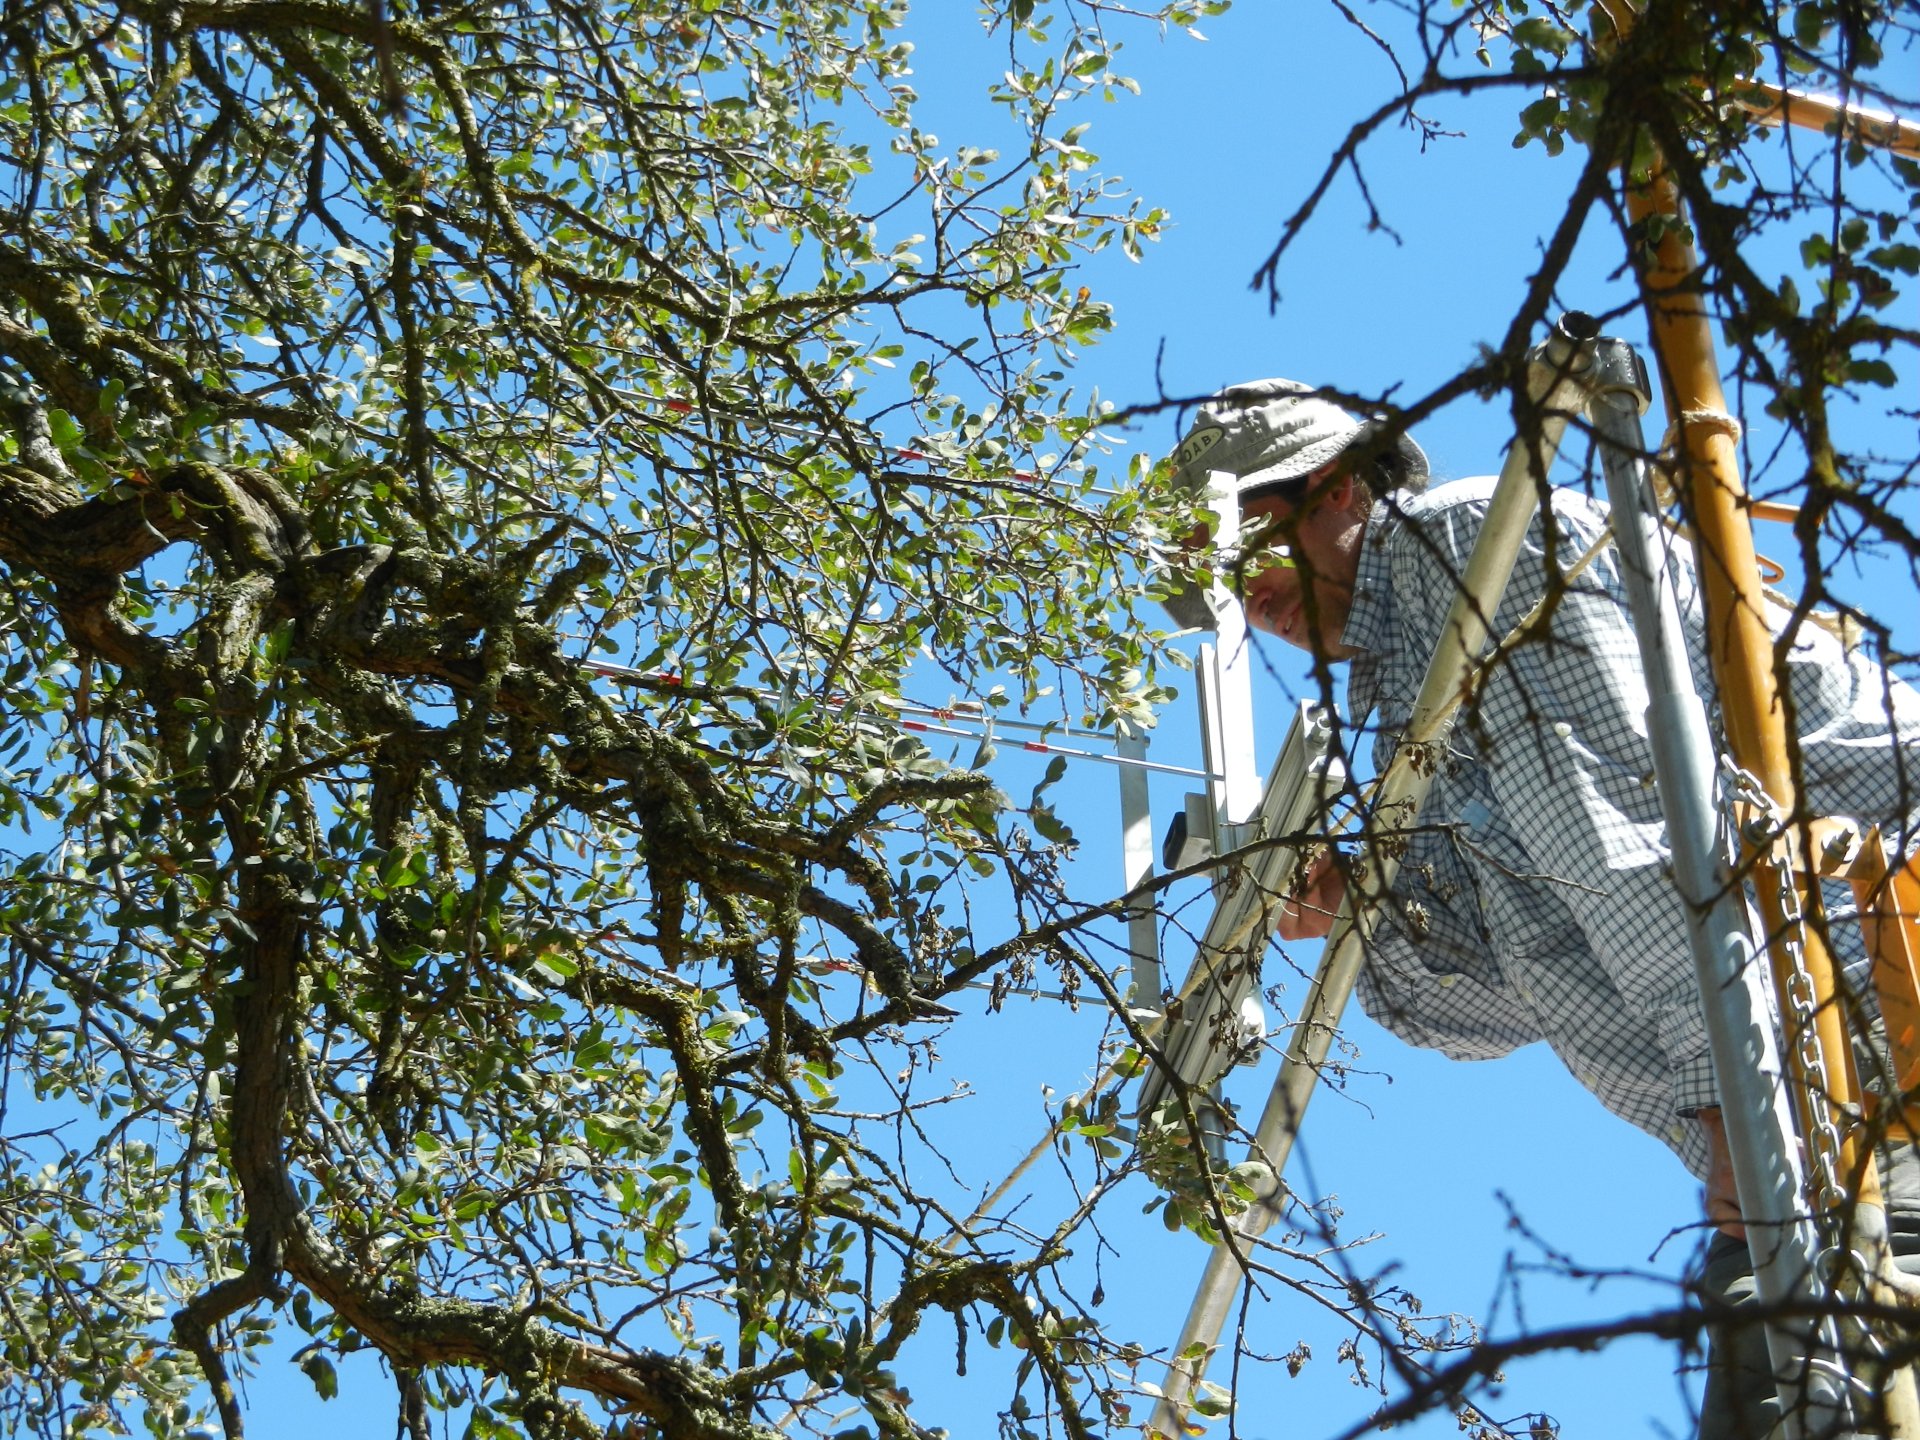
20120808TZ_LeafSurveyZoom.jpg ( 2012-08-08 15:01:01 ) Full size: 1920x1440
Martin making clumping measurements from the scaffolding
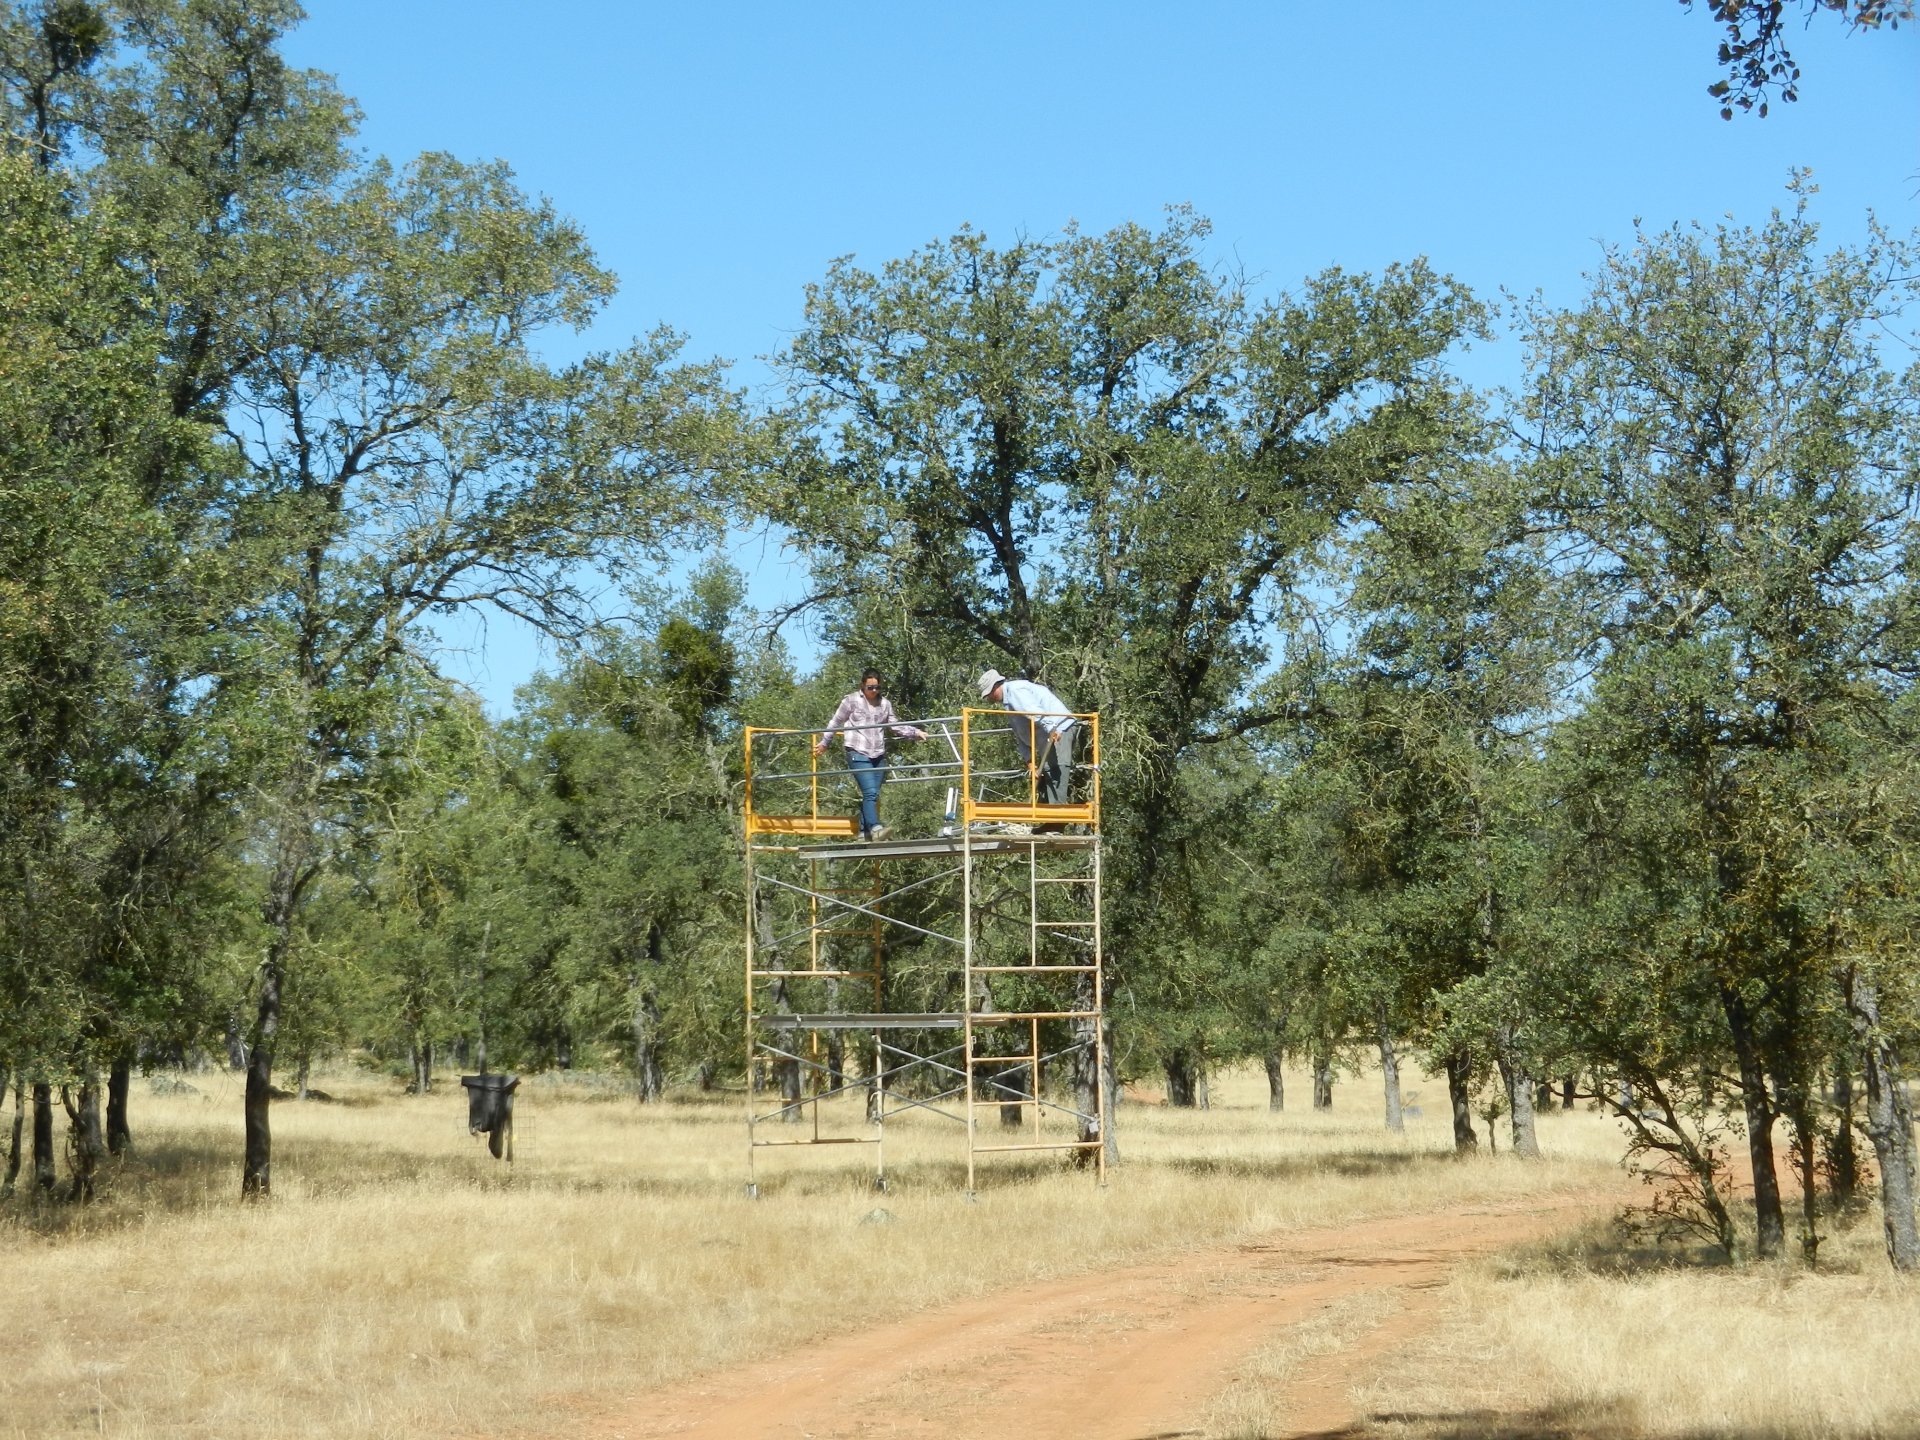
20120808TZ_MartinErikaScaffolding1.jpg ( 2012-08-08 10:31:34 ) Full size: 1920x1440
Martin and Erika counting leaves from the scaffolding
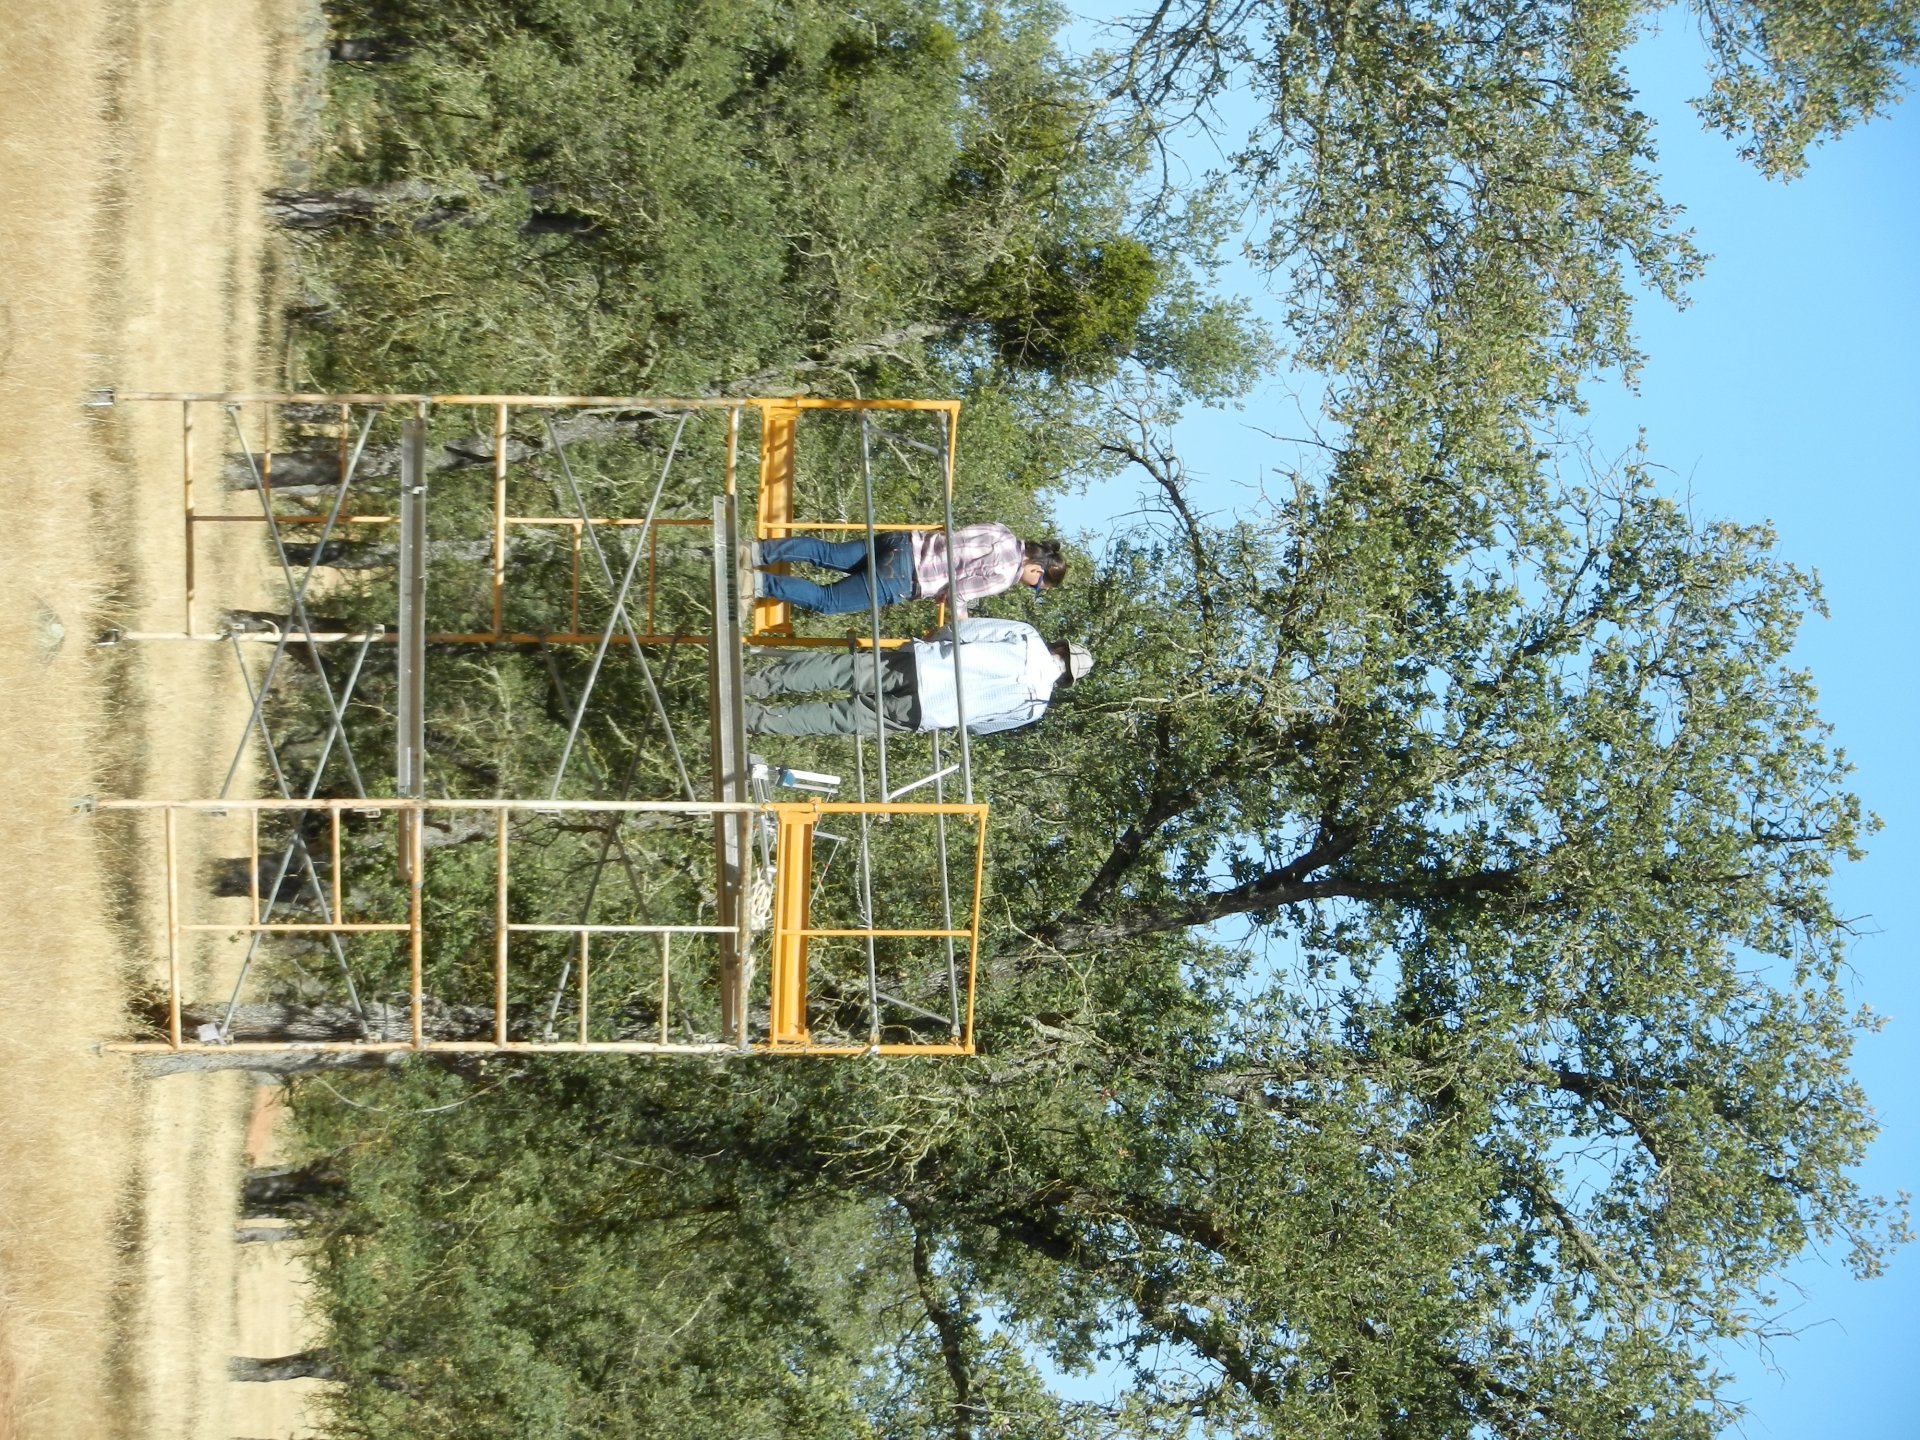
20120808TZ_MartinErikaScaffolding2.jpg ( 2012-08-08 10:31:51 ) Full size: 1920x1440
Martin and Erika counting leaves from the scaffolding
20120808TZ_MartinErikaScaffolding3.jpg ( 2012-08-08 15:01:29 ) Full size: 1920x1440
Martin and Erika counting leaves from the scaffolding
20120808TZ_MartinErikaScaffolding4.jpg ( 2012-08-08 15:01:43 ) Full size: 1920x1440
Martin and Erika counting leaves from the scaffolding
20120808TZ_OldvsNewSolenoids.jpg ( 2012-08-08 10:46:44 ) Full size: 1920x1440
Manifold and solenoids removed from the Tower CO2 profile system

20120808TZ_RelayBox1.jpg ( 2012-08-08 13:13:56 ) Full size: 1920x1440
Wiring inside the relay box
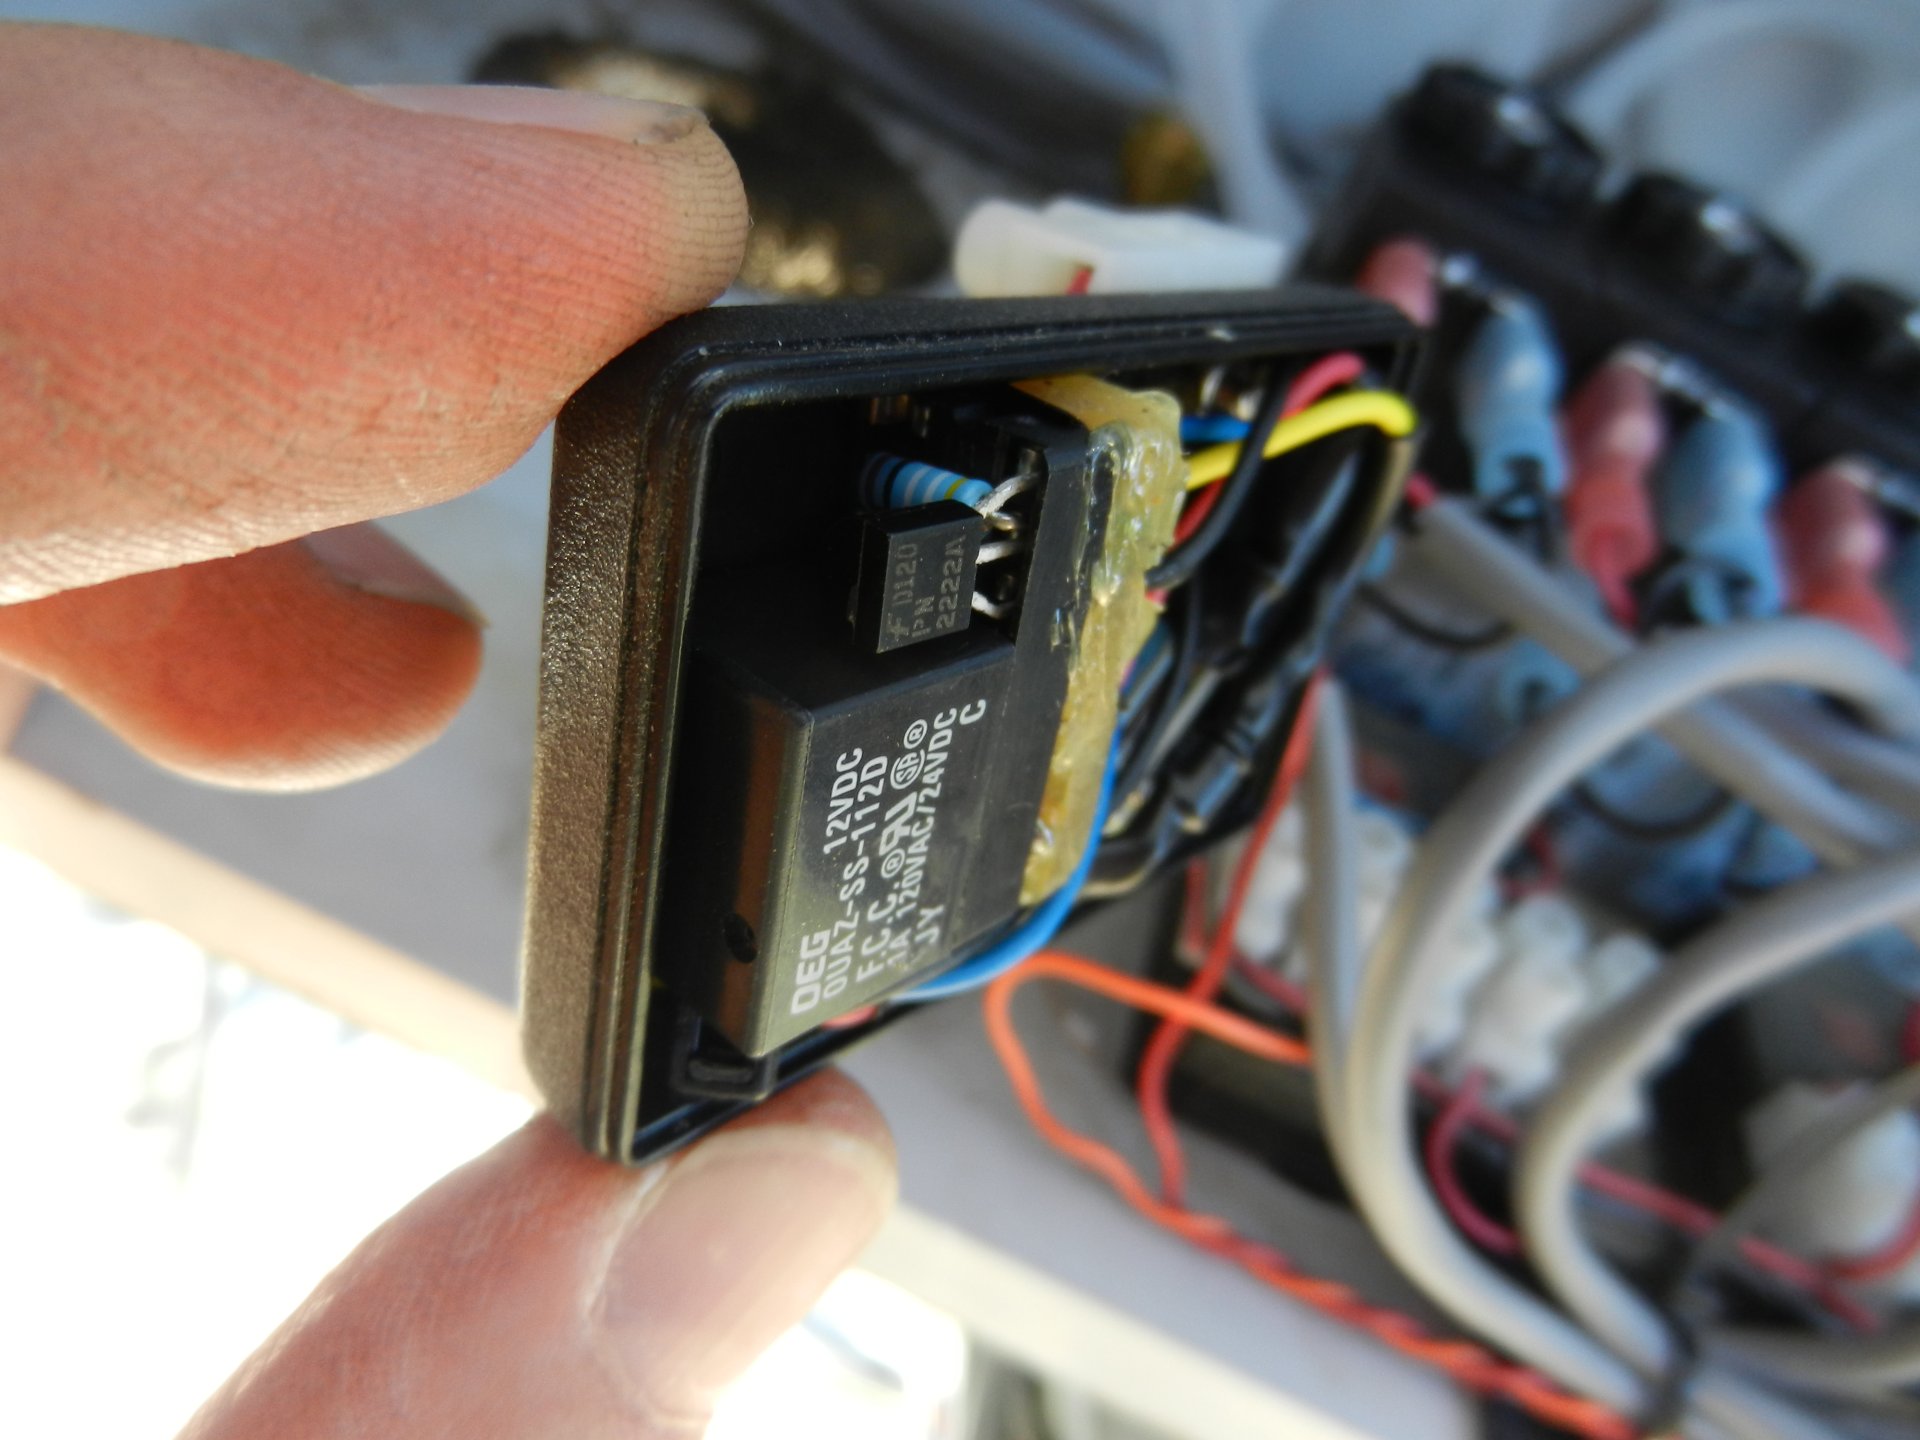
20120808TZ_RelayBox2.jpg ( 2012-08-08 13:14:19 ) Full size: 1920x1440
Wiring inside the relay box
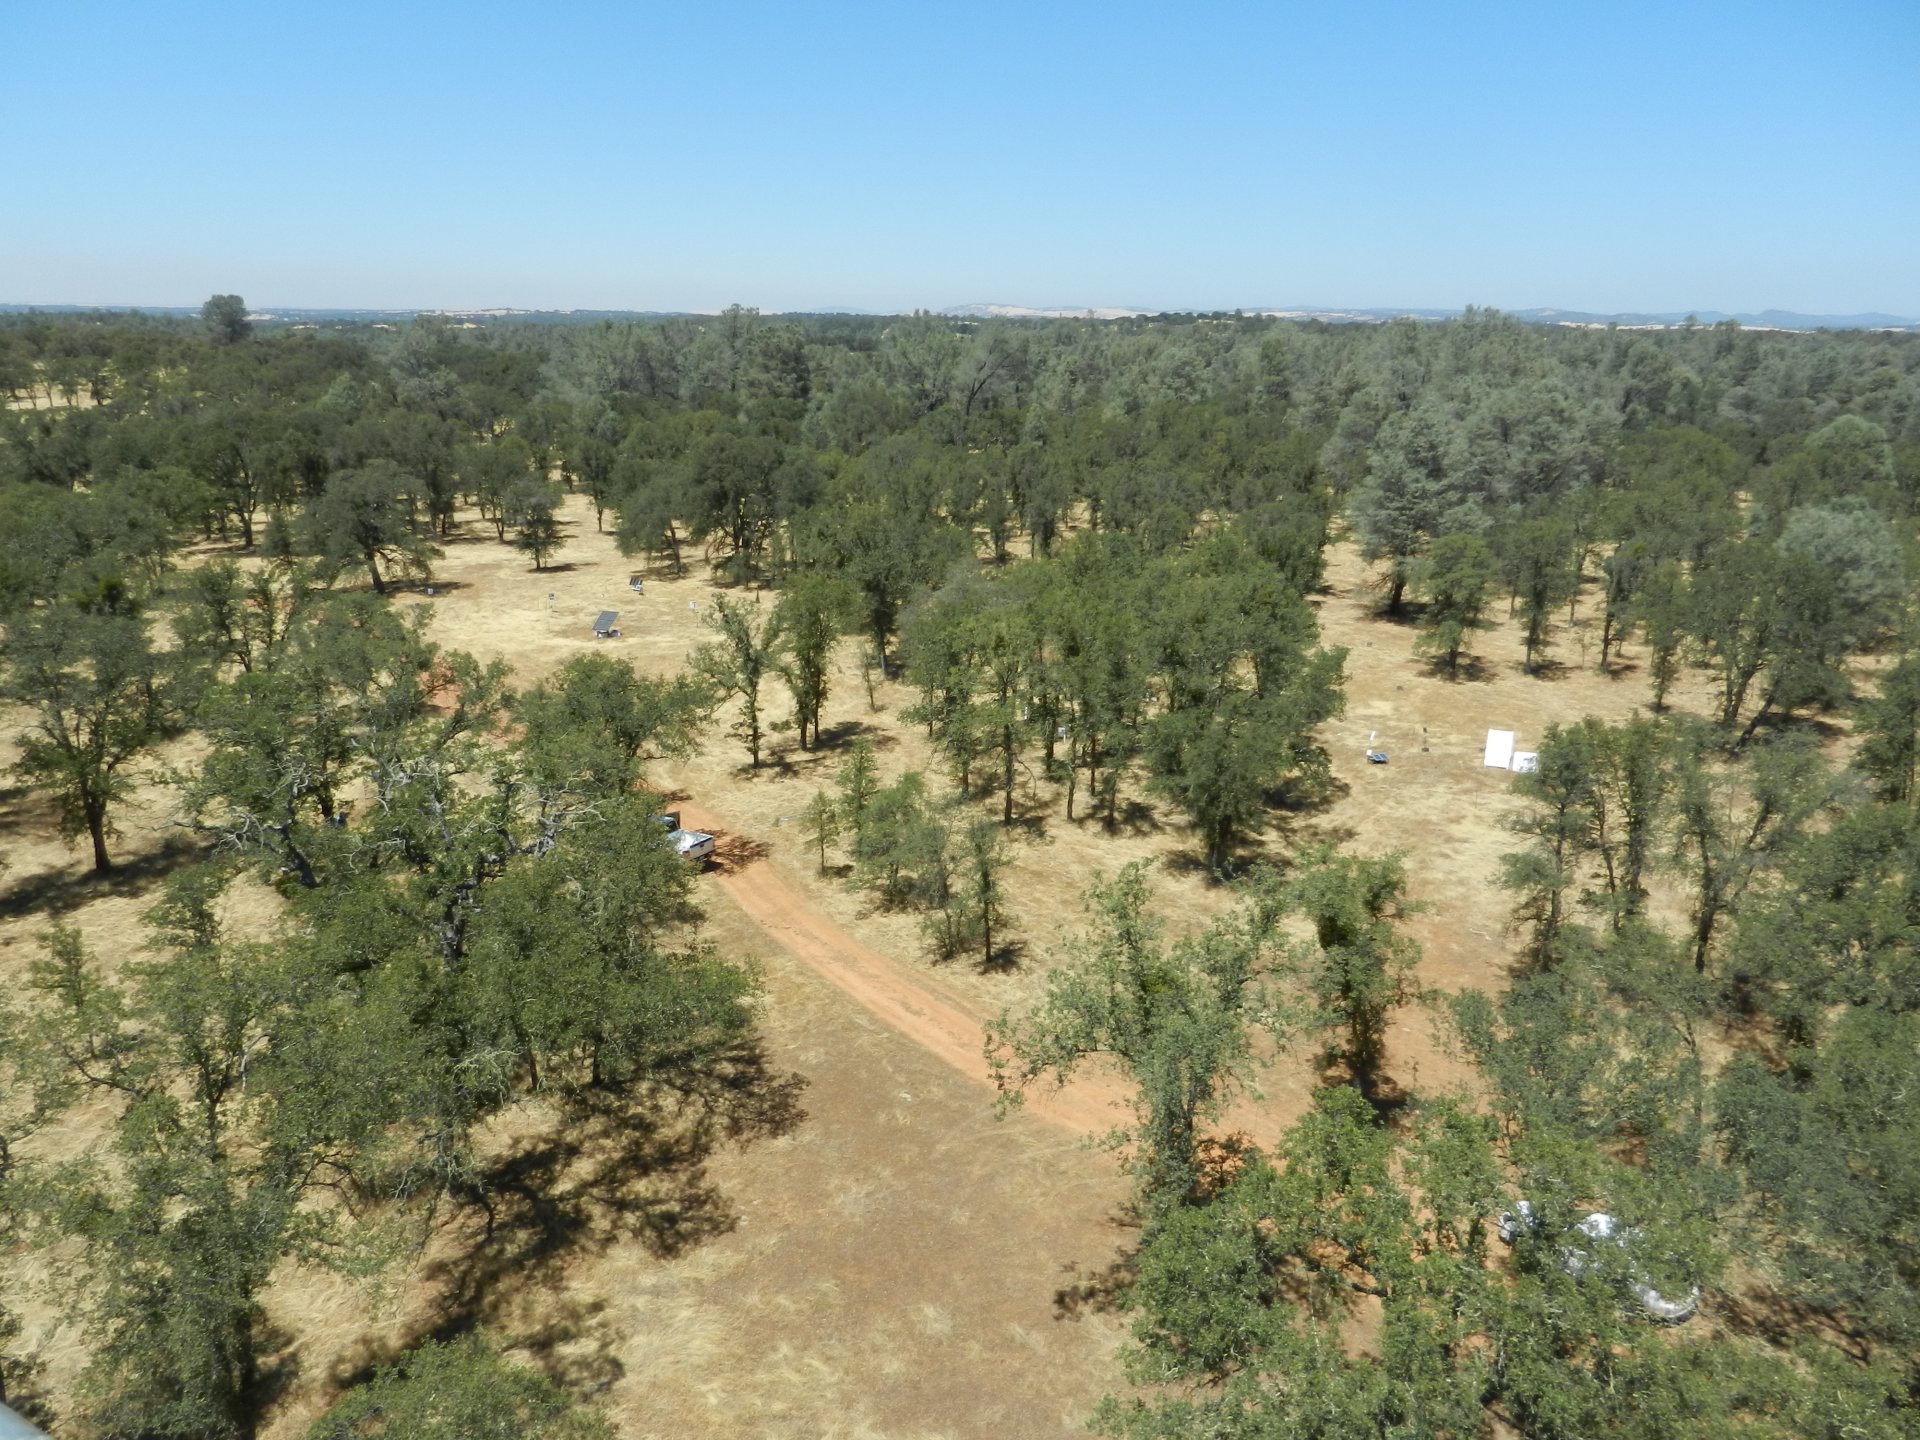
20120808TZ_Site.jpg ( 2012-08-08 13:39:47 ) Full size: 1920x1440
View of oak woodland from tower top
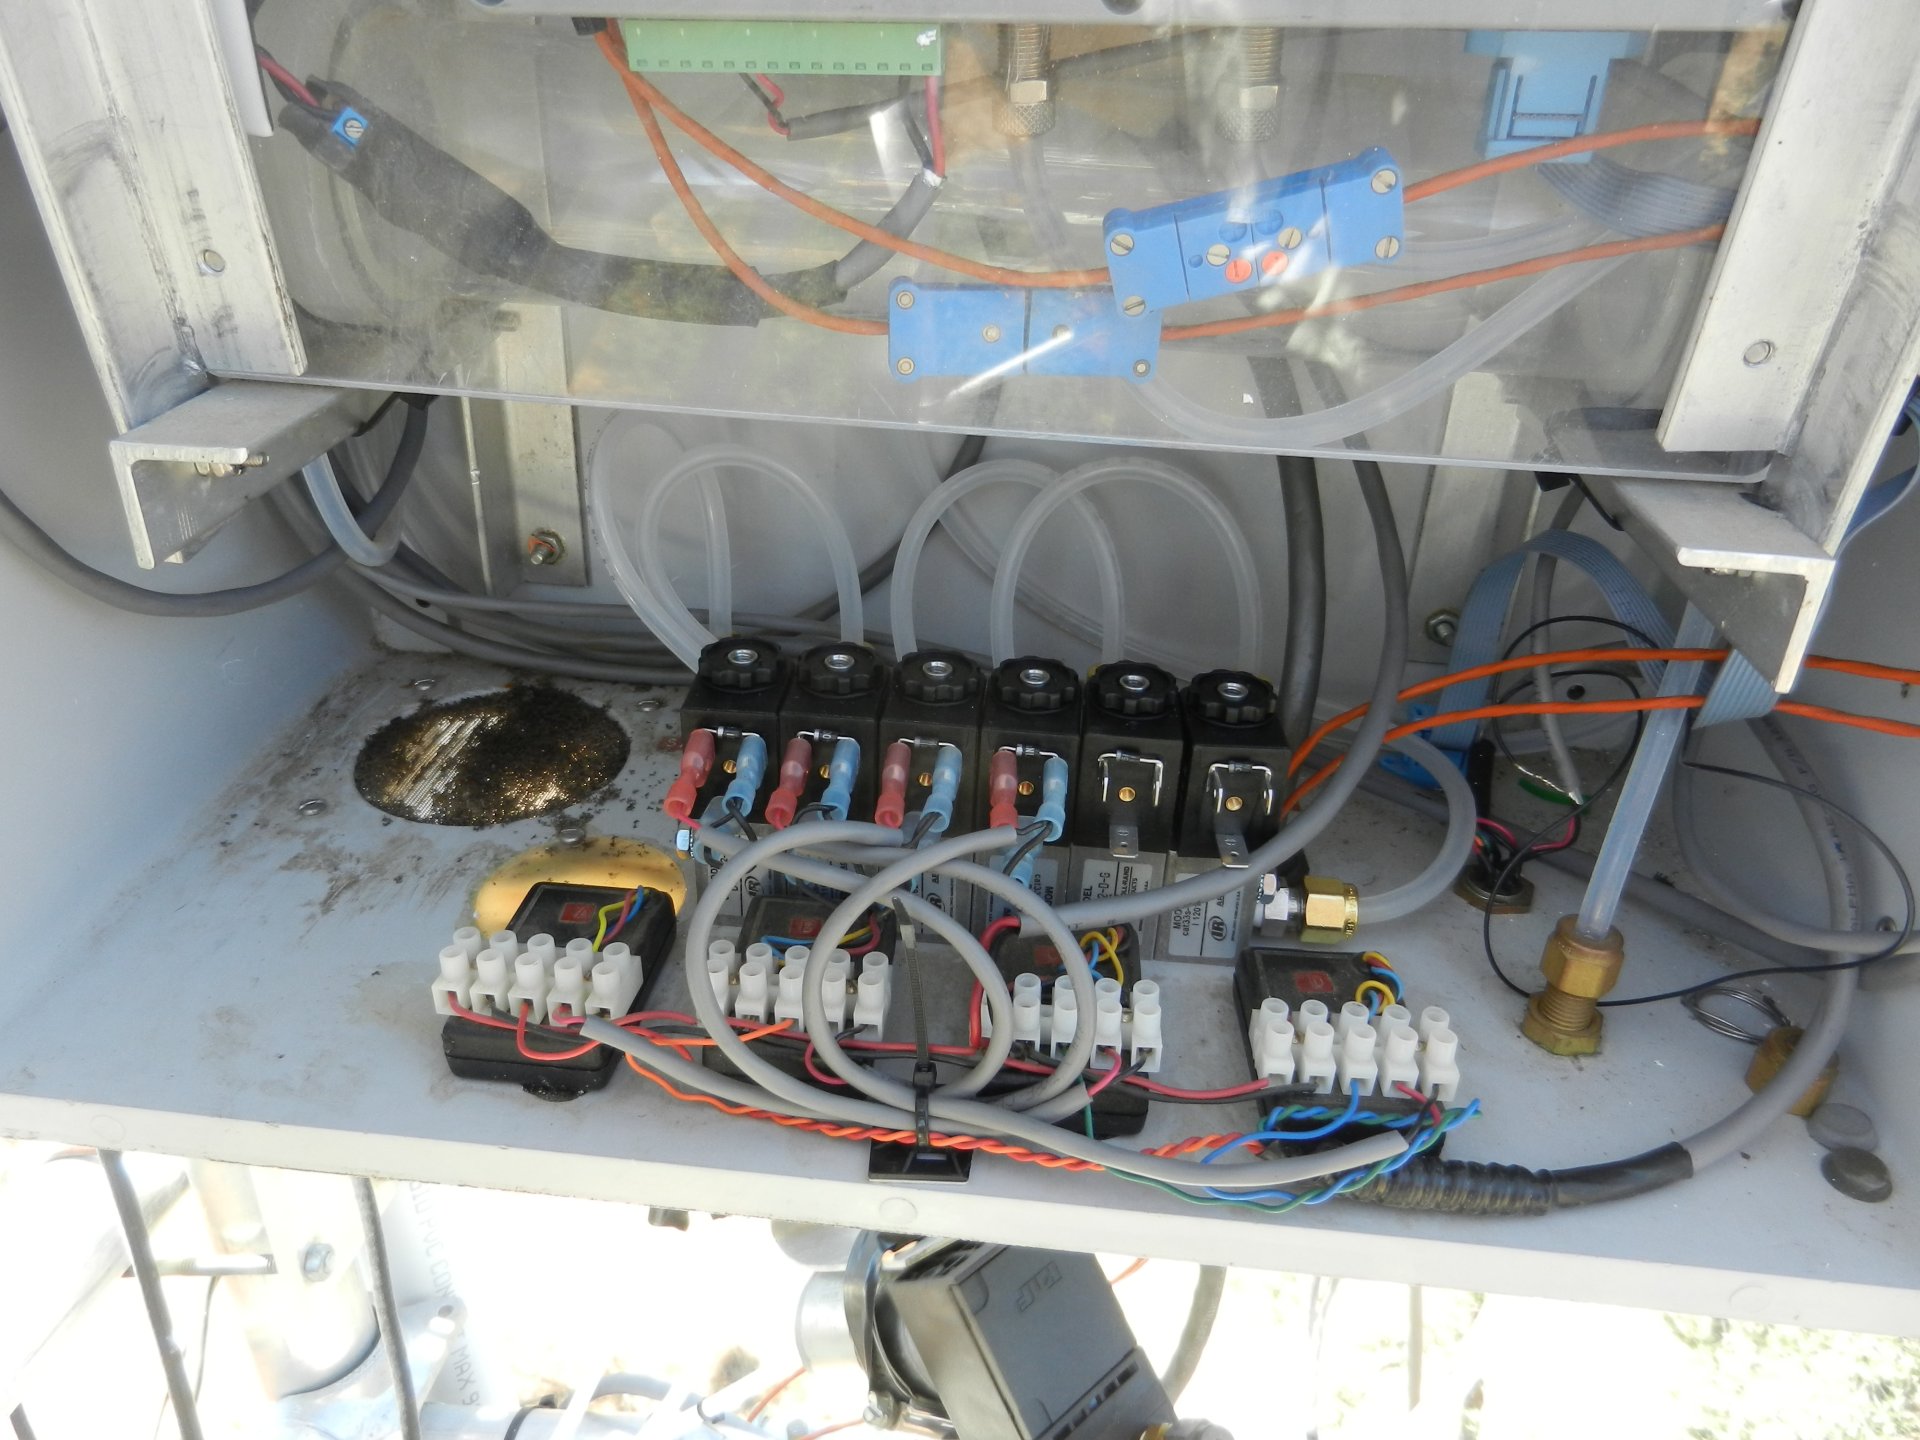
20120808TZ_SolenoidsAfter.jpg ( 2012-08-08 14:08:29 ) Full size: 1920x1440
Solenoid wiring in the CO2 profile box
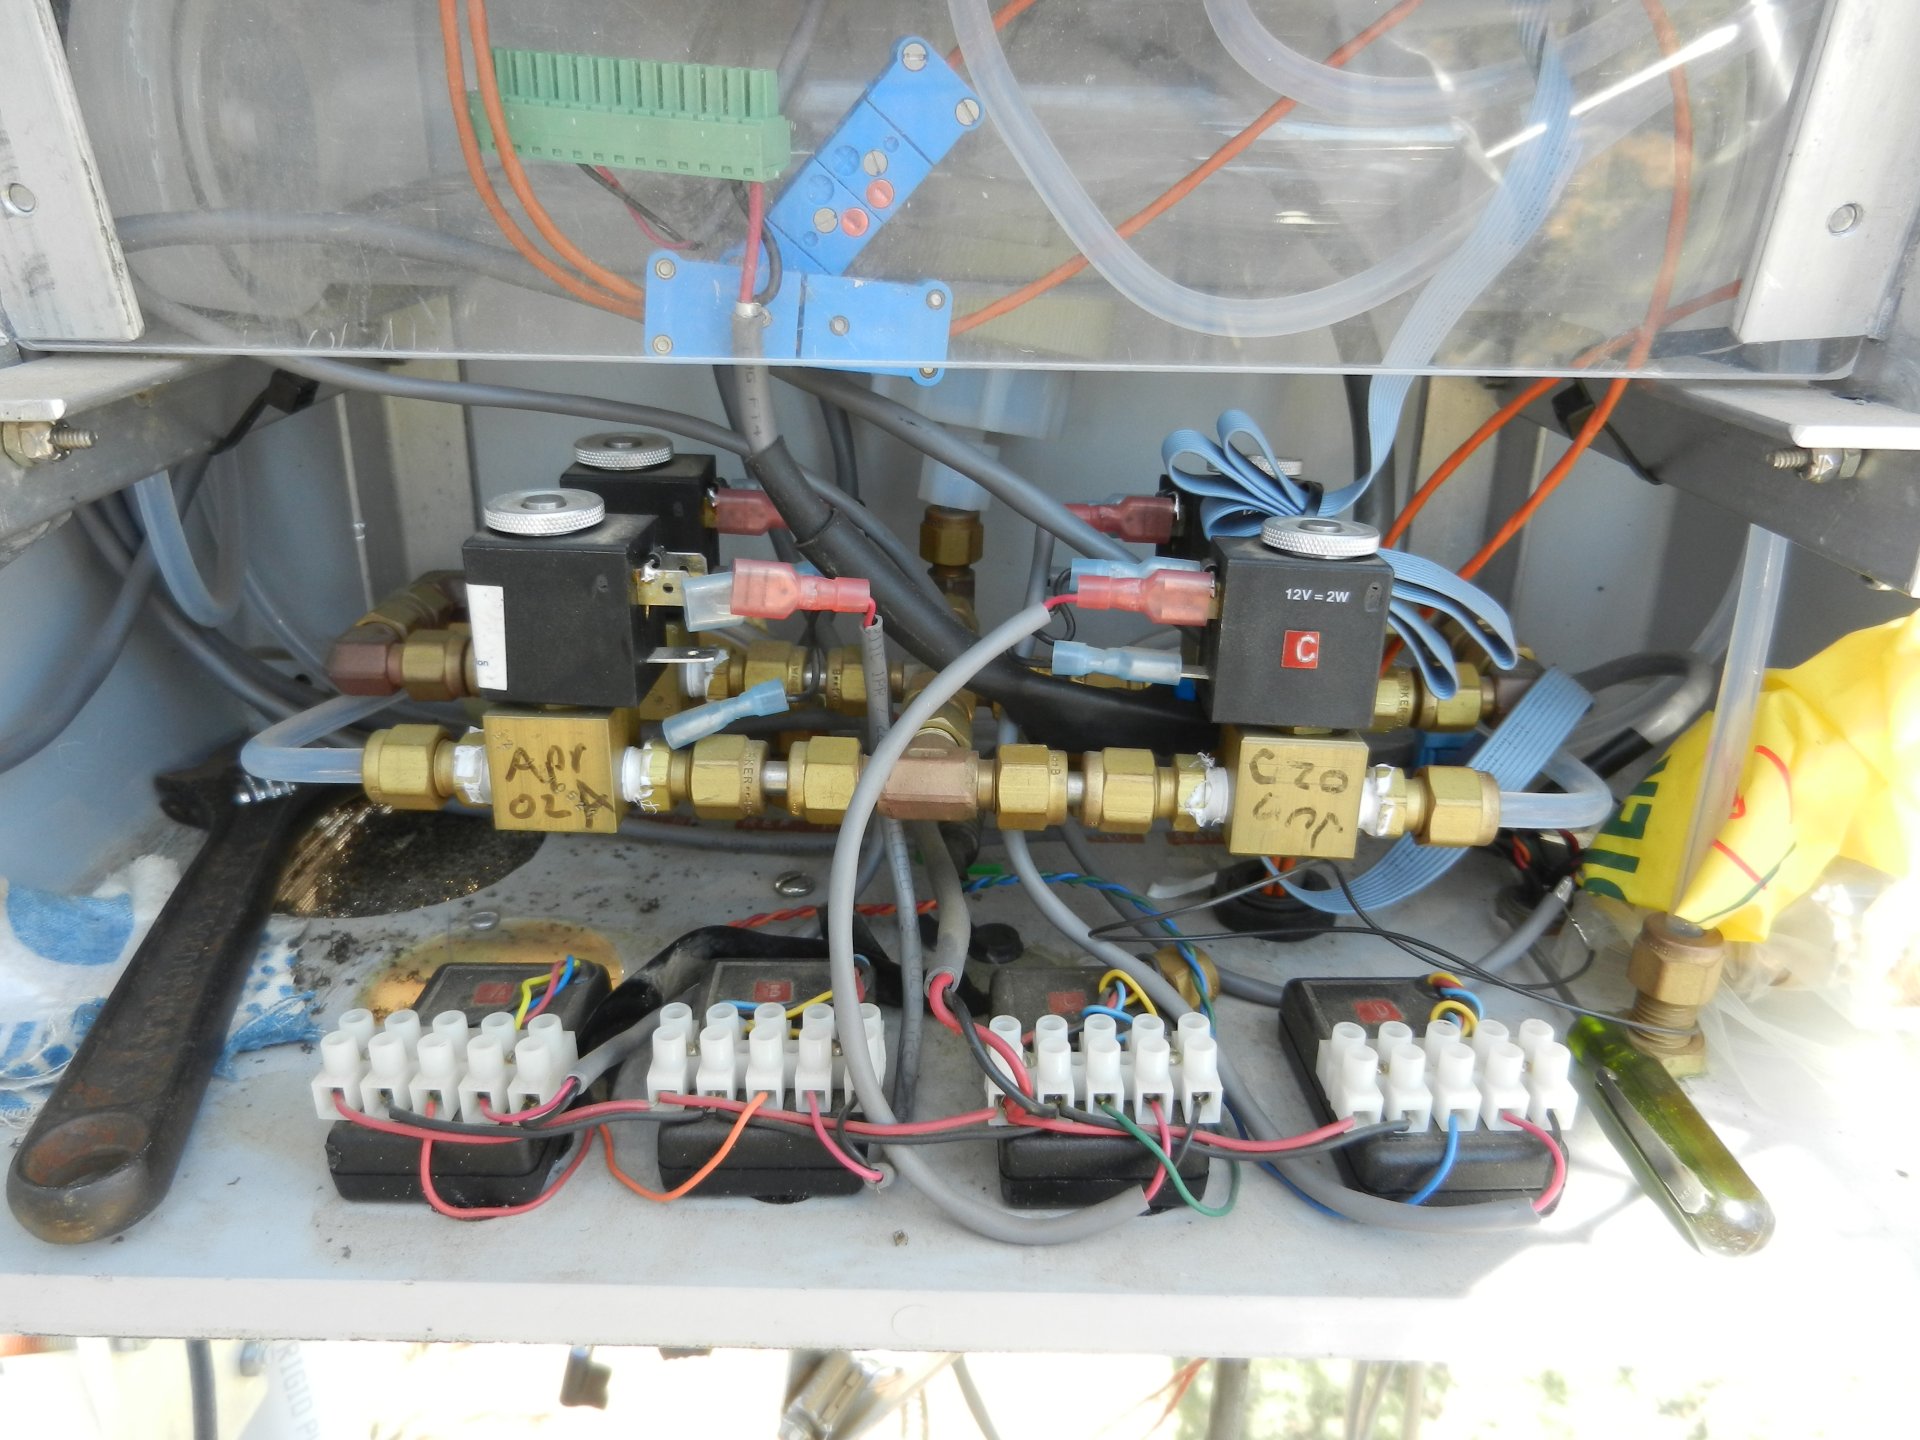
20120808TZ_SolenoidsBefore.jpg ( 2012-08-08 10:35:47 ) Full size: 1920x1440
Solenoid wiring from Tower CO2 profile system
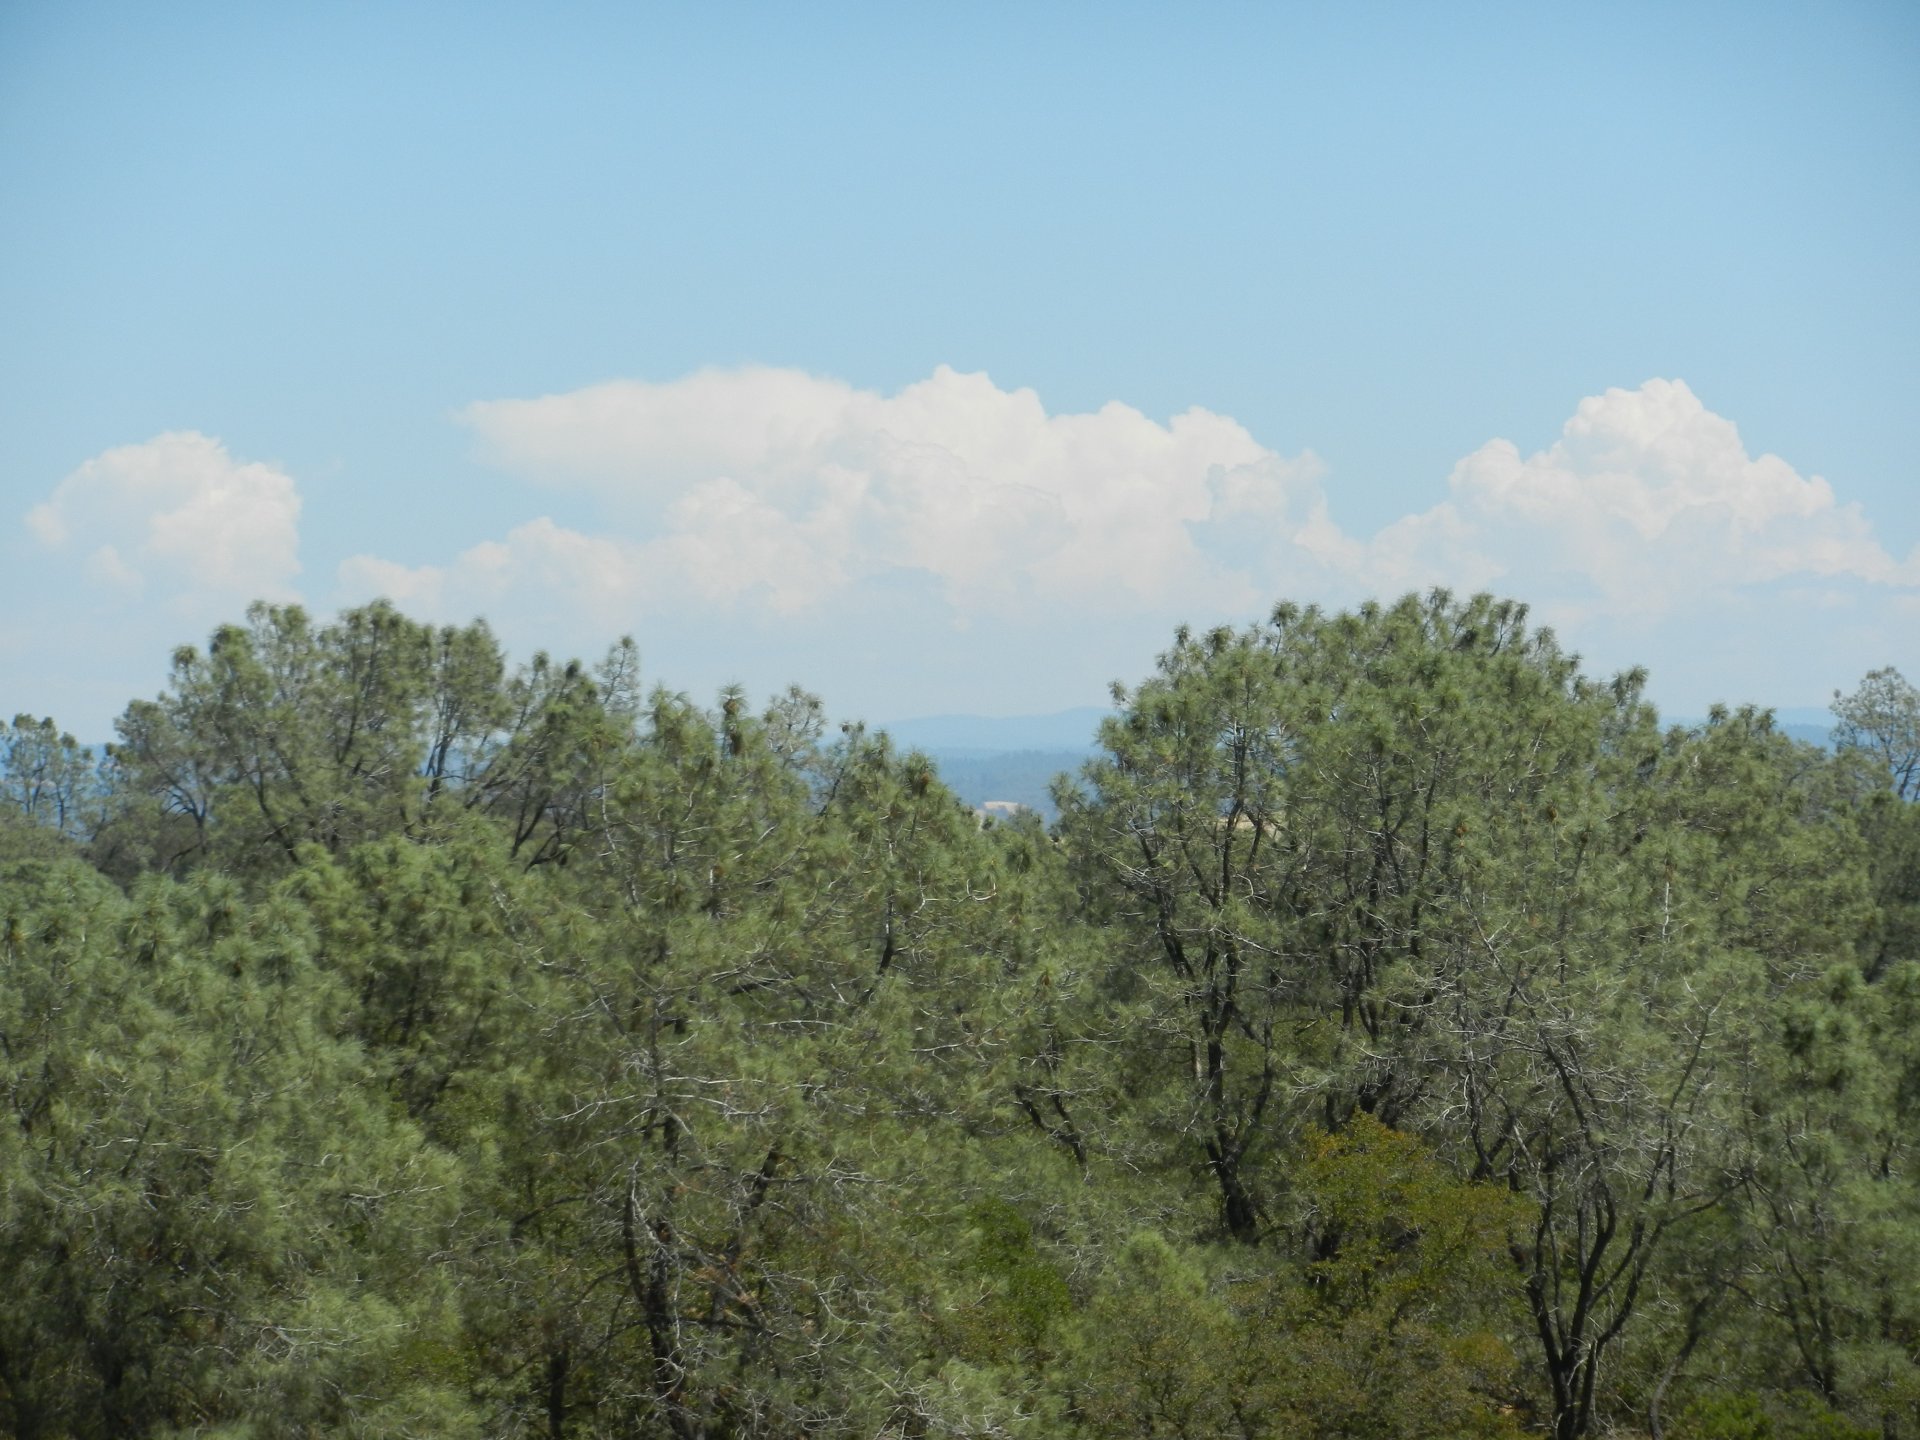
20120808TZ_Thunderheads.jpg ( 2012-08-08 13:39:29 ) Full size: 1920x1440
Thunderheads above the pine canopy
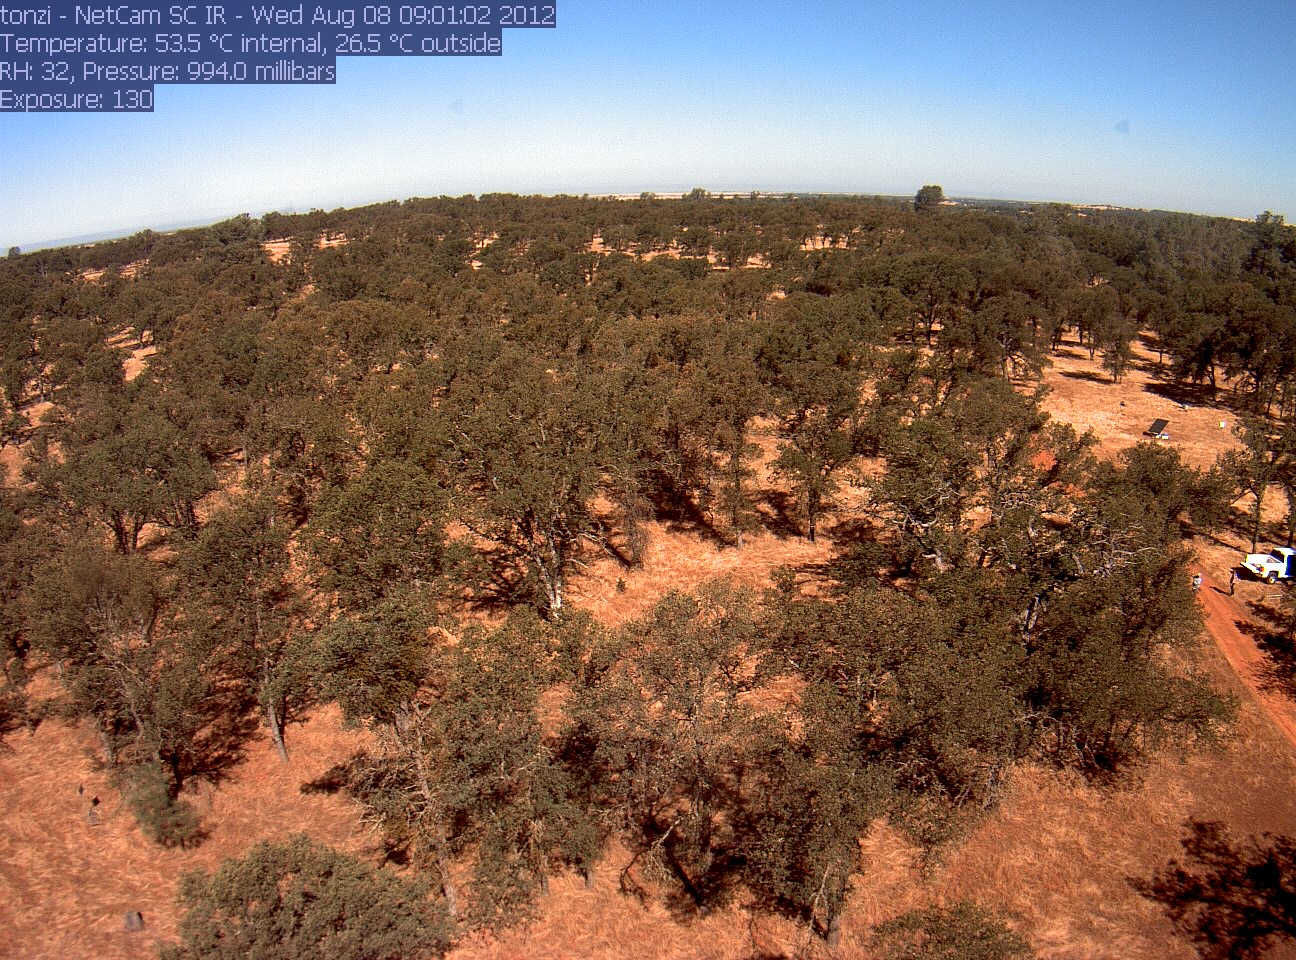
tonzi_2012_08_08_090102.jpg ( 2012-08-08 08:59:08 ) Full size: 1296x960
Field visit
16 sets found
No data found for TZ_Fenergy.
11 TZ_tmet graphs found
11 TZ_soilco2 graphs found
Can't check TZ_mixed
3 TZ_mixed graphs found
1 TZ_fflux graphs found
8 TZ_fmet graphs found
1 TZ_tram graphs found
3 TZ_co2prof graphs found
No data found for TZ_irt.
No data found for TZ_windprof.
1 TZ_tflux graphs found
2 TZ_sm graphs found
Can't check TZ_met
1 TZ_met graphs found
Can't check TZVR_mixed
8 TZ_osu graphs found
No data found for TZ_fd.
Tonzi Z-cam data