Field Notes

<--2012-06-13 09:30:00 | 2012-06-29 11:30:00-->
Other sites visited today: West Pond | Twitchell Rice | DWR Corn | Mayberry | DWR Corn
Phenocam link: Searching...

Sherman Island: 2012-06-21 09:30:00 (DOY 173)
Author: Sara Knox
Others: Carina

Summary: LAI, spectral, moisture point measurements, collected data

Carina and I arrived at the site around 9:30 PDT. It was sunny, relatively cool, with a gentle breeze. I collected all the data from the computer, and made moisture point and well measurements. Carina took LAI measurements with the LAI 2000 and made spectral measurements.

3 photos found

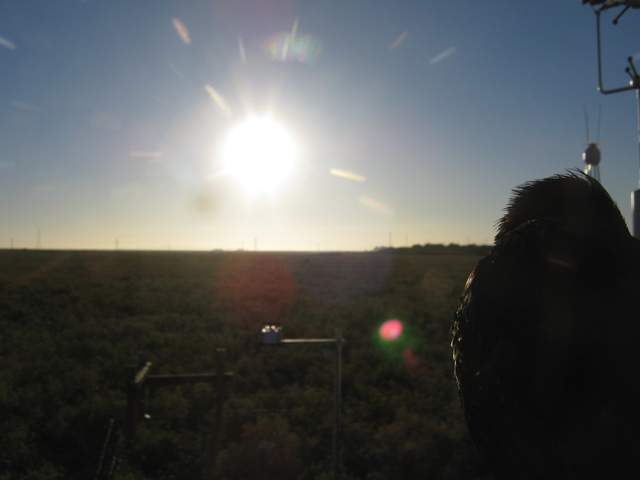
Bird perched in front of camera
SI_autocam_20120620_1845.jpg ( 2012-06-20 18:45:03 ) Full size: 1920x1440
Bird perched in front of camera
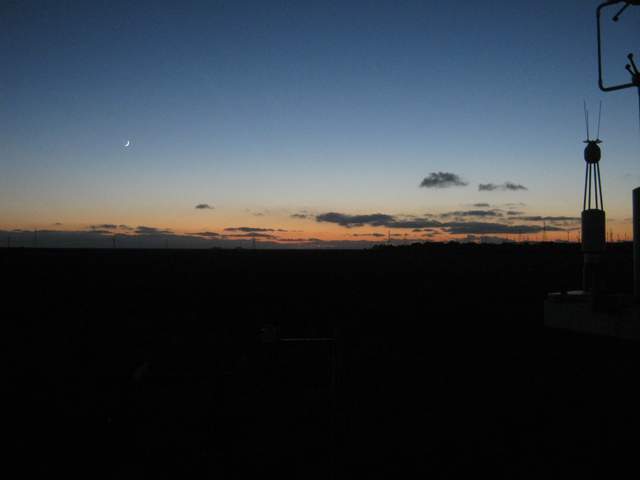
Moon just after sunset
SI_autocam_20120621_2015.jpg ( 2012-06-21 20:15:03 ) Full size: 1920x1440
Moon just after sunset
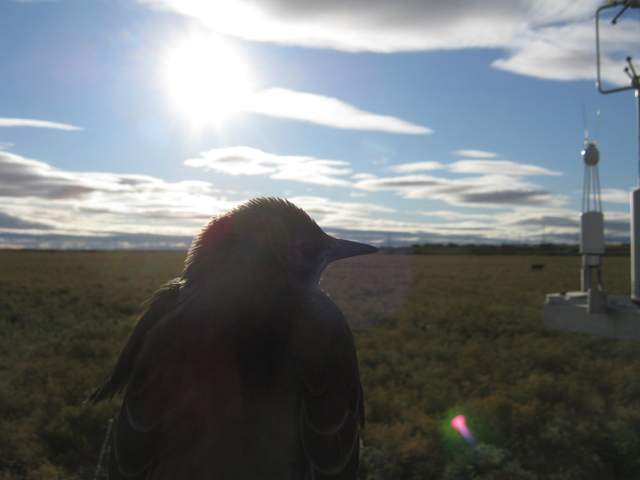
Bird perched in front of camera
SI_autocam_20120622_1815.jpg ( 2012-06-22 18:15:02 ) Full size: 1920x1440
Bird perched in front of camera

Graphs display:
7 sets found

No data found for SI_mp.
11 SI_met graphs found

Explore the graph:Solar Radiation in a new window

Explore the graph:Energy in a new window

Explore the graph:Soil Temperatures Set 1 in a new window

Explore the graph:Soil Temperatures Set 2 in a new window

Explore the graph:Soil Temperatures Set 3 in a new window

Explore the graph:Soil Temperature at -16cm in a new window

Explore the graph:LED NDVI Sensor Output in a new window

Explore the graph:Solar Radiation from CNR1 in a new window

Explore the graph:Sherman Island Rain in a new window

Explore the graph:Sherman Well Level in a new window

Explore the graph:Box Temperatures in a new window

Can't check SI_mixed
2 SI_mixed graphs found

Explore the graph:Theta Probes in a new window

Explore the graph:Sherman Island Air Temperatures in a new window

4 SI_flx graphs found

Explore the graph:Sonic Wind in a new window

Explore the graph:CH4 Concentrations in a new window

Explore the graph:Sample Counts in a new window

Explore the graph:LI7500 CO2 and H2O in a new window

3 SI_soilco2 graphs found

Explore the graph:Sherman Island Vaisala Soil CO2 in a new window

Explore the graph:Soil CO2 Temperatures in a new window

Explore the graph:Soil CO2 Reference Soil Temperatures in a new window

Can't check TWSI_mixed
Can't check SIMBTWEE_met