Field Notes
<--2012-02-09 13:30:00 | 2012-02-16 11:30:00-->Other sites visited today: Tonzi | Vaira
Phenocam link: Searching...
Tonzi: 2012-02-16 09:30:00 (DOY 47)
Author: Siyan Ma
Others: Joe
Summary: Installed soil co2 equipment at Vaira (probes not in ground yet), reinstalled soil co2 profiles at Tonzi
Tonzi Ranch: 2012-02-16 09:30:00
|
 |
 |
Summary
- A new set of solar panel was install at Vaira, and the enclosure including 9 transmitters, 9 Vaisala CO2 probes, and 9 thermal couples was installed as well. The installation of the soil CO2 profile system will be completed when the cables are available.
- Reset the soil CO2 profile system at Tonzi.
- checked and downloaded data at Tower, Floor, and Vaira
- Swapped Li-7500 at TZ Tower and Vaira.
- Calibrated Li-800 in the field.
- Read dendrometers
- Measured soil moisture
- Measure groundwater well:
| Date | DOY | Location | Depth without the black thing (feet) |
| 2/16/2012 | 47 | Floor | 29.5 |
| Tower | 34.7 | ||
| roadside | 38.3 |
- Fence and gate power:12v.
- Panel and Batteries: - v; - amps; - amps.
- Reading from Gillsonic screen before downloading data. (The value of H2O and CO2 should be in the range of 0 — 5 v.)

- downloading data
- Check the fans of air temp. and relative humidity sensors
at Vaira. YES!  Check
Check
MD-9 system connections YES! CG_out=-INF.
Joe found a glitch on the wire and reconnect the wires after cutting the
potentially broken part, but seems no help. Need a close look next time.
- Check CR23X with two multiplexers
- Check levels of Radiation sensors, clear up surfaces.YES!
- Check rain gage, make sure not clogged. YES!
- Closed gate and set up fence. YES!
- A new set of solar panel was install at Vaira, and the
enclosure including 9 transmitters, 9 Vaisala CO2 probes, and 9 thermal
couples was installed as well. The installation of the soil CO2 profile
system will be completed when the cables are available.
Tonzi_Tower Site
- Fence and gate power: 12 v.
- Panel and Batteries: - v;
- amps; - amps. - Reading from Gillsonic screen before downloading data.
(The value of H2O and CO2 should be in the range of
0 — 5 v.)

- downloading data YES!
- check the fans of air temp. and relative humidity sensors
on the tower and the floor. YES! - Check rain gage, make sure not clogged. YES!
- Check calibration cylinders;
CO2 1800 psig; flow 5 psi; 421.63 ppm.
N2 2100 psig; flow 20 psi.
Manually calibrate Li-800. Following Ted’s
instruction: H:IoneSavanna_2004Tower_2004CO2ProfileLI800_Calibration_Procedure_2Nov04.txt
Is the pump running‌ YES!

Befor zero

After zero

Before SPAN

After SPAN

- close gate and set up fence. YES!
Toniz_Floor Site
- Fence and gate power: 12
v. - Panel and Batteries: - v;
- amps; - amps. (about 7:00 am local time) - Reading from Gillsonic screen before downloading data.
(The value of H2O and CO2 should be in the range of
0 — 5 v.)

- downloading data YES!
- Check MD-9 system connections YES!
CR23X3 — floor-Met
CR23X5 — soil CO2
profile
CR23X6 — tower-Met
CR10X2 — floor-Met


- Soil CO2 profile: Reset the soil CO2 profile
system at Tonzi.
(1) Removed the
sets of probe (including transmitter, cable, and thermal couple) at 16 cm of
Open and Tree sites. These two sets will be used for the third location at
Tonzi (maybe around Liukang’s tree‌ )
(2) Reinstalled the
probes for current Open and Tree sites. Because each probe had one specific
resister during the lab calibration, those resisters also installed
specifically into its transmitter. The probes were relocated to the west side
near each enclosure.
(3) No water-proof
materials were used around the probes anymore. Probes were protected in 20-cm
long PVC pipes. To prevent condensation in the pipe due to temperature
fluctuation, Joe designed to wrap each pipe with insulation foam tube. The pipes
were sealed by silicone glue.
(4) Vaisala CO2
probes installed at Tonz so far:
| Location | SN# | Range | Calibration: Linear functionPpm=intercept+slope*output | Installation in the field | |
| Intercept | Slope | ||||
| Tree site | |||||
| 2cm | sn Z2720013 | 0…1% | 26.83 | 0.20628 | Done |
| 4cm | sn X5050014 | 0…1% | 28.51 | 0.20312 | Done |
| 8cm | sn Z2720011 | 0…1% | 37.9 | 0.22378 | Done |
| Open site | |||||
| 2cm | sn Z2720012 | 0…1% | 18.07 | 0.20953 | Done |
| 4cm | sn X4840007 | 0…1% | 742.18 | 0.25517 | Done |
| 8cm | sn Z2720014 | 0…1% | 38.44 | 0.2076 | Done |
| Tree-2 site | |||||
| 2cm | sn X3830001 | 0…1% | 6.49 | 0.24049 | Not working in the field |
| 4cm | sn Y2009109 | 0…1% | 20.29 | 0.21495 | Not Yet |
| 8cm | sn X1920001 | 0…1% | 3.56 | 0.19872 | Not Yet |
Pictures from Joe:
 |
 |
Field Data
No tank data
Well Depth
| Date | Location | Depth (feet) |
|---|---|---|
| 2012-02-16 | TZ_floor | 29.5 |
| 2012-02-16 | TZ_road | 38.3 |
| 2012-02-16 | TZ_tower | 34.7 |
No TZ Moisture Point data found
No VR Moisture Point data found
No TZ grass heigth found
No VR grass heigth found
Tree DBH
| Date | Tag# | Reading (mm) |
|---|---|---|
| 2012-02-16 | 1 | 17.6 |
| 2012-02-16 | 102 | 9.1 |
| 2012-02-16 | 2 | 15.1 |
| 2012-02-16 | 245 | 19.9 |
| 2012-02-16 | 3 | 14.5 |
| 2012-02-16 | 4 | 19.5 |
| 2012-02-16 | 5 | 23.6 |
| 2012-02-16 | 7 | 15 |
| 2012-02-16 | 72 | 7.1 |
| 2012-02-16 | 79 | 6.2 |
| 2012-02-16 | 8 | 6.6 |
No water potential data found
No TZ Grass Biomass data found
No TZ OakLeaves Biomass data found
No TZ PineNeedles Biomass data found
5 photos found
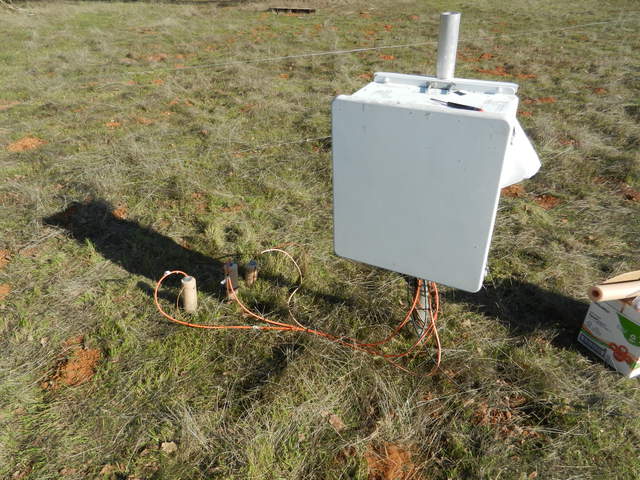
20120216TZ_OpenSoilCO2.jpg ( 2012-02-16 16:01:41 ) Full size: 4000x3000
New soil co2 sensors and data logger box
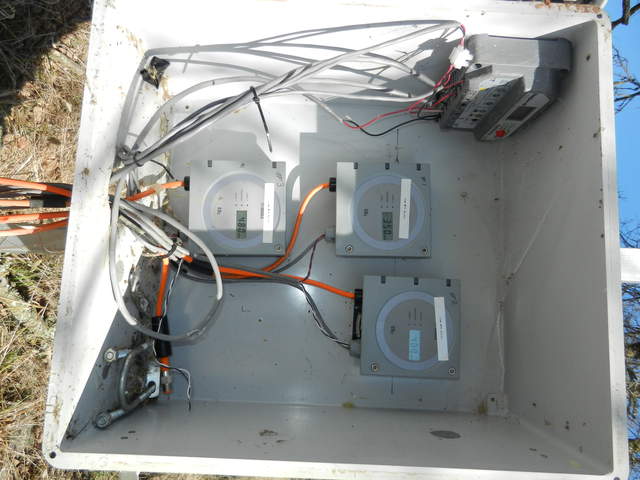
20120216TZ_Tree1CO2Box.jpg ( 2012-02-16 14:37:09 ) Full size: 4000x3000
Wiring inside soil CO2 data logger box
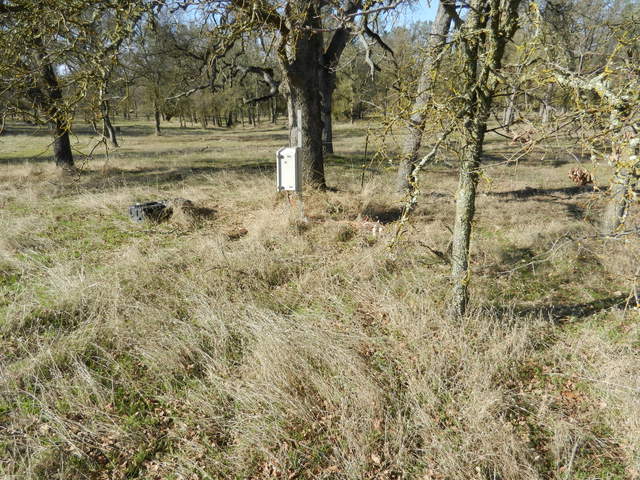
20120216TZ_Tree1SoilCO2.jpg ( 2012-02-16 16:02:22 ) Full size: 4000x3000
New soil co2 sensors and data logger box - under tree
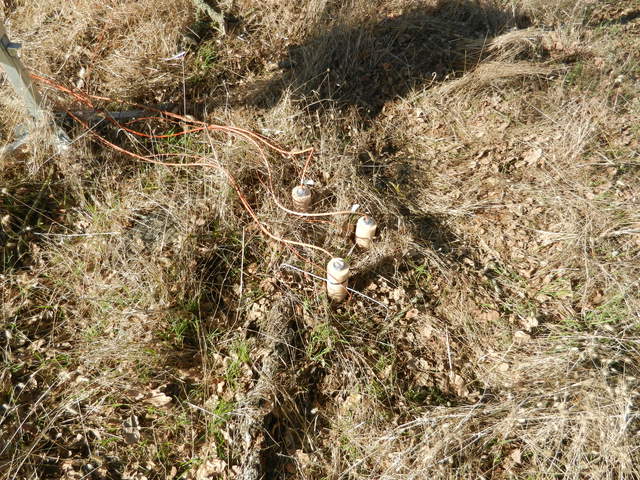
20120216TZ_Tree1SoilCO2Probes.jpg ( 2012-02-16 16:02:43 ) Full size: 4000x3000
Soil CO2 sensors under the tree in dead grass
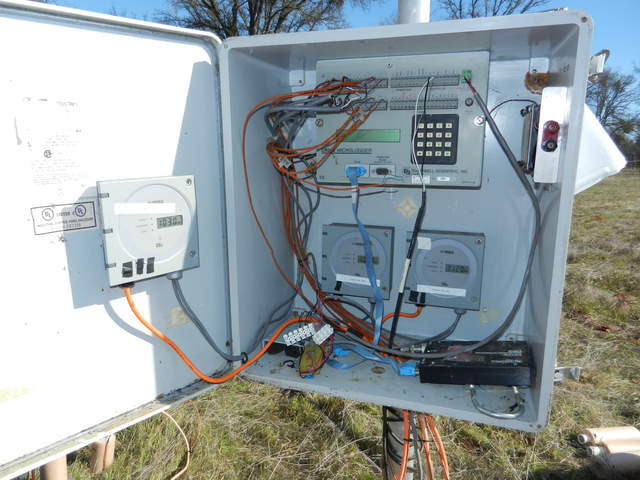
20120216TZ_OpenCO2Box.jpg ( 2012-02-16 14:58:05 ) Full size: 4000x3000
CR23x and wiring of soil CO2 sensors
16 sets found
No data found for TZ_Fenergy.
11 TZ_tmet graphs found
11 TZ_soilco2 graphs found
Can't check TZ_mixed
3 TZ_mixed graphs found
1 TZ_fflux graphs found
8 TZ_fmet graphs found
1 TZ_tram graphs found
3 TZ_co2prof graphs found
No data found for TZ_irt.
No data found for TZ_windprof.
1 TZ_tflux graphs found
2 TZ_sm graphs found
Can't check TZ_met
1 TZ_met graphs found
Can't check TZVR_mixed
8 TZ_osu graphs found
No data found for TZ_fd.
Tonzi Z-cam data

