
Field Notes
<--2009-05-13 09:00:00 | 2009-06-09 04:40:00-->Other sites visited today: Twitchell Rice | Sherman Island
Phenocam link: Searching...
Tonzi: 2009-05-27 04:45:00 (DOY 147)
Author: Siyan Ma
Others:
|
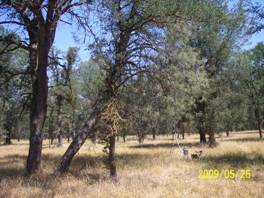
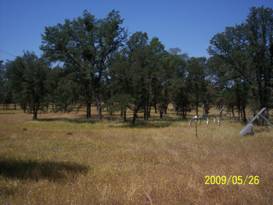
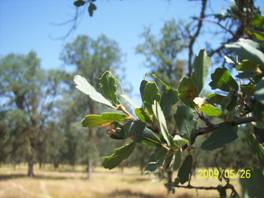
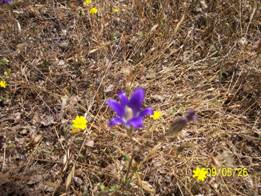
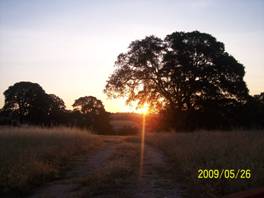
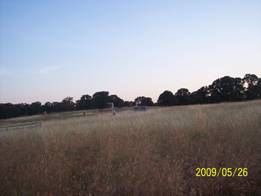
When: Date: 5/27/2009 , Day: 147 , Watch Time: 4:45am . Where: Tonzi/Vaira Ranch Who: Siyan Weather: clear, hot Phenology: similar to the view of last visiting, grass leaves turned yellow, HYGL yellow flower everywhere. The date for grass die-out is May 20, 2009 (Day 140)
Summary
Vaira_Grass Site
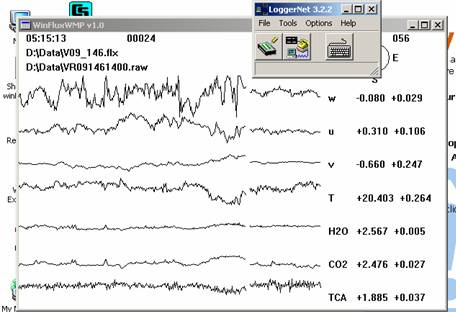
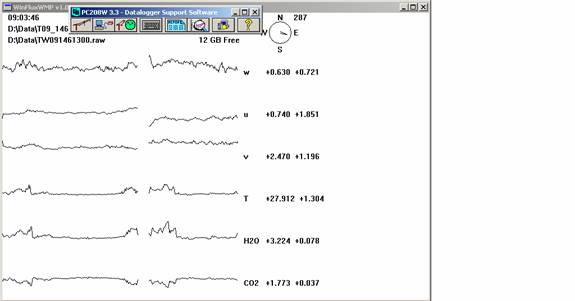
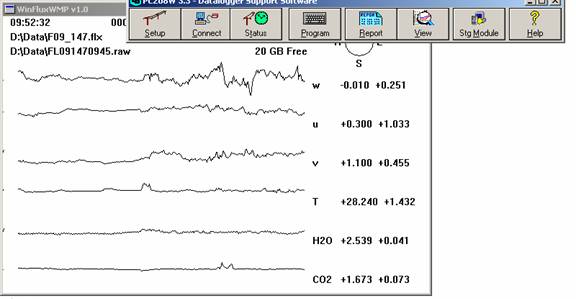
Tonzi_Tower Site
CO2 1250 psig; flow 20 psi; 431.25 ppm. N2 800 psig; flow 20 psi. Manually calibrate Li-800. Following Ted’s instruction: H:\IoneSavanna_2004\Tower_2004\CO2Profile\LI800_Calibration_Procedure_2Nov04.txt 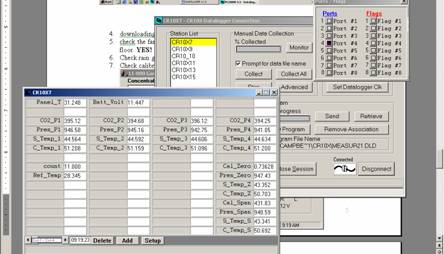
before zero 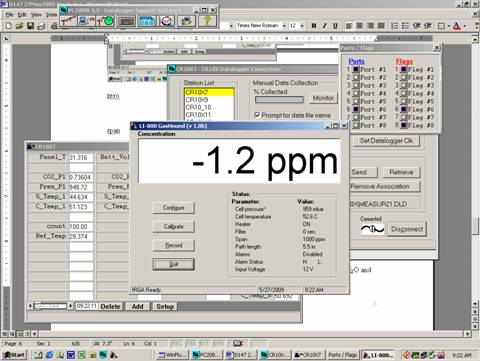
after zero 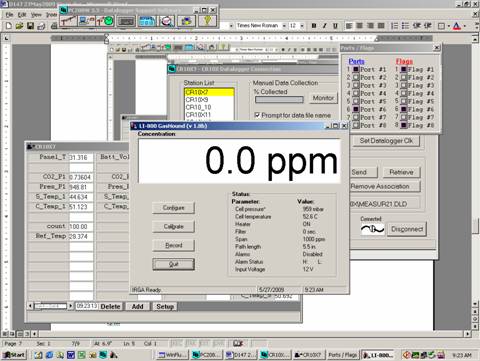
before span 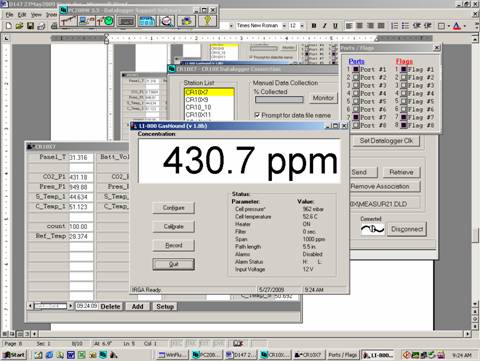
after span 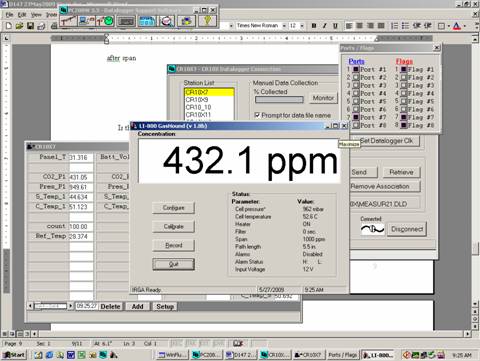
Is the pump running YES!
Toniz_Floor Site
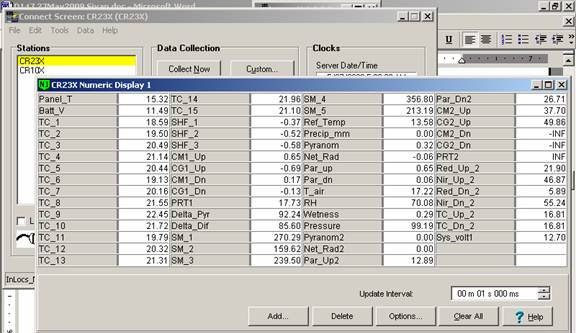
CR23X3 – floor-Met 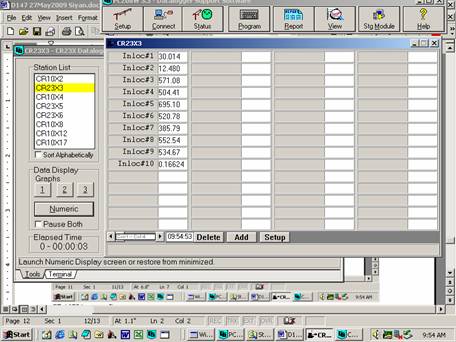
CR23X5 – soil CO2 profile 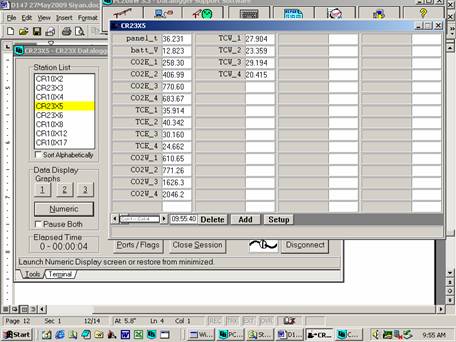
CR23X6 – tower-Met 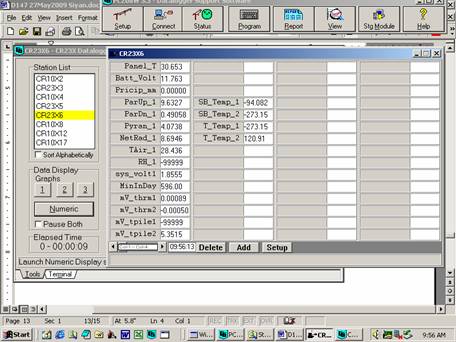
CR10X2 – floor-Met V 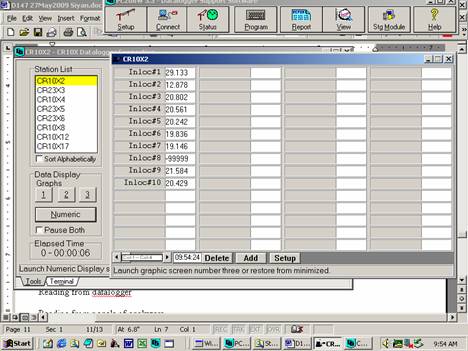
Reading from datalogger Reading from panels of analyzers
Notes: “X” means not working any more. Dendrometers installed by Gretchen group 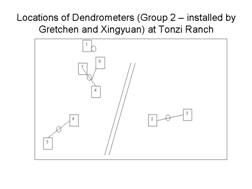
| ||||||||||||||||||||||||||||||||||||||||||||||||||||||||||||||||||||||||||||||||||||||||||||||||||||||||||||||||||||||||||||||||||||||||||||||||||||||||||||||||||||||||||||||||||||||||||||||||||||||||||||||||||||||||||||||||||||||||||||||||||||||||||||||||||||||||||||||||||||||||||||||||||||||||||||||||||||||||||||||||||||||||||||||||||||||||||||||||||||||||||||||||||||||||
Field Data
No tank data
Well Depth
| Date | Location | Depth (feet) |
|---|---|---|
| 2009-05-27 | TZ_floor | 25.77 |
| 2009-05-27 | TZ_road | 34.75 |
| 2009-05-27 | TZ_tower | 29.73 |
No TZ Moisture Point data found
No VR Moisture Point data found
No TZ grass heigth found
No VR grass heigth found
No TZ Tree DBH found
Water Potential - mode: raw
| Time | Species | Tree | readings (bar) | |||||||||||
|---|---|---|---|---|---|---|---|---|---|---|---|---|---|---|
| 2009-05-27 04:16:00 | OAK | UNKNOWN | -4.2 | -4.1 | -4 | -5 | -4.4 | -4.8 | -7 | -8 | -9.5 | |||
| 2009-05-27 04:16:00 | OAK | 92 | -3.8 | -4 | -5 | |||||||||
| 2009-05-27 04:16:00 | PINE | UNKNOWN | -8 | -8 | -9 | -7.5 | -9.1 | -10 | -7 | -10 | -8 | |||
| 2009-05-27 12:02:00 | OAK | UNKNOWN | -20.5 | -20.5 | -29.5 | |||||||||
| 2009-05-27 12:02:00 | OAK | 92 | -24.5 | -24.5 | -21 | |||||||||
| 2009-05-27 12:02:00 | PINE | UNKNOWN | -18.5 | -21 | -18.5 | -19.5 | -21 | -22 | ||||||
No TZ Grass Biomass data found
No TZ OakLeaves Biomass data found
No TZ PineNeedles Biomass data found
0 photos found
16 sets found
No data found for TZ_Fenergy.
11 TZ_tmet graphs found
11 TZ_soilco2 graphs found
Can't check TZ_mixed
3 TZ_mixed graphs found
No data found for TZ_fflux.
8 TZ_fmet graphs found
1 TZ_tram graphs found
3 TZ_co2prof graphs found
No data found for TZ_irt.
No data found for TZ_windprof.
No data found for TZ_tflux.
2 TZ_sm graphs found
Can't check TZ_met
1 TZ_met graphs found
Can't check TZVR_mixed
No data found for TZ_osu.
No data found for TZ_fd.
Tonzi Z-cam data