
Field Notes
<--2009-05-27 04:45:00 | 2009-06-10 09:30:00-->Other sites visited today: Sherman Island
Phenocam link: Searching...
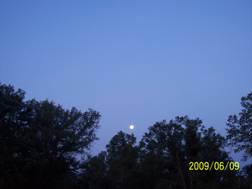
Tonzi: 2009-06-09 04:40:00 (DOY 160)
Author: Siyan Ma
Others:
|
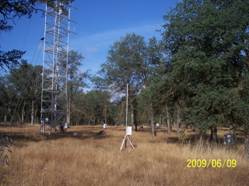
When: Date: 6/9/2009 , Day: 160 , Watch Time: 4:40am . Where: Tonzi/Vaira Ranch Who: Siyan Weather: partially cloudy, not hot, and windy on the tower. (Saw Mr. Tonzi. He said that it hadn’t been got hot as it is supposed to be, like San Francisco weather. Lightning made night like a day during a night thunderstorm last week. He looked fine. He’s going to cut a falling tree, but he didn’t want to cut too much because he’d been lost some wood consumers. He doesn’t think the President can make that much money for the economics.) Phenology: annual grasses died out, but broadleaf herbs were still green with yellow, purple followers
Summary
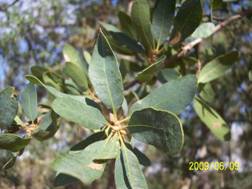
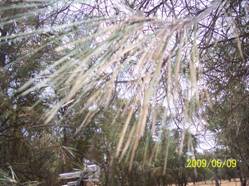
Oak leaves: ~ -7.0 bar Pine needles: ~ -10.0 bar
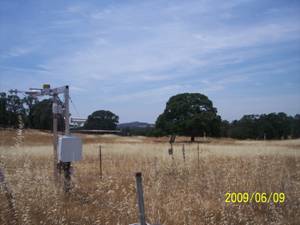
Vaira_Grass Site 1. Fence and gate power: 12 v. 2. Panel and Batteries: 13.7 v; 11.2 amps; 2.1 amps. 3. Reading from Gillsonic screen before downloading data. (The value of H2O and CO2 should be in the range of 0 – 5 v.) 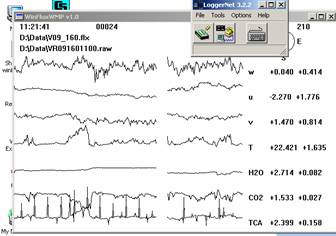
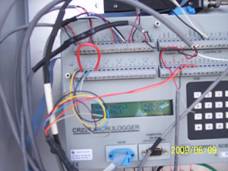
4. downloading data YES! 5. Check the fans of air temp. and relative humidity sensors at Vaira. YES! 6. Check MD-9 system connections YES! 7. Check CR23X with two multiplexers Sys_vot = 13.85 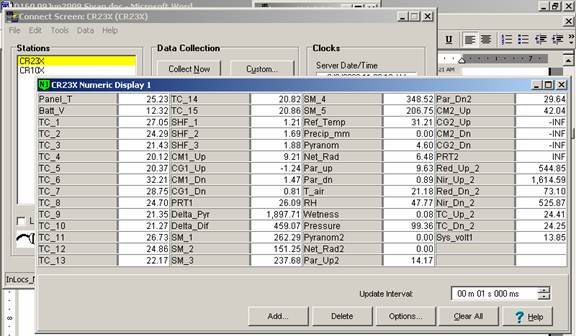
8. Check levels of Radiation sensors, clear up surfaces. YES! 9. Check rain gage, make sure not clogged. YES! 10. Closed gate and set up fence. YES! Tonzi_Tower Site
CO2 1100 psig; flow 20 psi; 431.25 ppm. N2 750 psig; flow 20 psi. Manually calibrate Li-800. Following Ted’s instruction: H:\IoneSavanna_2004\Tower_2004\CO2Profile\LI800_Calibration_Procedure_2Nov04.txt Is the pump running YES! 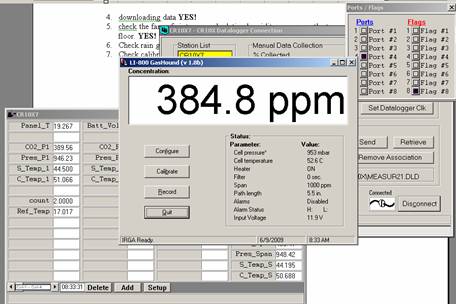
Toniz_Floor Site
CR23X3 – floor-Met 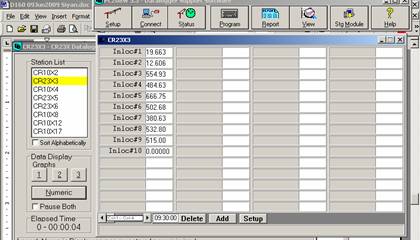
CR23X5 – soil CO2 profile 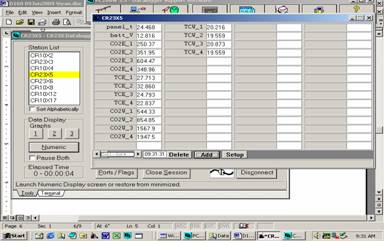
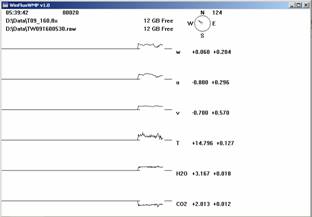
CR23X6 – tower-Met 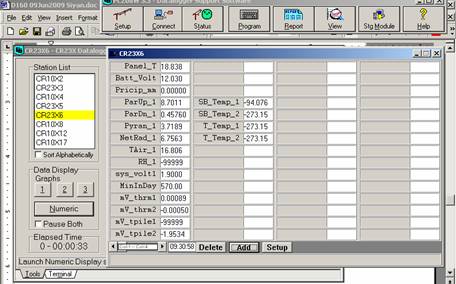
CR10X2 – floor-Met 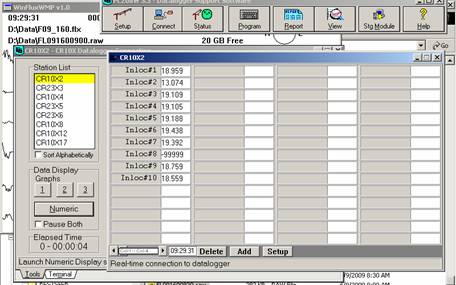
Reading from datalogger Reading from panels of analyzers
Notes: “X” means not working any more. Dendrometers installed by Gretchen group 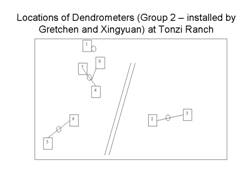
| ||||||||||||||||||||||||||||||||||||||||||||||||||||||||||||||||||||||||||||||||||||||||||||||||||||||||||||||||||||||||||||||||||||||||||||||||||||||||||||||||||||||||||||||||||||||||||||||||||||||||||||||||||||||||||||||||||||||||||||||||||||||||||||||||||||||||||||||||||||||||||||||||||||||||||||||||||||||||||||||||||||||||||||||||||||||||||||||||||||||||||||||||||||||||
Field Data
No tank data
Well Depth
| Date | Location | Depth (feet) |
|---|---|---|
| 2009-06-09 | TZ_floor | 25.91 |
| 2009-06-09 | TZ_road | 35.01 |
| 2009-06-09 | TZ_tower | 29.99 |
No TZ Moisture Point data found
No VR Moisture Point data found
No TZ grass heigth found
No VR grass heigth found
No TZ Tree DBH found
Water Potential - mode: raw
| Time | Species | Tree | readings (bar) | ||||||||
|---|---|---|---|---|---|---|---|---|---|---|---|
| 2009-06-09 04:13:00 | OAK | UNKNOWN | -7.3 | -3.5 | -6 | -8 | -6.8 | -7 | |||
| 2009-06-09 04:13:00 | OAK | 92 | -4.5 | -4.1 | -4.9 | ||||||
| 2009-06-09 04:13:00 | PINE | UNKNOWN | -9.1 | -9.5 | -10.1 | -9.5 | -9.8 | -13 | -11.2 | -10.5 | -13 |
| 2009-06-09 12:03:00 | OAK | UNKNOWN | -29 | -28.5 | -31.5 | -32.5 | -25 | ||||
| 2009-06-09 12:03:00 | PINE | UNKNOWN | -15 | -6.5 | -18.5 | -16 | -22 | -25 | |||
| 2009-06-09 12:03:00 | PINE | YNG | -3 | -2.5 | |||||||
No TZ Grass Biomass data found
No TZ OakLeaves Biomass data found
No TZ PineNeedles Biomass data found
0 photos found
16 sets found
No data found for TZ_Fenergy.
11 TZ_tmet graphs found
11 TZ_soilco2 graphs found
Can't check TZ_mixed
3 TZ_mixed graphs found
No data found for TZ_fflux.
8 TZ_fmet graphs found
1 TZ_tram graphs found
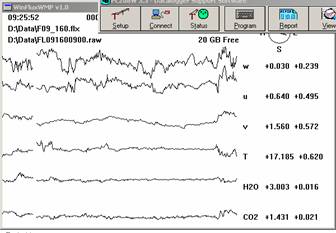
3 TZ_co2prof graphs found
No data found for TZ_irt.
No data found for TZ_windprof.
No data found for TZ_tflux.
2 TZ_sm graphs found
Can't check TZ_met
1 TZ_met graphs found
Can't check TZVR_mixed
No data found for TZ_osu.
No data found for TZ_fd.
Tonzi Z-cam data