Field Notes

<--2011-12-14 12:00:00 | 2011-12-28 10:00:00-->
Other sites visited today: Sherman Island
Phenocam link: Searching...

Mayberry: 2011-12-20 12:30:00 (DOY 354)
Author: Joe Verfaillie
Others: Dennis

Summary: Connected LED sensor to Tule Tower data logger and updated program - still has problems, pulled water pressure for testing.

Mayberry
2011-12-20

I arrived with Dennis about 12:30PST. It was cold and foggy with little to no wind. The foggy lifted while we were at the site and it became sunny. The cattails are continuing to yellow.

I connected the LED sensor to the Tule Tower AM16/32 and updated the CR10X program after downloading the data. This fixed the problem of the LED input locations not being displayed, but the values from the LED sensor looked bad and the conductivity value still seemed bad. I?ll have to test the program in the lab.

Dennis added some water to the LI7700 reservoir. The 7700 RSSI was 56 so I did not clean the mirrors.

We pulled the water pressure sensor and it was reading -0.31 in atmosphere. The well was full of sediment. After testing in the lab, I think I will install the water pressure at the Tule Tower.

We left a bottle of DI water at the site.

5 photos found

Nice light at dusk
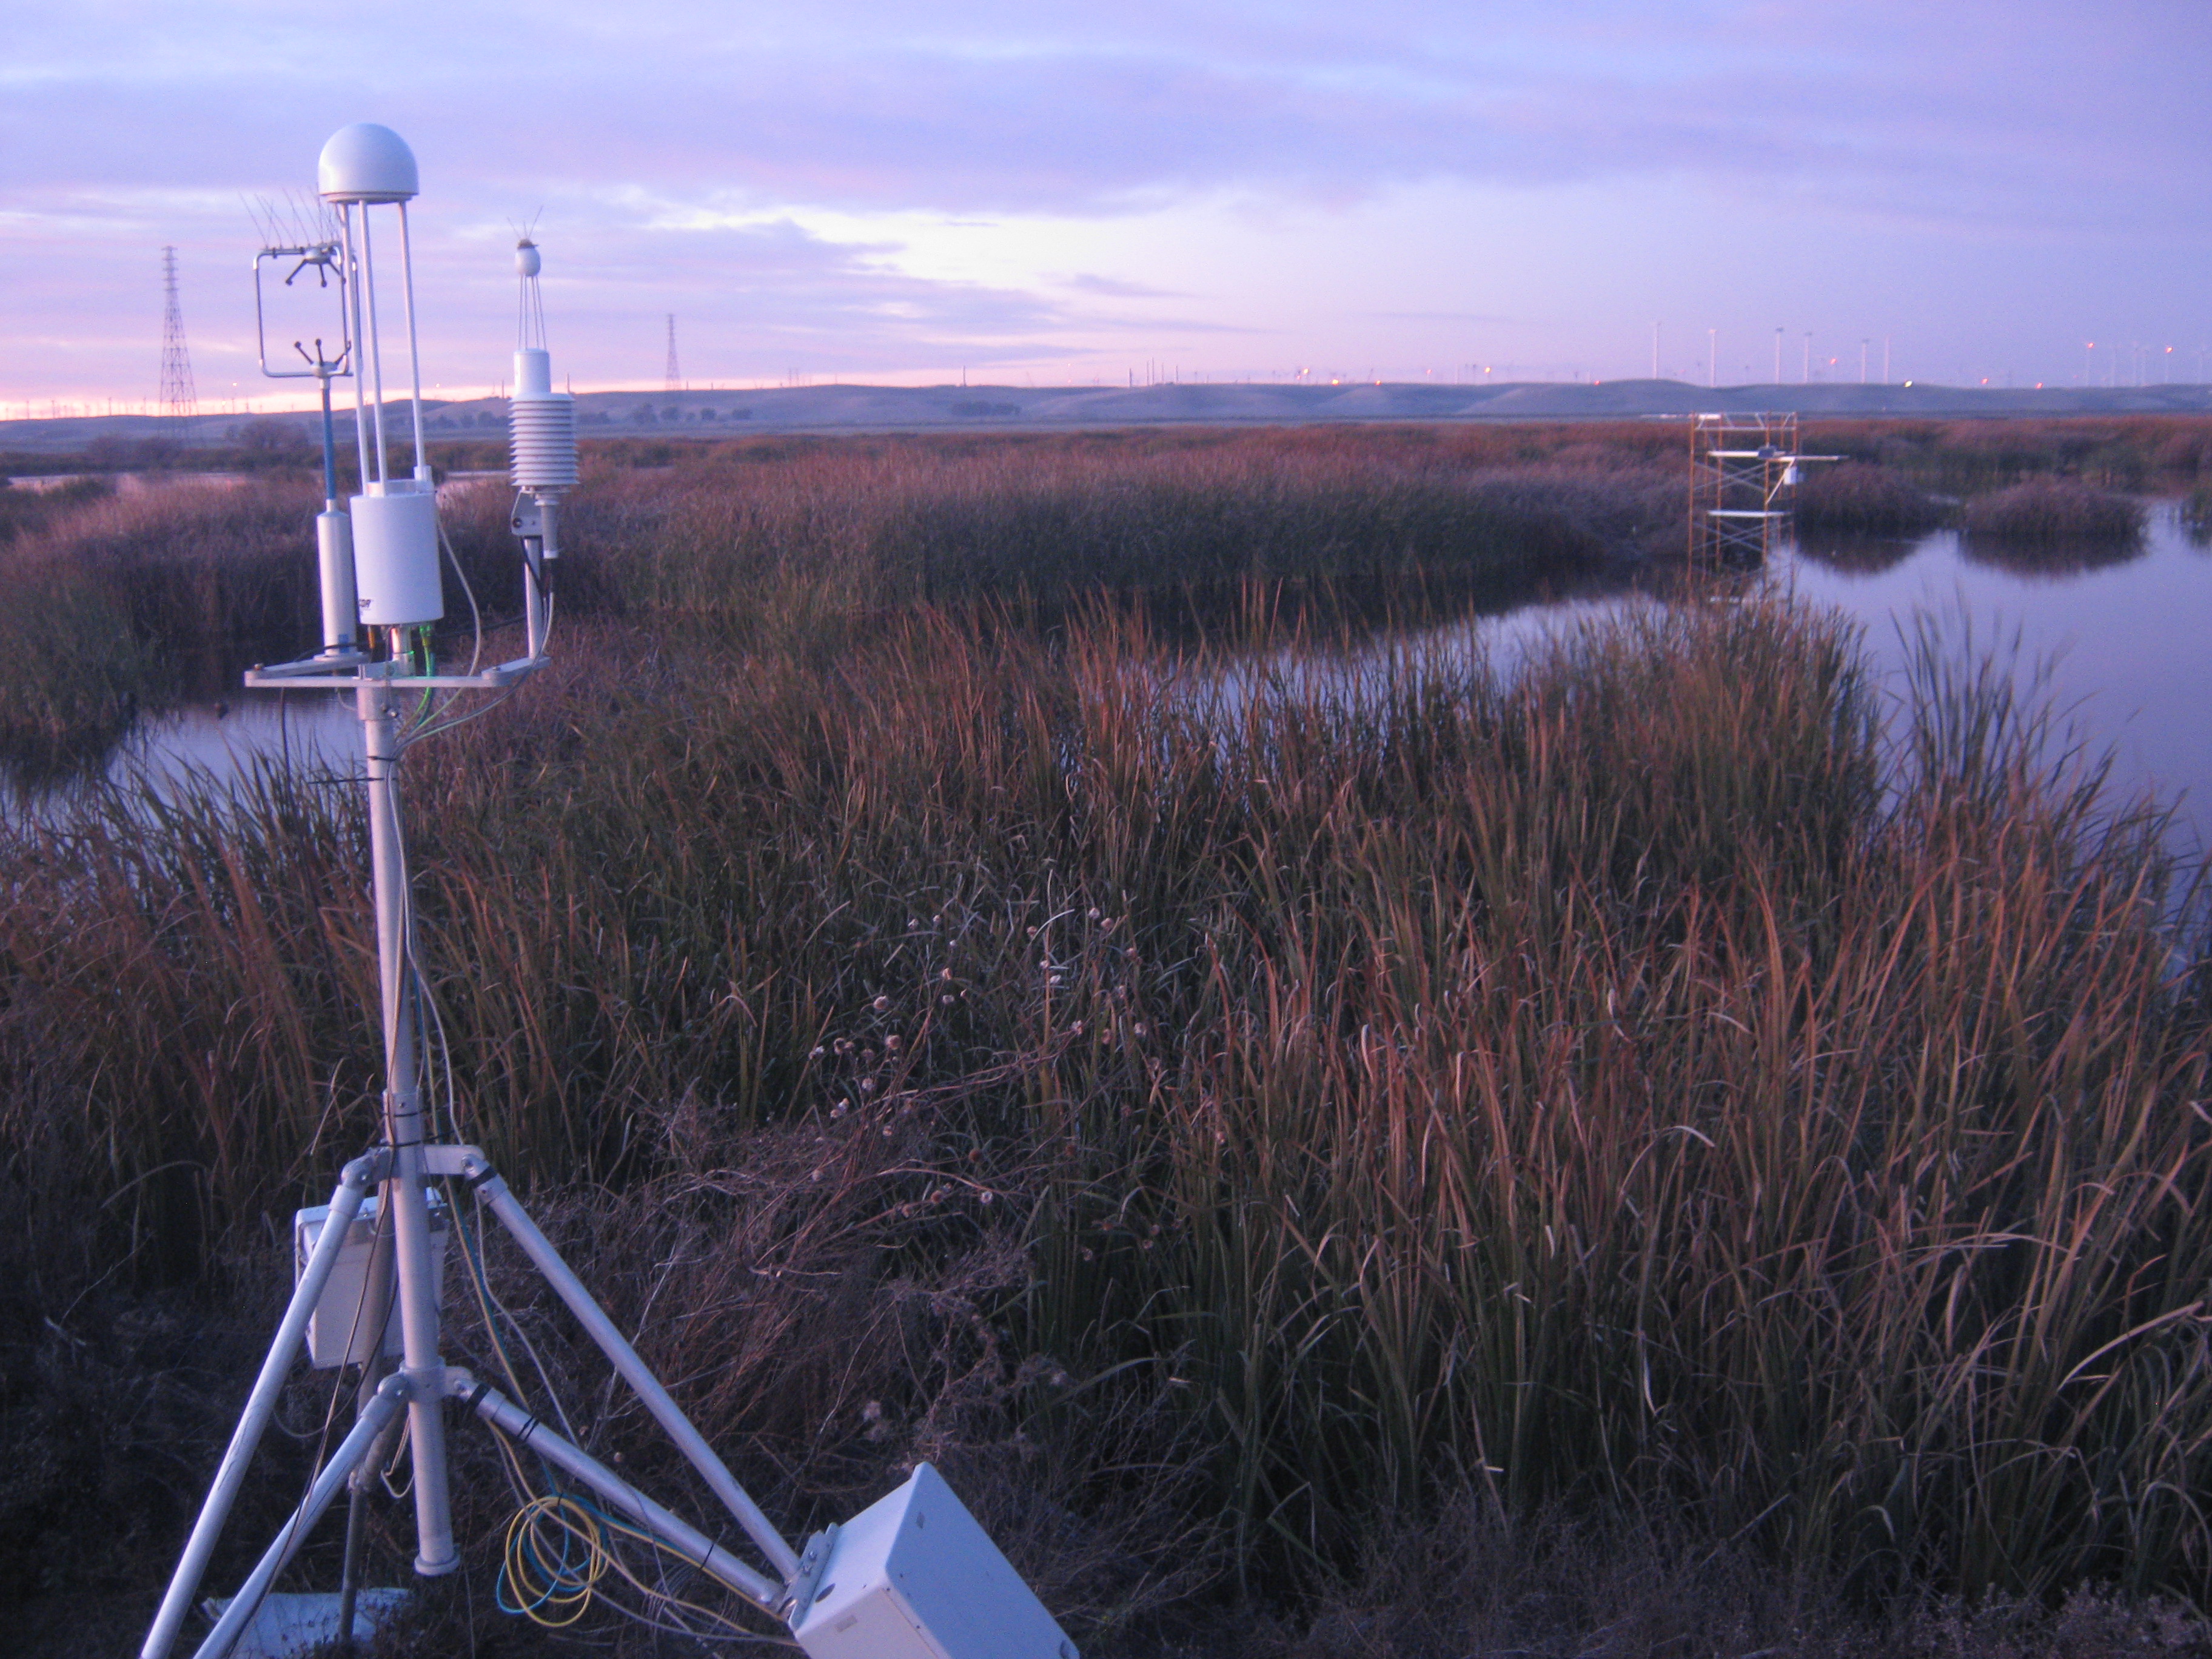
MB_autocam_20111219_1815.jpg ( 2011-12-19 18:15:04 ) Full size: 3648x2736
Nice light at dusk

Heavy fog
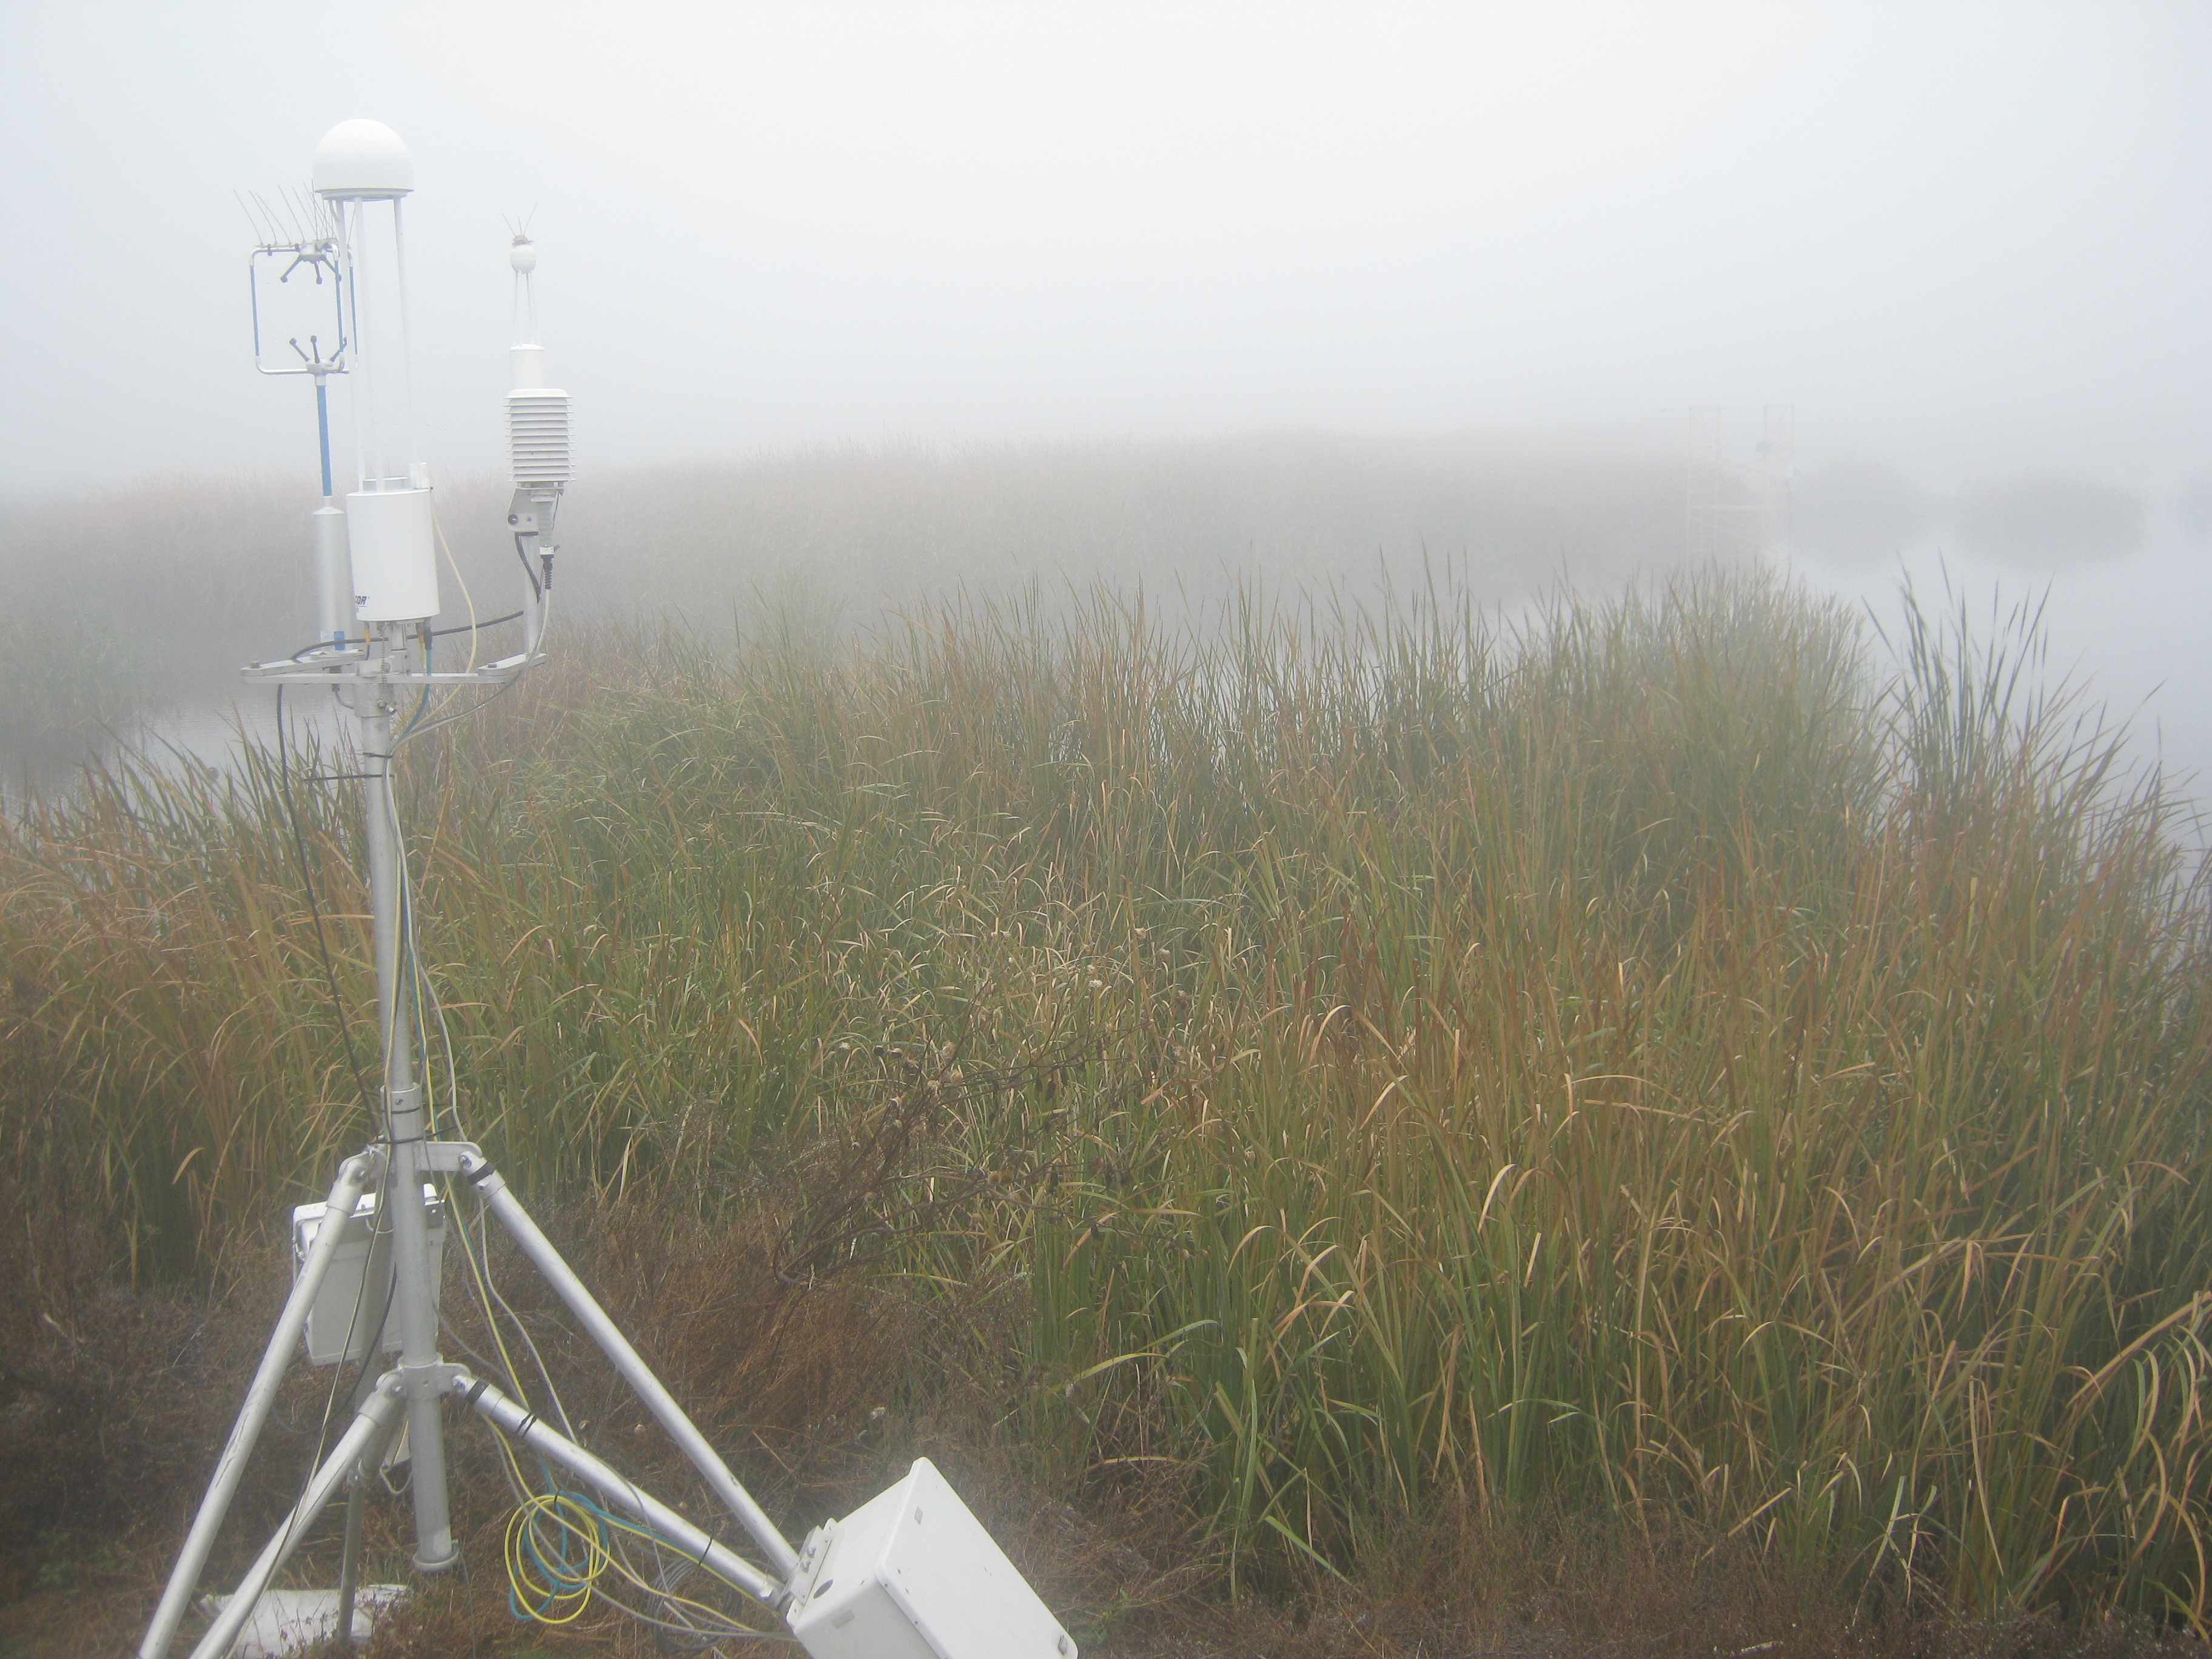
MB_autocam_20111220_1145.jpg ( 2011-12-20 11:45:02 ) Full size: 3648x2736
Heavy fog

Dennis and Joe on site
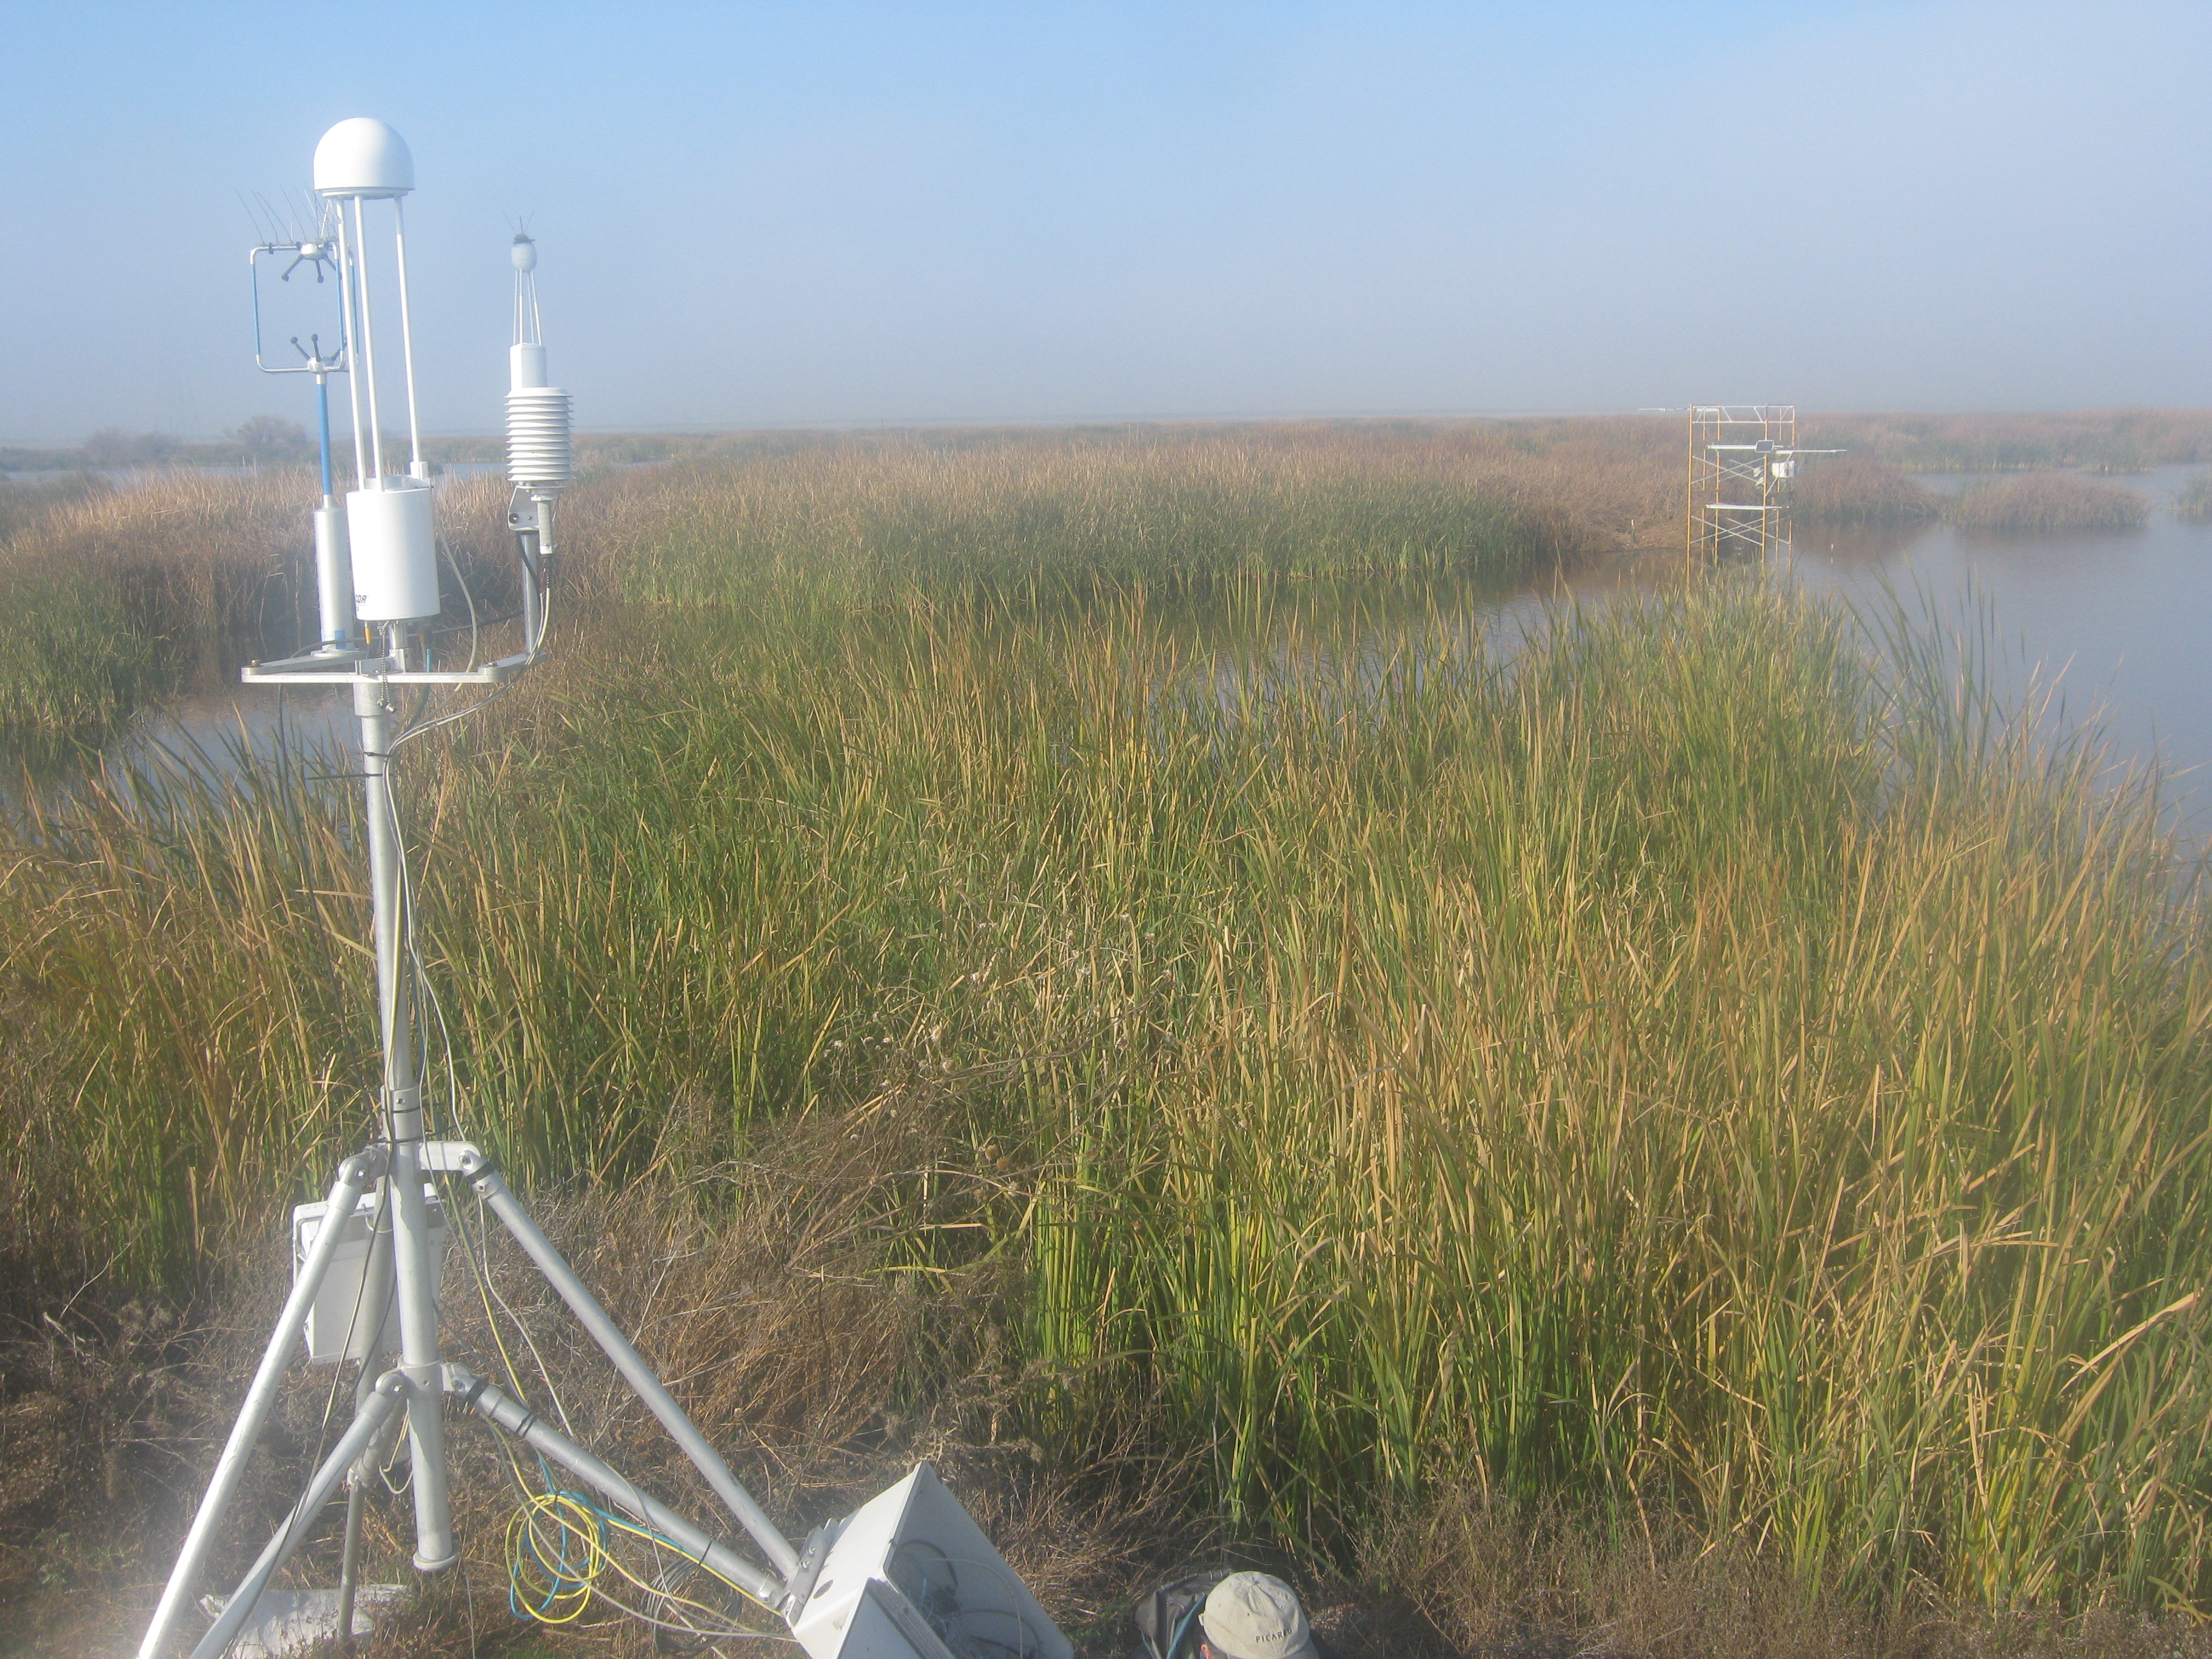
MB_autocam_20111220_1415.jpg ( 2011-12-20 14:15:02 ) Full size: 3648x2736
Dennis and Joe on site

Joe on site
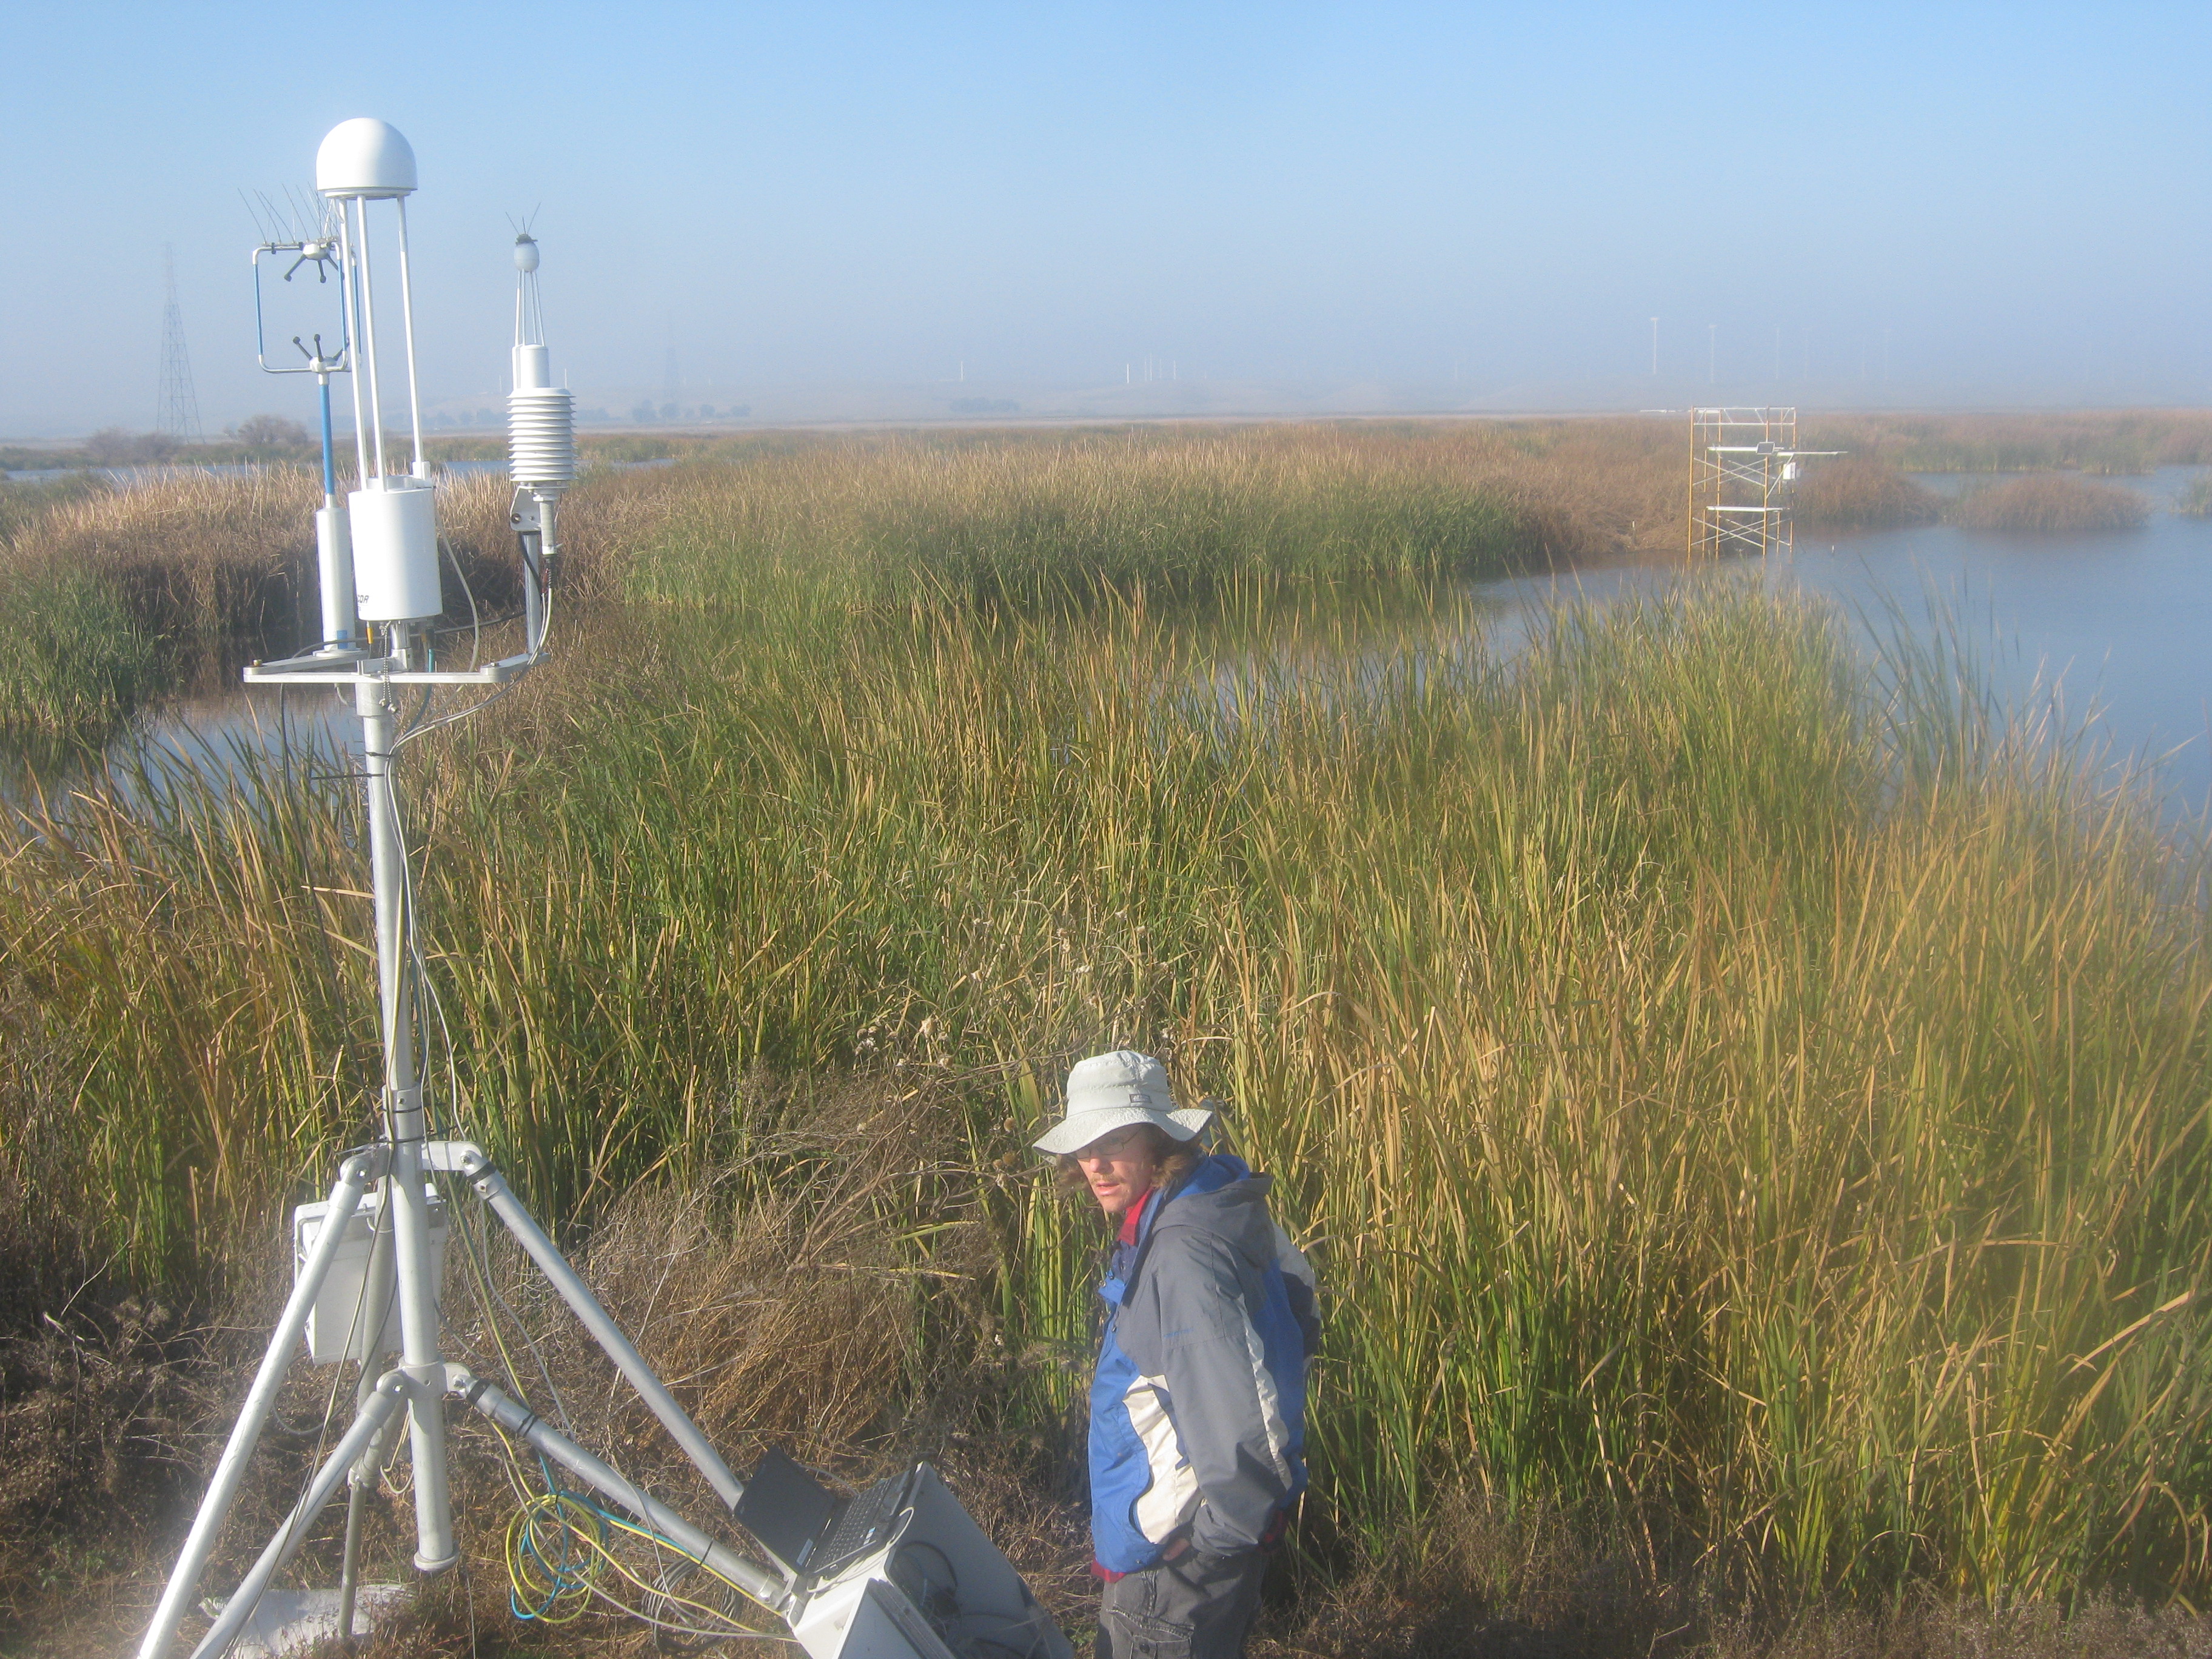
MB_autocam_20111220_1445.jpg ( 2011-12-20 14:45:02 ) Full size: 3648x2736
Joe on site

Hawk on camera
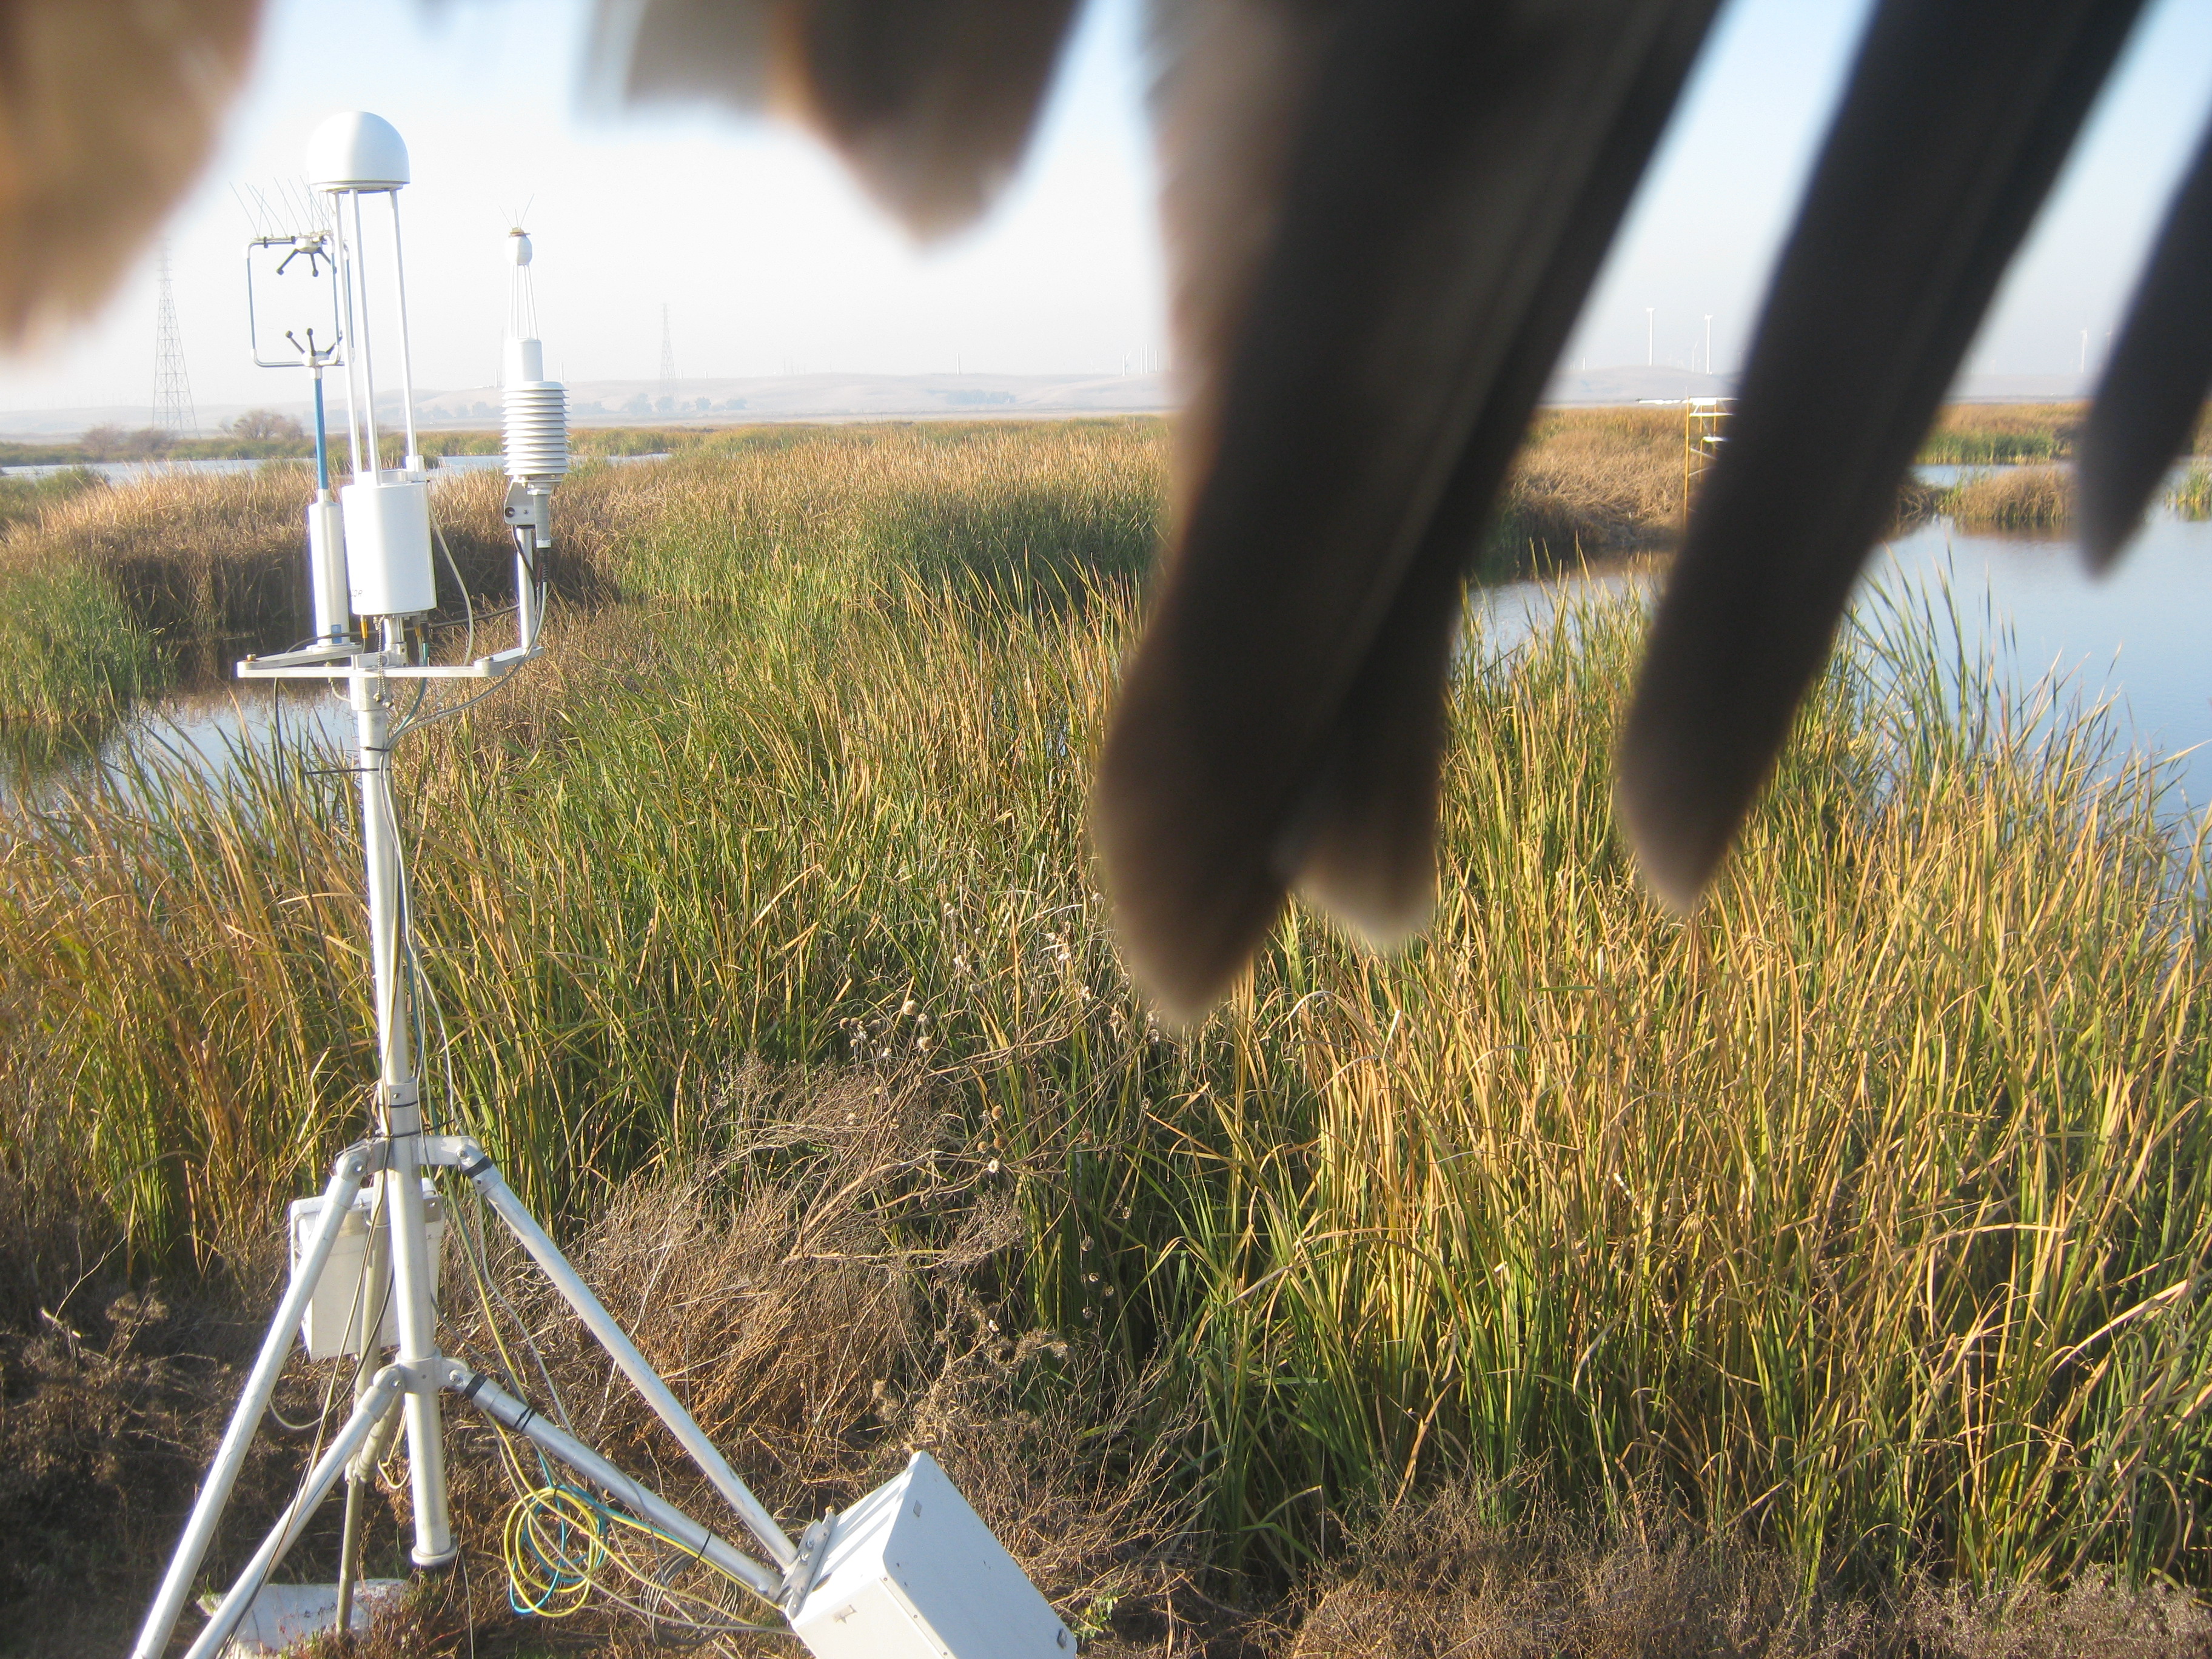
MB_autocam_20111220_1615.jpg ( 2011-12-20 16:15:02 ) Full size: 3648x2736
Hawk on camera

Graphs display:
11 sets found

7 MB_flux graphs found

Explore the graph:Sonic Wind in a new window

Explore the graph:LI7700 mV signals in a new window

Explore the graph:Counts in a new window

Explore the graph:LI7700 CH4 from analog signal in a new window

Explore the graph:LI7500 CO2 and H2O in a new window

Explore the graph:LI7700 CH4 from digital signal in a new window

Explore the graph:CO2 in ppm in a new window

5 MB_met graphs found

Explore the graph:MB_met Battery Volts & Panel T in a new window

Explore the graph:Mayberry Soil T in a new window

Explore the graph:Mayberry Water Temperature in a new window

Explore the graph:Mayberry Dissolved Oxygen in a new window

Explore the graph:Mayberry Water Depth in a new window

28 MB_tule graphs found

Explore the graph:MB Tule Tower: Open Water 2 (3/1/11-3/23/17) in a new window

Explore the graph:MB Tule Tower: Open Water 1 (3/1/11-2/21/13) in a new window

Explore the graph:MB Tule Tower: Tule Temps 2 & 3 (3/1/11-3/19/14) in a new window

Explore the graph:MB Tule Tower: Tule Temps 1 (3/1/11-3/19/14) in a new window

Explore the graph:Mayberry Tule Tower: Solar Radiation in a new window

Explore the graph:Mayberry Tule Tower: Disolved Oxygen in a new window

Explore the graph:Mayberry Tule Tower: IRT and Sensor Temp in a new window

Explore the graph:Mayberry Tule Tower: Volts and RH in a new window

Explore the graph:LED NDVI Sensor in a new window

Explore the graph:Water CO2 in a new window

Explore the graph:Water Pressure in a new window

Explore the graph:Fluorometer Data in a new window

Explore the graph:Mayberry pCO2 Profile in a new window

Explore the graph:Water Temperatures in a new window

Explore the graph:Air Temperatures in a new window

Explore the graph:Air Pressure in a new window

Explore the graph:4-Way Radiometer in a new window

Explore the graph:MB Tule Tower: Open Water 1 (2/21/13-3/19/14) in a new window

Explore the graph:MB Tule Tower: Tule Temps 1 (3/19/14-now) in a new window

Explore the graph:MB Tule Tower: Open Water 1 (3/19/14-now) in a new window

Explore the graph:MB Tule Tower: Tule Temps 2 & 3 (3/19/14-3/23/17) in a new window

Explore the graph:MB Tule Tower: Tule Temps 2 (3/23/17-now) in a new window

Explore the graph:MB Tule Tower: Tule Temps 3 (3/23/17-now) in a new window

Explore the graph:SRS NDVI Channels in a new window

Explore the graph:SRS NDVI in a new window

Explore the graph:Net Radiation in a new window

Explore the graph:Conductivity in a new window

Explore the graph:Soil electrical conductivity in a new window

Can't check MBWPEESWGT_mixed
1 MB_cam graphs found

Explore the graph:Mayberry Autocam GCC in a new window

Can't check MBEEWPSWEPGT_cam
Can't check SIMBTWEE_met
No data found for MB_minidot.
Can't check MBSWEEWPBCBA
1 MB_processed graphs found

Explore the graph:Mayberry processed CO2 Fluxes in a new window

Can't check MB_fd
1 MB_fd graphs found

Explore the graph:Water Forced Diffusion CO2 Flux in a new window