Field Notes

<--2011-10-26 09:30:00 | 2011-11-09 09:20:00-->
Other sites visited today: Twitchell Rice | Vaira
Phenocam link: Searching...

Tonzi: 2011-11-02 10:00:00 (DOY 306)
Author: Joe Verfaillie
Others: Siyan

Summary: Checked refocused Stardot camera, fixed labels in Loggernet on floor computer, replaced flowmeter in co2 profile system, did EMI survey, cleaned z-cam windows, tree circumfrence.

Tonzi
2011-11-02

I arrived about 10:00PST with Siyan. It was clear and warm with little to no wind. The trees here have begun to loose there leaves. Many have obviously changed color. There are lots of acorns on trees and on the ground. The grass looks better here especially in the low spots. Many broad leaf herbs have sprouted.

I check on the stardot camera. Closing down the aperture improved the depth of focus so that most of the image is now in focus. The exposure is about 200.

I fixed the labels in Loggernet on the floor tower.

I did an EMI survey

I cleaned the windows on the z-cams.

I replaced the flow meter in the CO2 profile system with a new, clean one.

Siyan measure breast height circumference of tree with dendrometer rings.

Field Data

No tank data

No TZ Well data found

No TZ Moisture Point data found

No VR Moisture Point data found

No TZ grass heigth found

No VR grass heigth found

No TZ Tree DBH found

No water potential data found

No TZ Grass Biomass data found

No TZ OakLeaves Biomass data found

No TZ PineNeedles Biomass data found

3 photos found
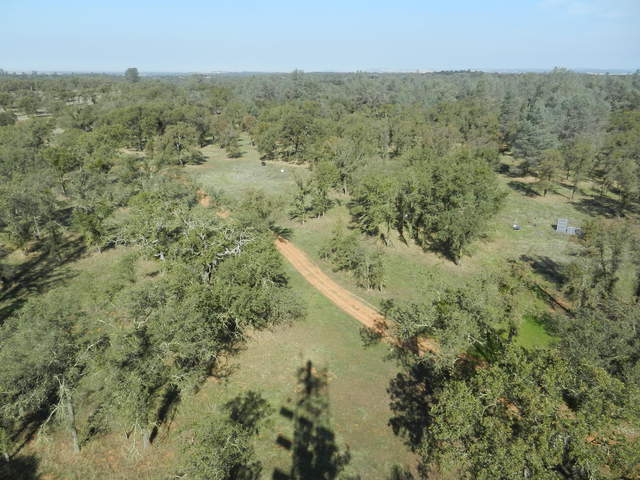
View of floor from tower.
20111102TZ_FromTower.jpg ( 2011-11-02 11:27:19 ) Full size: 2048x1536
View of floor from tower.
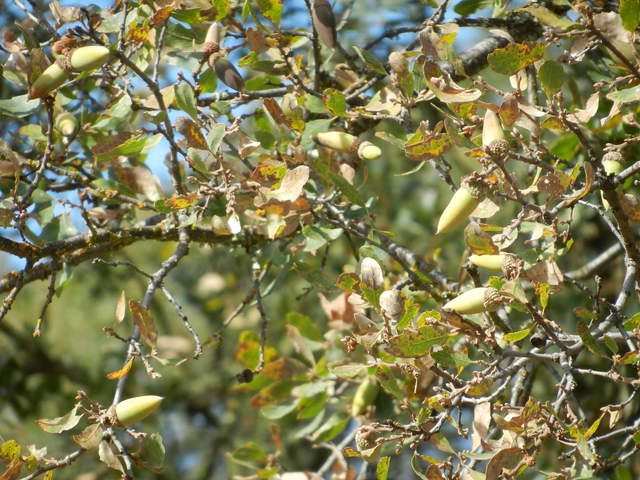
Acorns and dying leaves on Luikang
20111102TZ_LeaveAcorns.jpg ( 2011-11-02 12:41:57 ) Full size: 2048x1536
Acorns and dying leaves on Luikang's tree.
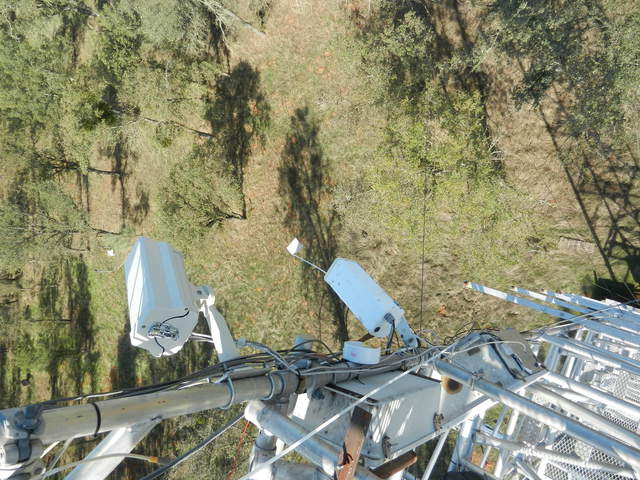
New Stardot camera mounted above existing camera.
20111102TZ_NewCamera.jpg ( 2011-11-02 11:27:36 ) Full size: 2048x1536
New Stardot camera mounted above existing camera.

Graphs display:
16 sets found

No data found for TZ_Fenergy.
11 TZ_tmet graphs found

Explore the graph:Tonzi Tower Met: Temperature and Power in a new window

Explore the graph:Tonzi Tower Met: Solar Radiation in a new window

Explore the graph:Tonzi Tower Met: IRT Sensors in a new window

Explore the graph:LED Sensor Incoming in a new window

Explore the graph:LED Sensor Outgoing in a new window

Explore the graph:4-Band Solar Radiation in a new window

Explore the graph:Air Temperature Profile in a new window

Explore the graph:Relativity Humidity Profile in a new window

Explore the graph:Tonzi Tower PRI in a new window

Explore the graph:SRS PRI/NDVI in a new window

Explore the graph:SRS NDVI in a new window

11 TZ_soilco2 graphs found

Explore the graph:Tonzi Soil CO2 Profile: Open (East) CO2 in a new window

Explore the graph:Tonzi Soil CO2 Profile: Tree (West) CO2 in a new window

Explore the graph:Tonzi Soil CO2 Profile: Open (East) Temperatures in a new window

Explore the graph:Tonzi Soil CO2 Profile: Tree (West) Temperatures in a new window

Explore the graph:Tonzi Soil CO2 Profile: Upper CO2 in a new window

Explore the graph:Tonzi Soil CO2 Profile: Lower CO2 in a new window

Explore the graph:Tonzi Soil CO2 Profile: Upper Temperatures in a new window

Explore the graph:Tonzi Soil CO2 Profile: Lower Temperatures in a new window

Explore the graph:Tonzi Soil CO2 Profile: Power and Temperature in a new window

Explore the graph:Tree 2 Soil CO2 in a new window

Explore the graph:Tree 2 Soil Temperature in a new window

Can't check TZ_mixed
3 TZ_mixed graphs found

Explore the graph:Tonzi PPT in a new window

Explore the graph:Tonzi CO2 and H2O Densities in a new window

Explore the graph:Air Pressure in a new window

1 TZ_fflux graphs found

Explore the graph:Tonzi Wind Speed in a new window

8 TZ_fmet graphs found

Explore the graph:Soil Heat Flux in a new window

Explore the graph:Tonzi Soil Temperature Set A in a new window

Explore the graph:Tonzi Soil Temperatures Set B in a new window

Explore the graph:Tonzi Soil Temperatures Set C in a new window

Explore the graph:Tonzi Soil Temperature Set D in a new window

Explore the graph:Well Level in a new window

Explore the graph:Well Water Temperature in a new window

Explore the graph:Soil Water Potential in a new window

1 TZ_tram graphs found

Explore the graph:Tonzi Tram Incoming PAR in a new window

3 TZ_co2prof graphs found

Explore the graph:Tower CO2 Profile Concentrations in a new window

Explore the graph:Tower CO2 Profile Cell Pressure in a new window

Explore the graph:CO2 Profile Sensor Temperature in a new window

No data found for TZ_irt.
No data found for TZ_windprof.
1 TZ_tflux graphs found

Explore the graph:Tower CO2 and H2O in a new window

2 TZ_sm graphs found

Explore the graph:Floor Solar Radiations in a new window

Explore the graph:TZ Soil Moisture in a new window

Can't check TZ_met
1 TZ_met graphs found

Explore the graph:Floor and Tower RH in a new window

Can't check TZVR_mixed
No data found for TZ_osu.
No data found for TZ_fd.
Tonzi Z-cam data

plot of Tonzi z-cam LAI

plot of Tonzi z-cam gap fration