Field Notes
<--2011-10-26 09:00:00 | 2011-11-02 10:00:00-->Other sites visited today: Tonzi | Vaira
Phenocam link: Searching...
Tonzi: 2011-10-26 09:30:00 (DOY 299)
Author: Joe Verfaillie
Others: Siyan
Summary: Swapped CO2 profile IRGA, possibly sticky solinoid, sticky flow meter, fixed focus and network for stardot camera, serviced z-cams.
| Tonzi
2011-10-26 I arrived about 9:30PST with Siyan. It was clear, sunny and warm with a little wind. Sitting at the top of the tower I could feel it sway a little in some of the stronger gusts. The grass is still green and the ground looks wet in low areas. The trees still look good. I swapped the LI820 out of the CO2 profile system and swapped in the LI800. I calibrated the LI800. The ball in the flow meter seemed stuck. I disconnected the up steam stuff from it and the increased flow freed the ball. But when the system cycled through the D solenoid the ball fell to the bottom and got stuck again and the pump labored. I think solenoid D wasn?t opening. I had to take things apart to get D out and then it seemed to start working. I put things back together and removed the flow meter so if D stops working again, at least the flow meter won?t get stuck and ruin the other levels. I checked the focus on the Stardot camera. I was able to get the middle of the image in focus but the nearest and farthest parts were a little out of focus. I think this can be improved by adjusting the aperture which is wide open right now. The CO2 profile cal tanks read N2 1200psi, CO2 500psi The Ethernet cable for the Stardot camera was not seated in the back of the computer tightly and no images had been transferred since I left last time. I fixed this (I think). Then I changed the program on the 23x to not turn on the camera if the 23x voltage was low. I serviced the z-cam. They all seemed well. Walked around looking at trees. |
Field Data
No tank data
Well Depth
| Date | Location | Depth (feet) |
|---|---|---|
| 2011-10-26 | TZ_floor | 26.2 |
| 2011-10-26 | TZ_road | 36.8 |
| 2011-10-26 | TZ_tower | 31.3 |
No TZ Moisture Point data found
No VR Moisture Point data found
No TZ grass heigth found
No VR grass heigth found
No TZ Tree DBH found
Water Potential - mode: raw
| Time | Species | Tree | readings (bar) | |||||
|---|---|---|---|---|---|---|---|---|
| 2011-10-26 11:49:00 | OAK | UNKNOWN | -30.5 | -29 | -28 | -23 | -21.5 | -29 |
| 2011-10-26 11:49:00 | PINE | OLD | -20 | -13 | -12.5 | |||
| 2011-10-26 11:49:00 | PINE | YNG | -5.5 | -1.5 | -1.5 | |||
No TZ Grass Biomass data found
No TZ OakLeaves Biomass data found
No TZ PineNeedles Biomass data found
1 photos found

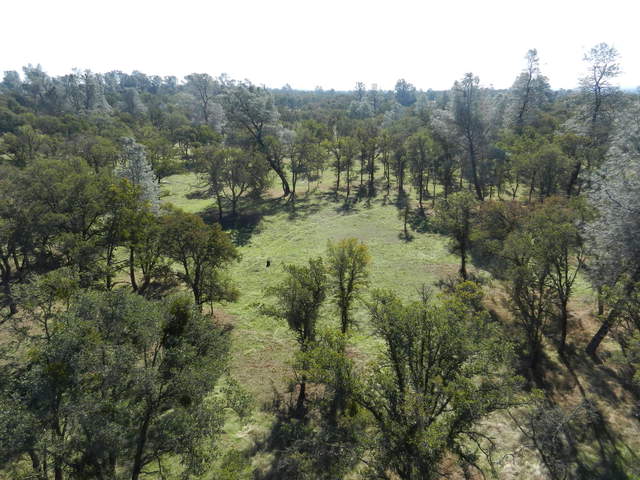
20111026TZ_FromTower.jpg ( 2011-10-26 11:42:28 ) Full size: 2048x1536
Blue oak, grey pine and green grass
16 sets found
No data found for TZ_Fenergy.
11 TZ_tmet graphs found
11 TZ_soilco2 graphs found
Can't check TZ_mixed
3 TZ_mixed graphs found
1 TZ_fflux graphs found
8 TZ_fmet graphs found
1 TZ_tram graphs found
3 TZ_co2prof graphs found
No data found for TZ_irt.
No data found for TZ_windprof.
1 TZ_tflux graphs found
2 TZ_sm graphs found
Can't check TZ_met
1 TZ_met graphs found
Can't check TZVR_mixed
No data found for TZ_osu.
No data found for TZ_fd.
Tonzi Z-cam data

