
Field Notes
<--2011-09-02 08:30:00 | 2011-09-22 07:30:00-->Other sites visited today: Mayberry | Sherman Island
Phenocam link: Searching...
Twitchell Rice: 2011-09-15 07:00:00 (DOY 258)
Author: Joe Verfaillie
Others: Jaclyn, Sara
Summary: Tubing for LGR broke and repaired, LGR cal checked, data collected, Theta probes back in field, connected tomorrow.
| Twitchell
2011-04-15 I arrived about 7:00PST with Jaclyn and Sara. It was sunny and cool with a breeze from the west, but warming quickly. The water has been off for almost two weeks and the field was dry enough for the girls to walk in without boots. However, everything was wet with heavy dew and they got their legs wet. The weeds seemed to have shot up in the last week or two. All was running, but the LGR pressure was railed high and the CH4 concentration was really high. 6:57PST, 24.81C, 155.10Torr, 14.701usec, 10Hz, 4.922ppm I adjusted the pressure to 140.29Torr and the CH4 fell to 3.836ppm. Later I discovered that the tubing between the tower and the external 2um filter had broken and we are sucking air from below the grass canopy. We checked the LGR calibration with the 3.276ppm cal tank and the LGR reported 3.26ppm. We decided this was okay. I replaced the broken tubing with the tubing from the regulator for calibration. When we left the LGR read: 7:44PST, 24.85C, 145.78Torr, 14.705usec, 10Hz, 1.857ppm I also checked the 40um filter and this was okay. The ring time seems to have improved by about 1.5usec. Maybe a higher flow than usual blew some of the dust out of the path. The Theta probes were put back in the field, but I did not have the wiring info with me. I?ll do it tomorrow on the way to Tonzi. The solar charger read 13.7V, 3.43A Solar, 0.7A Load. We collected data and swapped cards. Jaclyn cleaned the radiation sensors. We washed the solar panels. I collected a LI7500 and corn data that Frank had left in our box. |
4 photos found
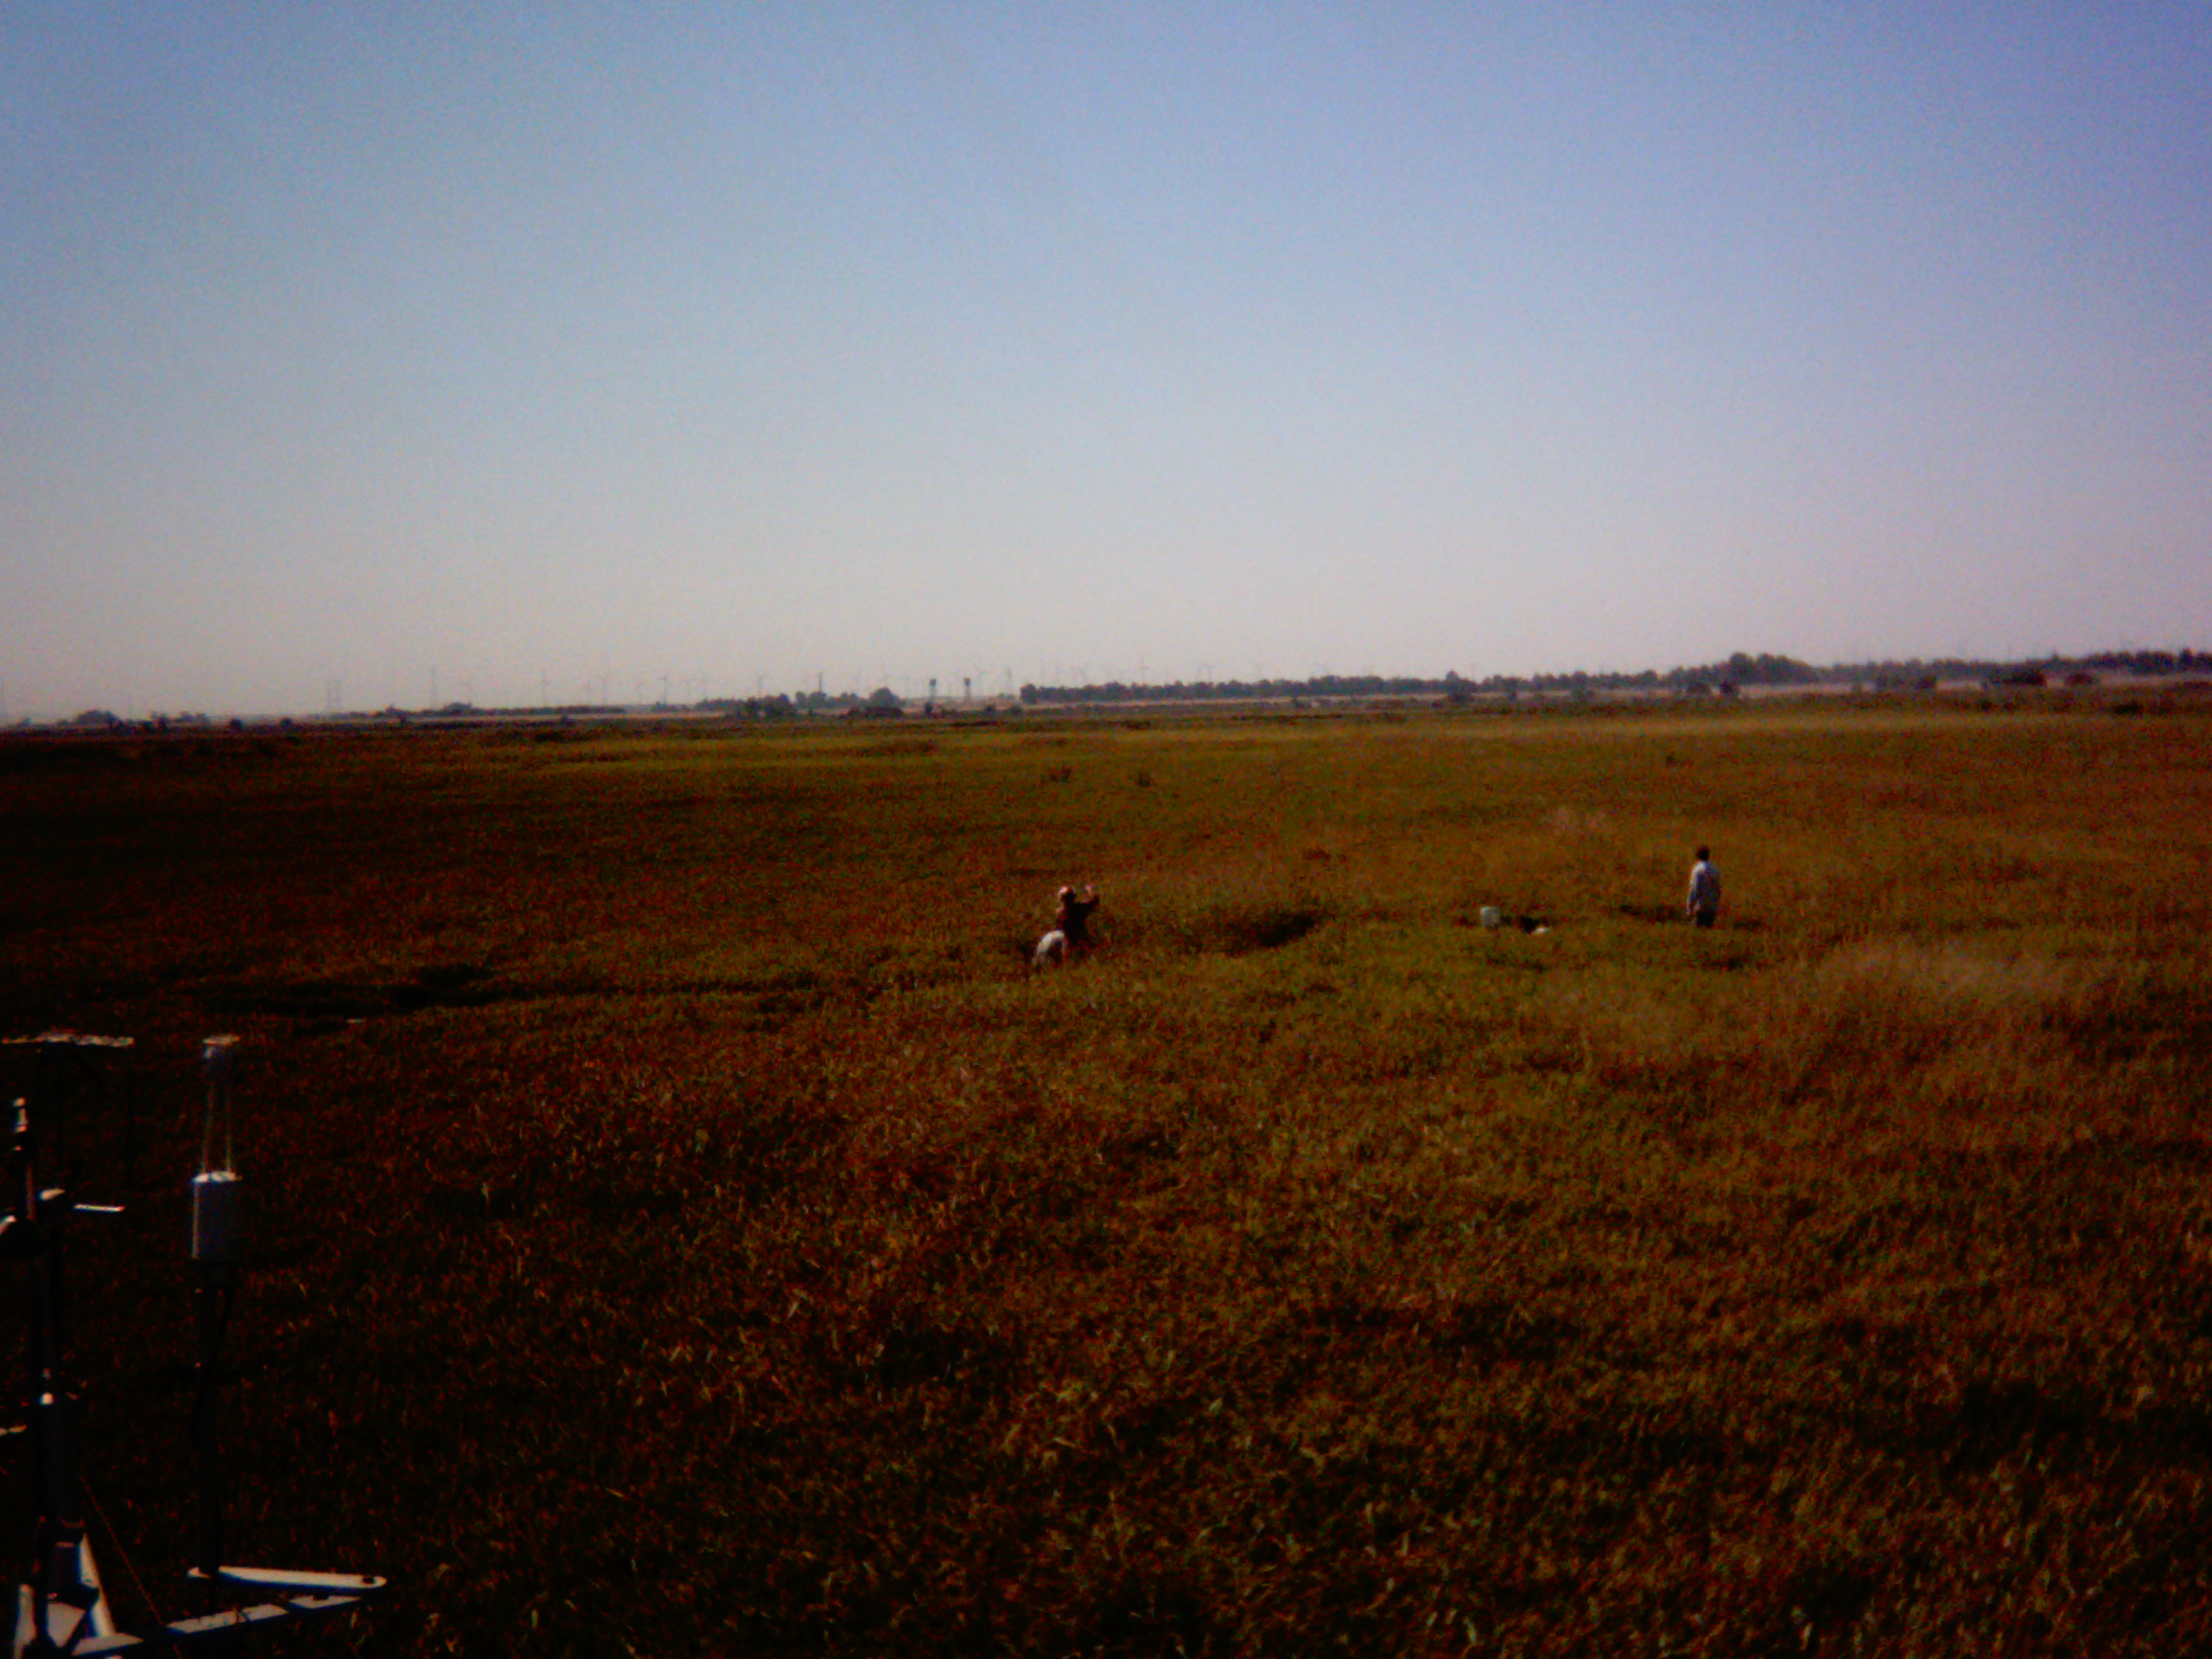
TW_plantcam_20110914_1330.jpg ( 2011-09-14 13:30:00 ) Full size: 2560x1920
UC Davis in the field.
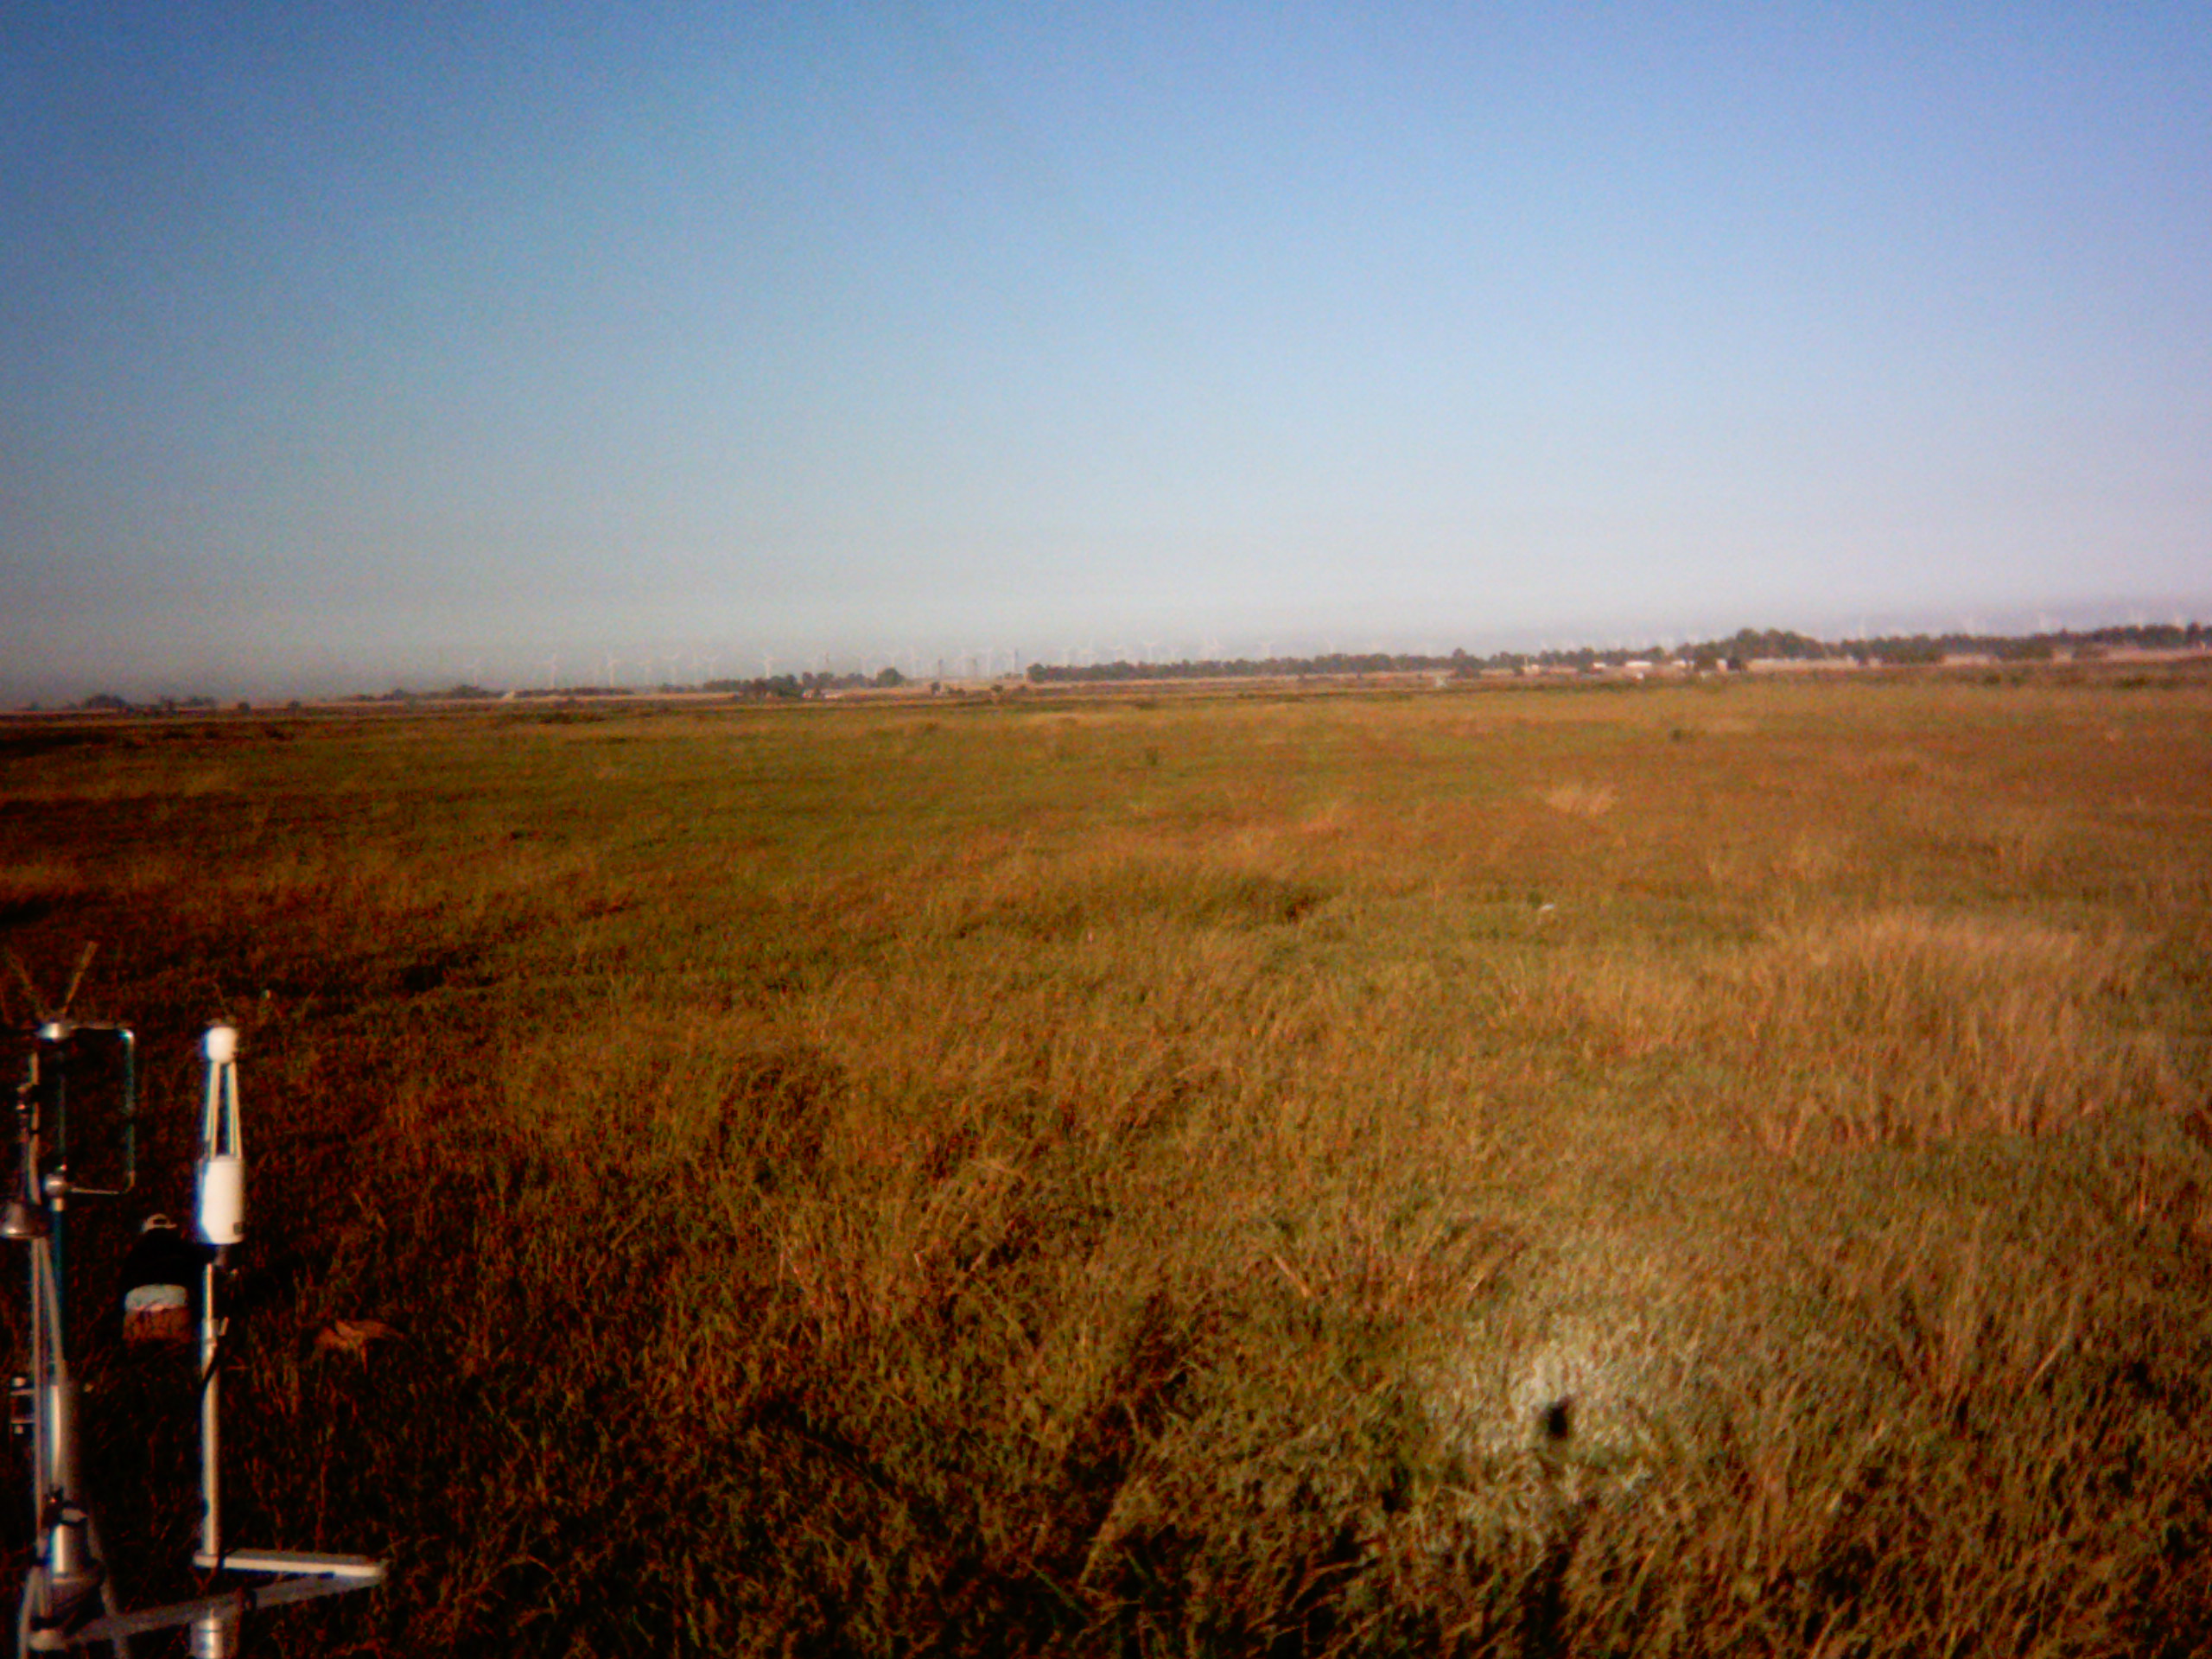
TW_plantcam_20110915_0700.jpg ( 2011-09-15 07:00:00 ) Full size: 2560x1920
UC Davis in the field.
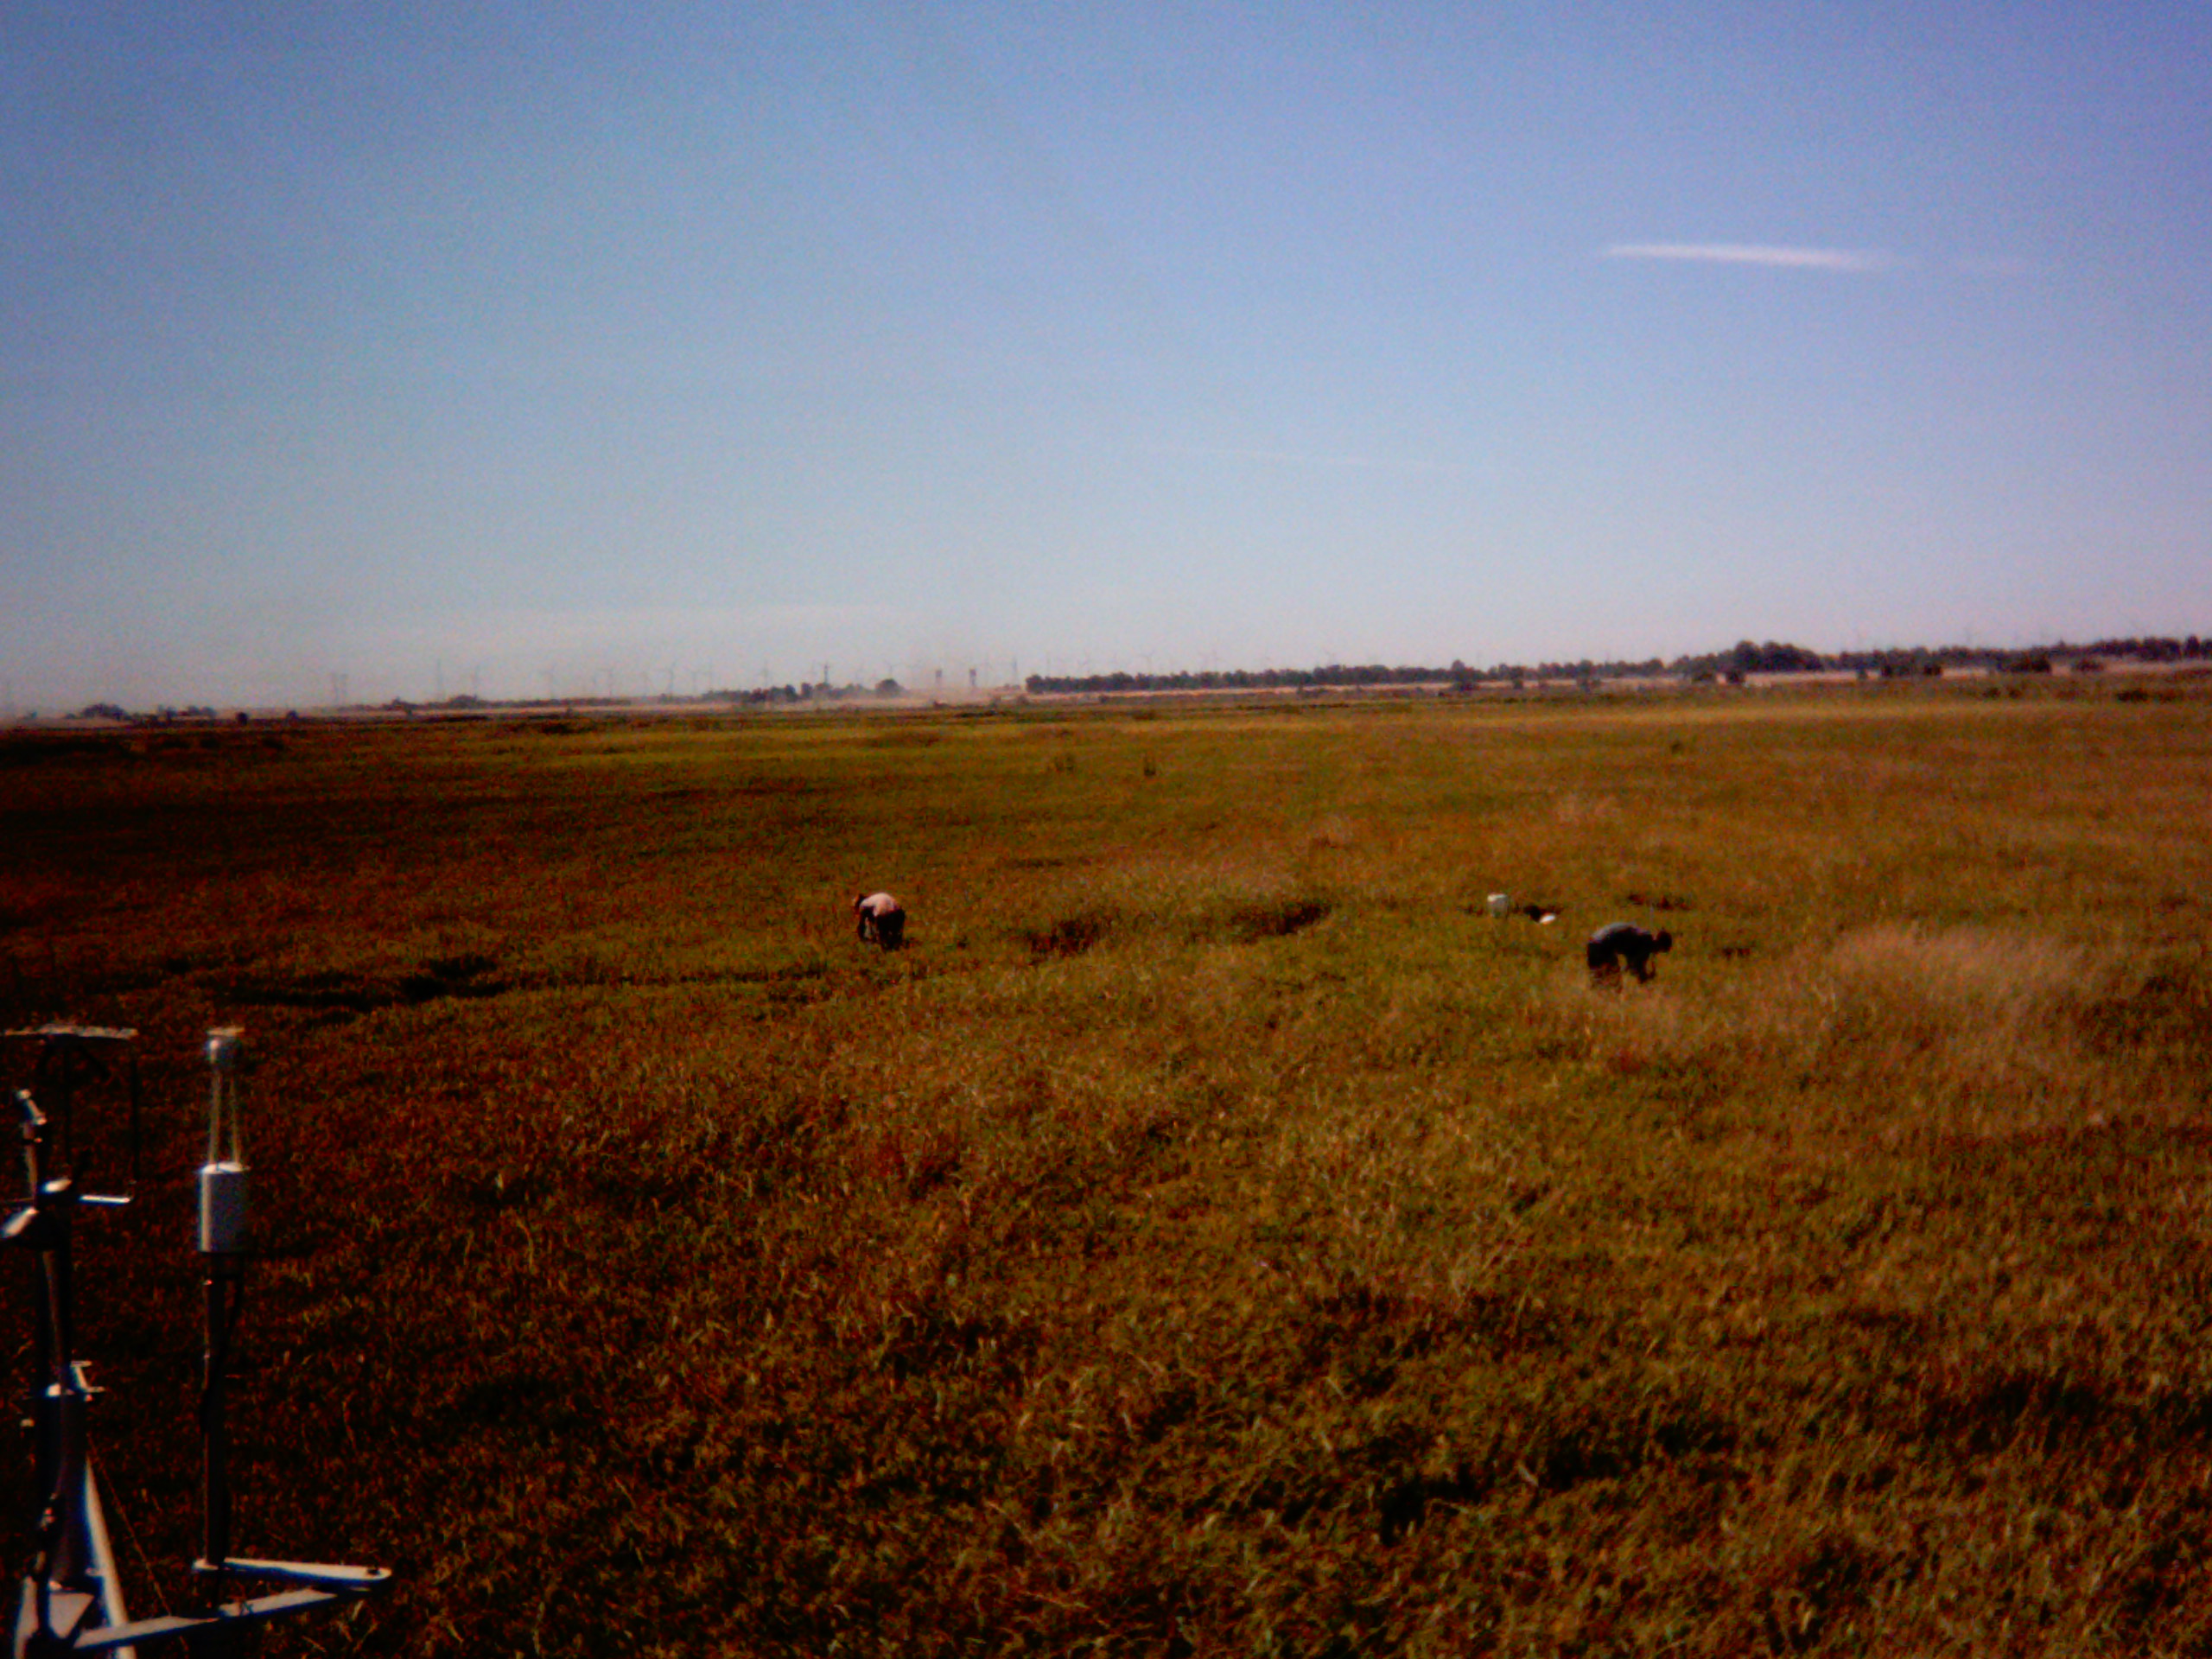
TW_plantcam_20110915_1241.jpg ( 2011-09-15 12:41:00 ) Full size: 2560x1920
UC Davis in the field.
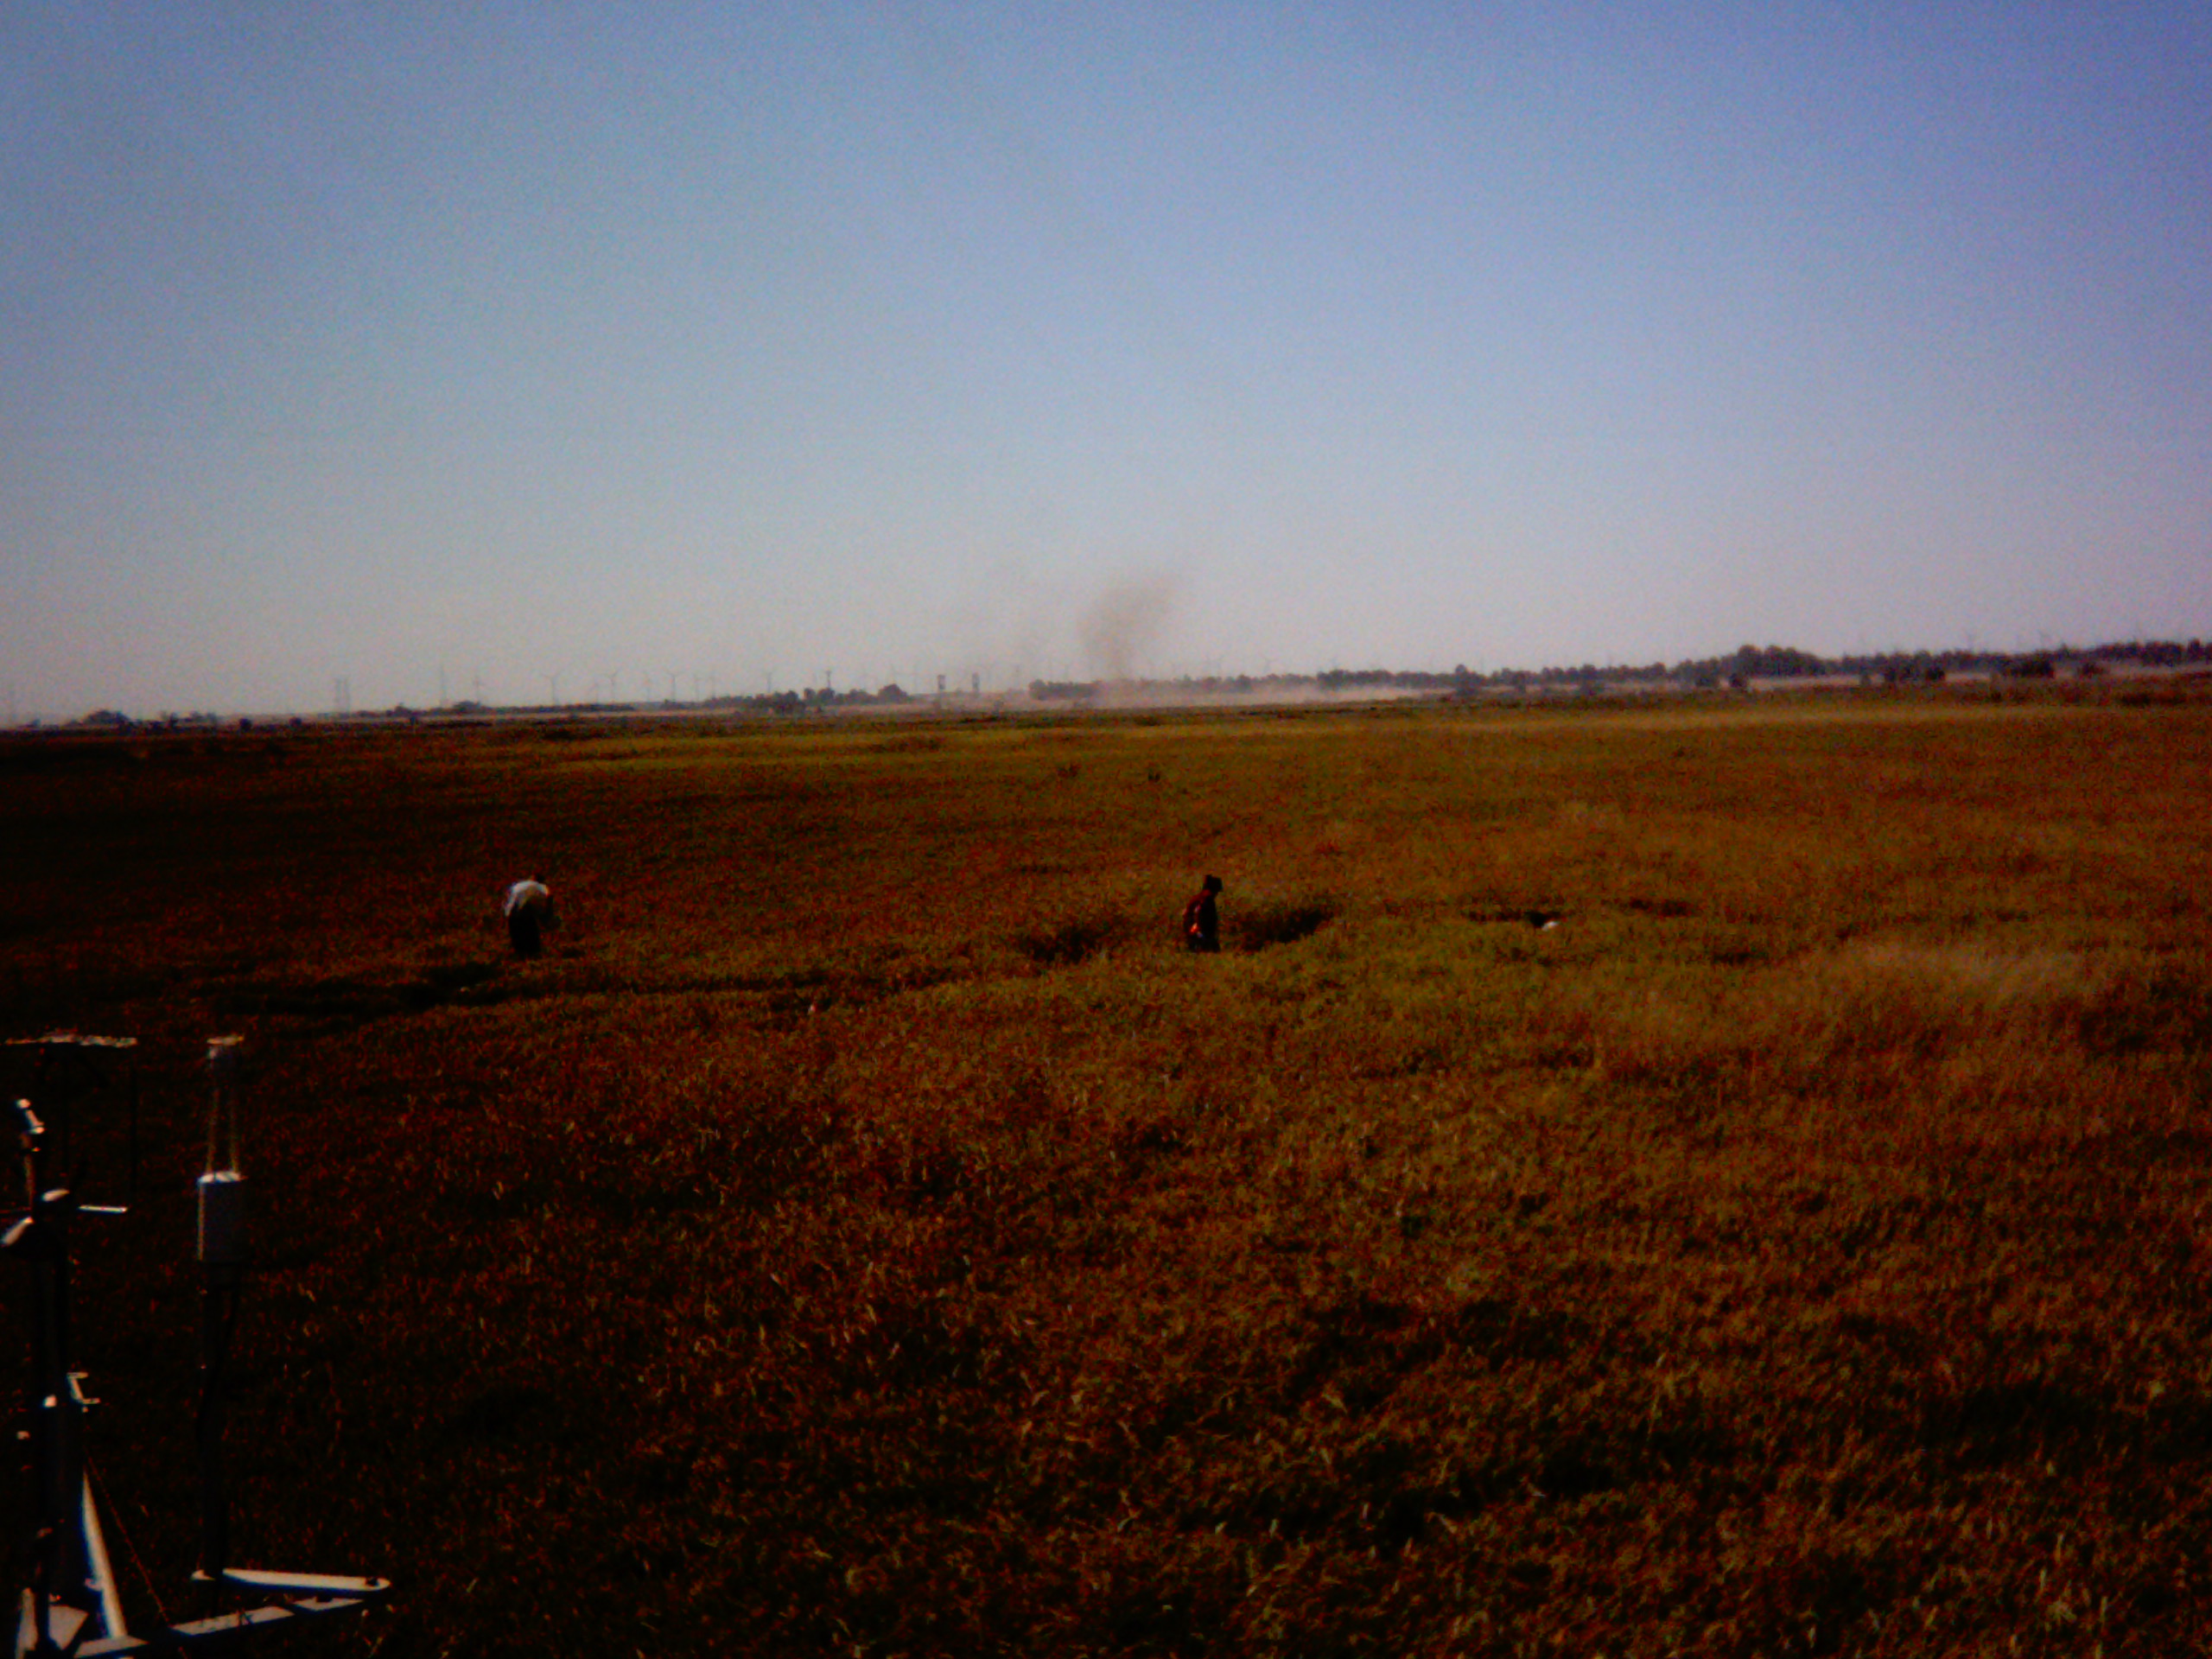
TW_plantcam_20110916_1330.jpg ( 2011-09-16 13:30:00 ) Full size: 2560x1920
UC Davis in the field.
6 sets found
12 TW_met graphs found
5 TW_flux graphs found
Can't check TWSI_mixed
Can't check SIMBTWEE_met
1 TW_cam graphs found
Can't check TATWBABCSB_cam