
Field Notes
<--2011-06-02 12:52:00 | 2011-06-30 11:00:00-->Other sites visited today: Twitchell Rice | Mayberry
Phenocam link: Searching...
Sherman Island: 2011-06-21 11:00:00 (DOY 172)
Author: Joe Verfaillie
Others: Jose
Summary: Swapped LI7500, Still problems with soil co2 data logger, funnel fell of tipping bucket, pepper weed in full bloom.
| Sherman
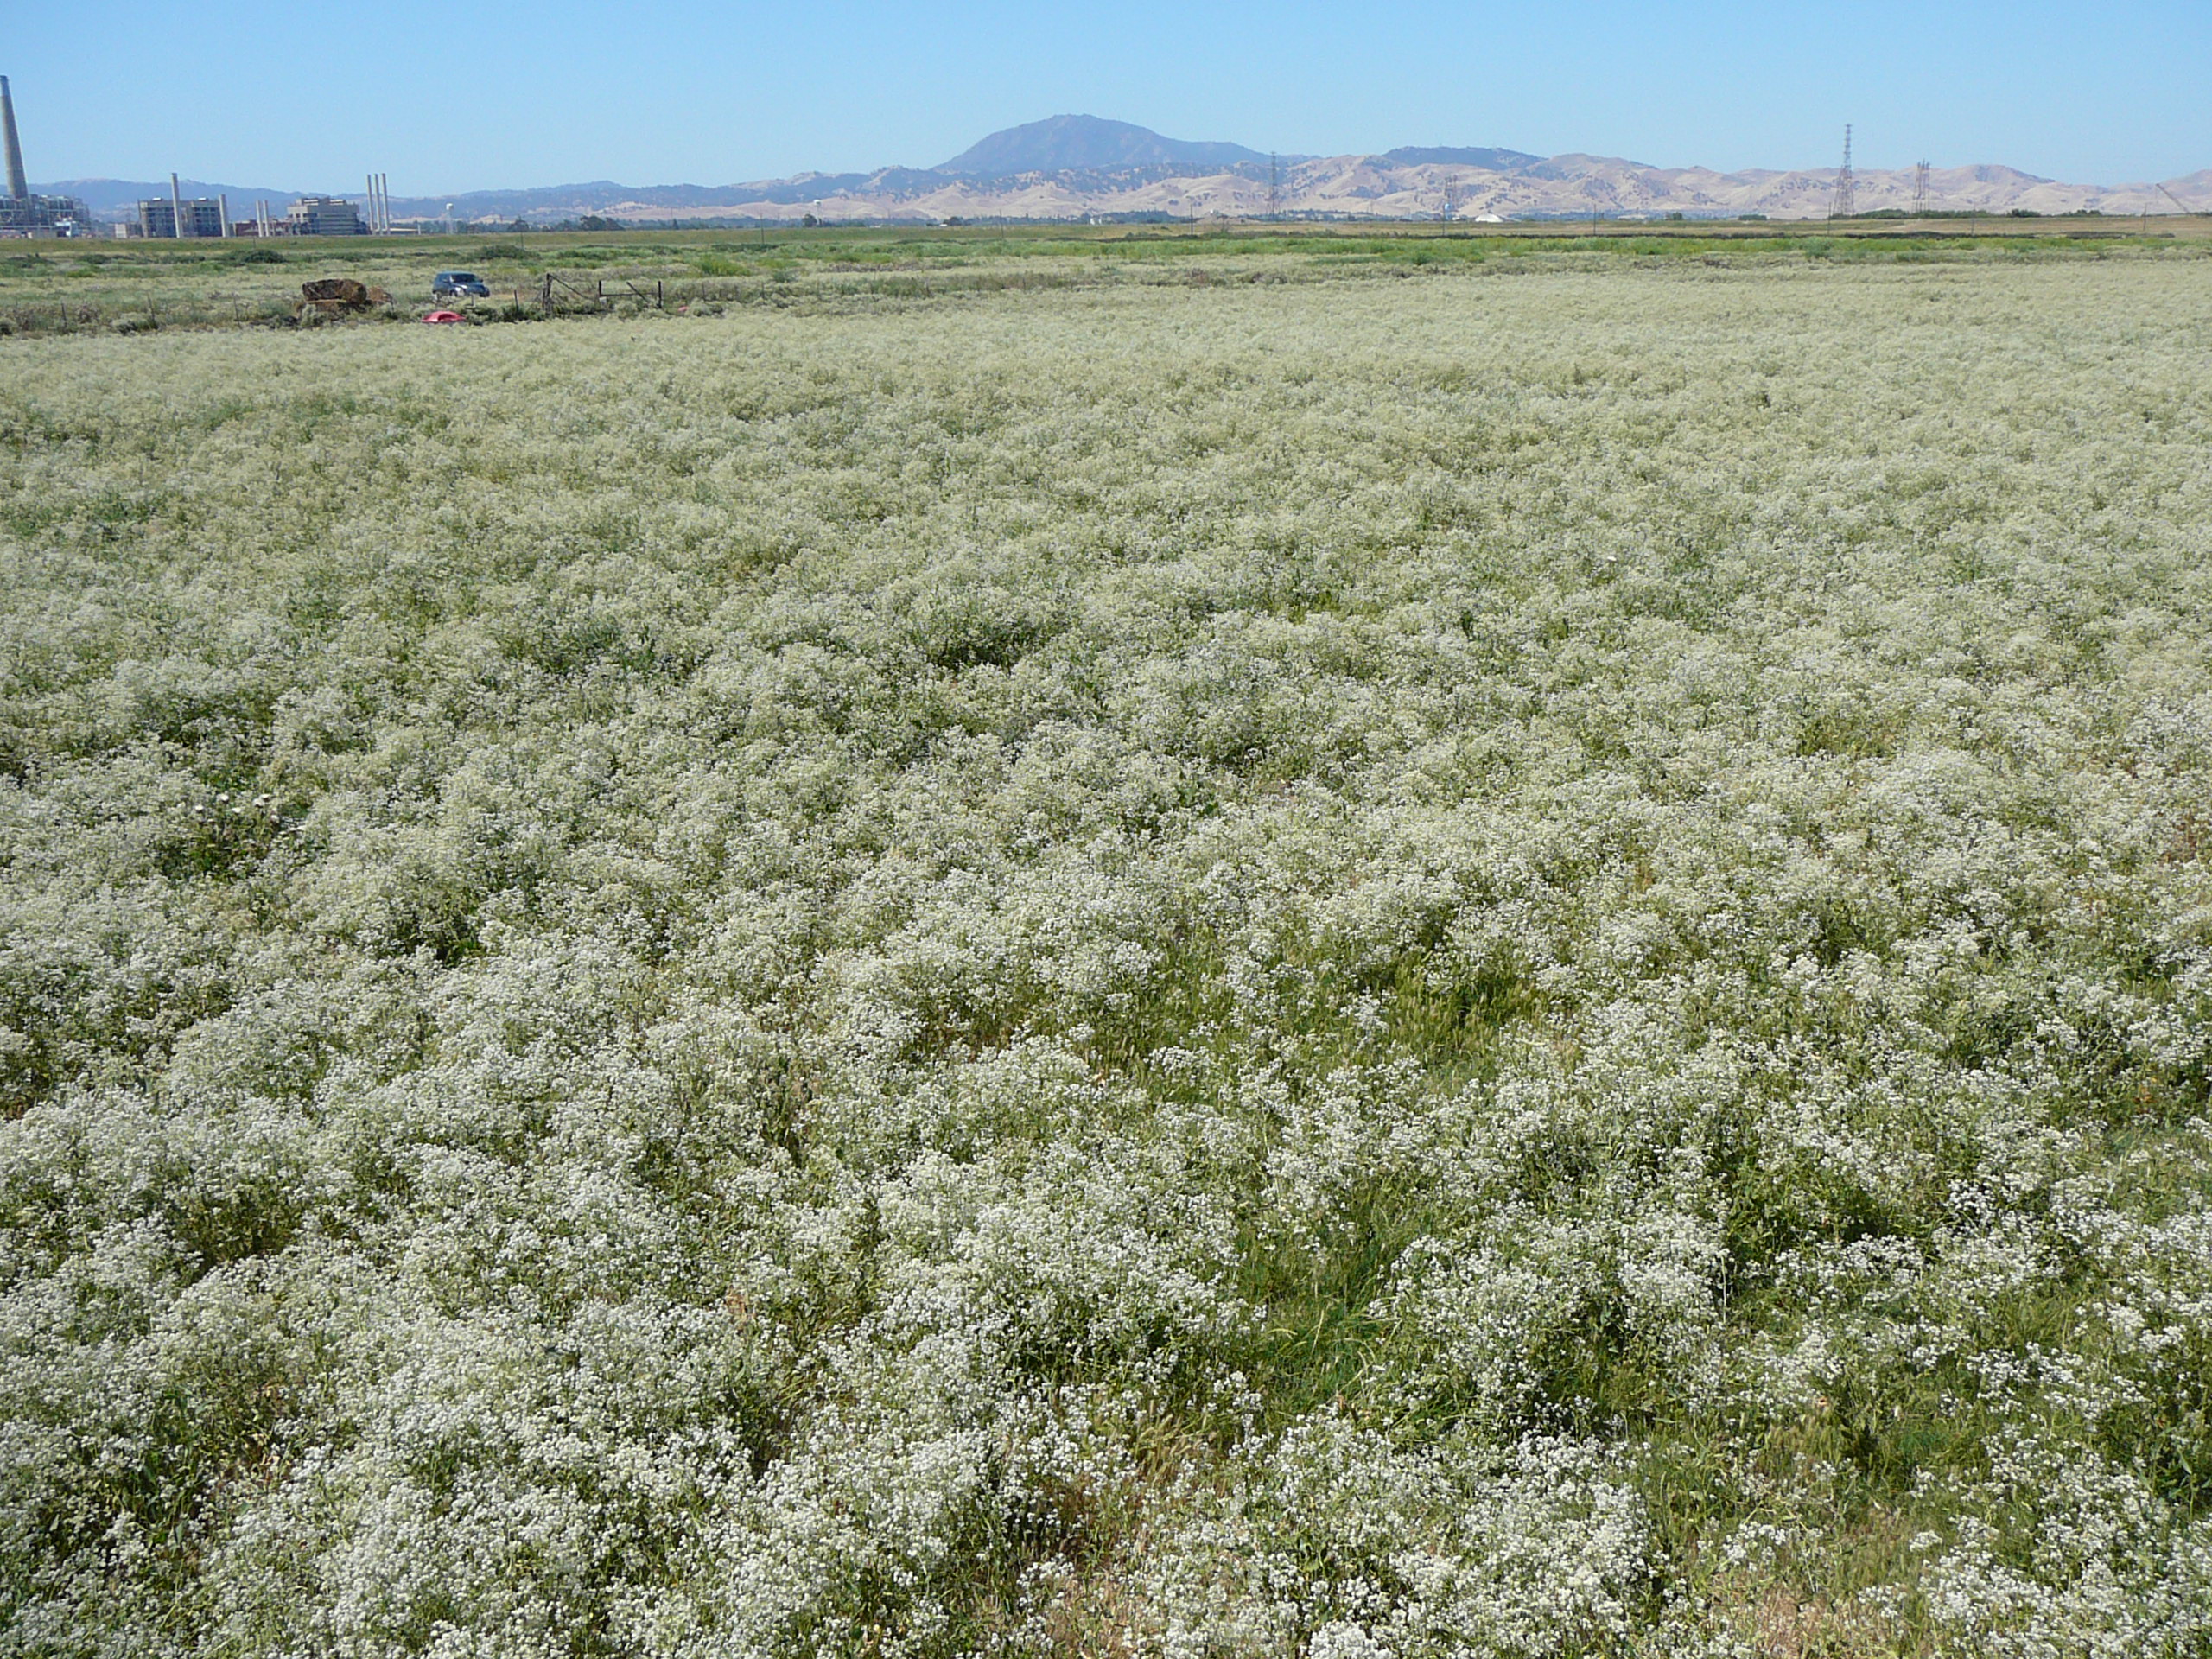
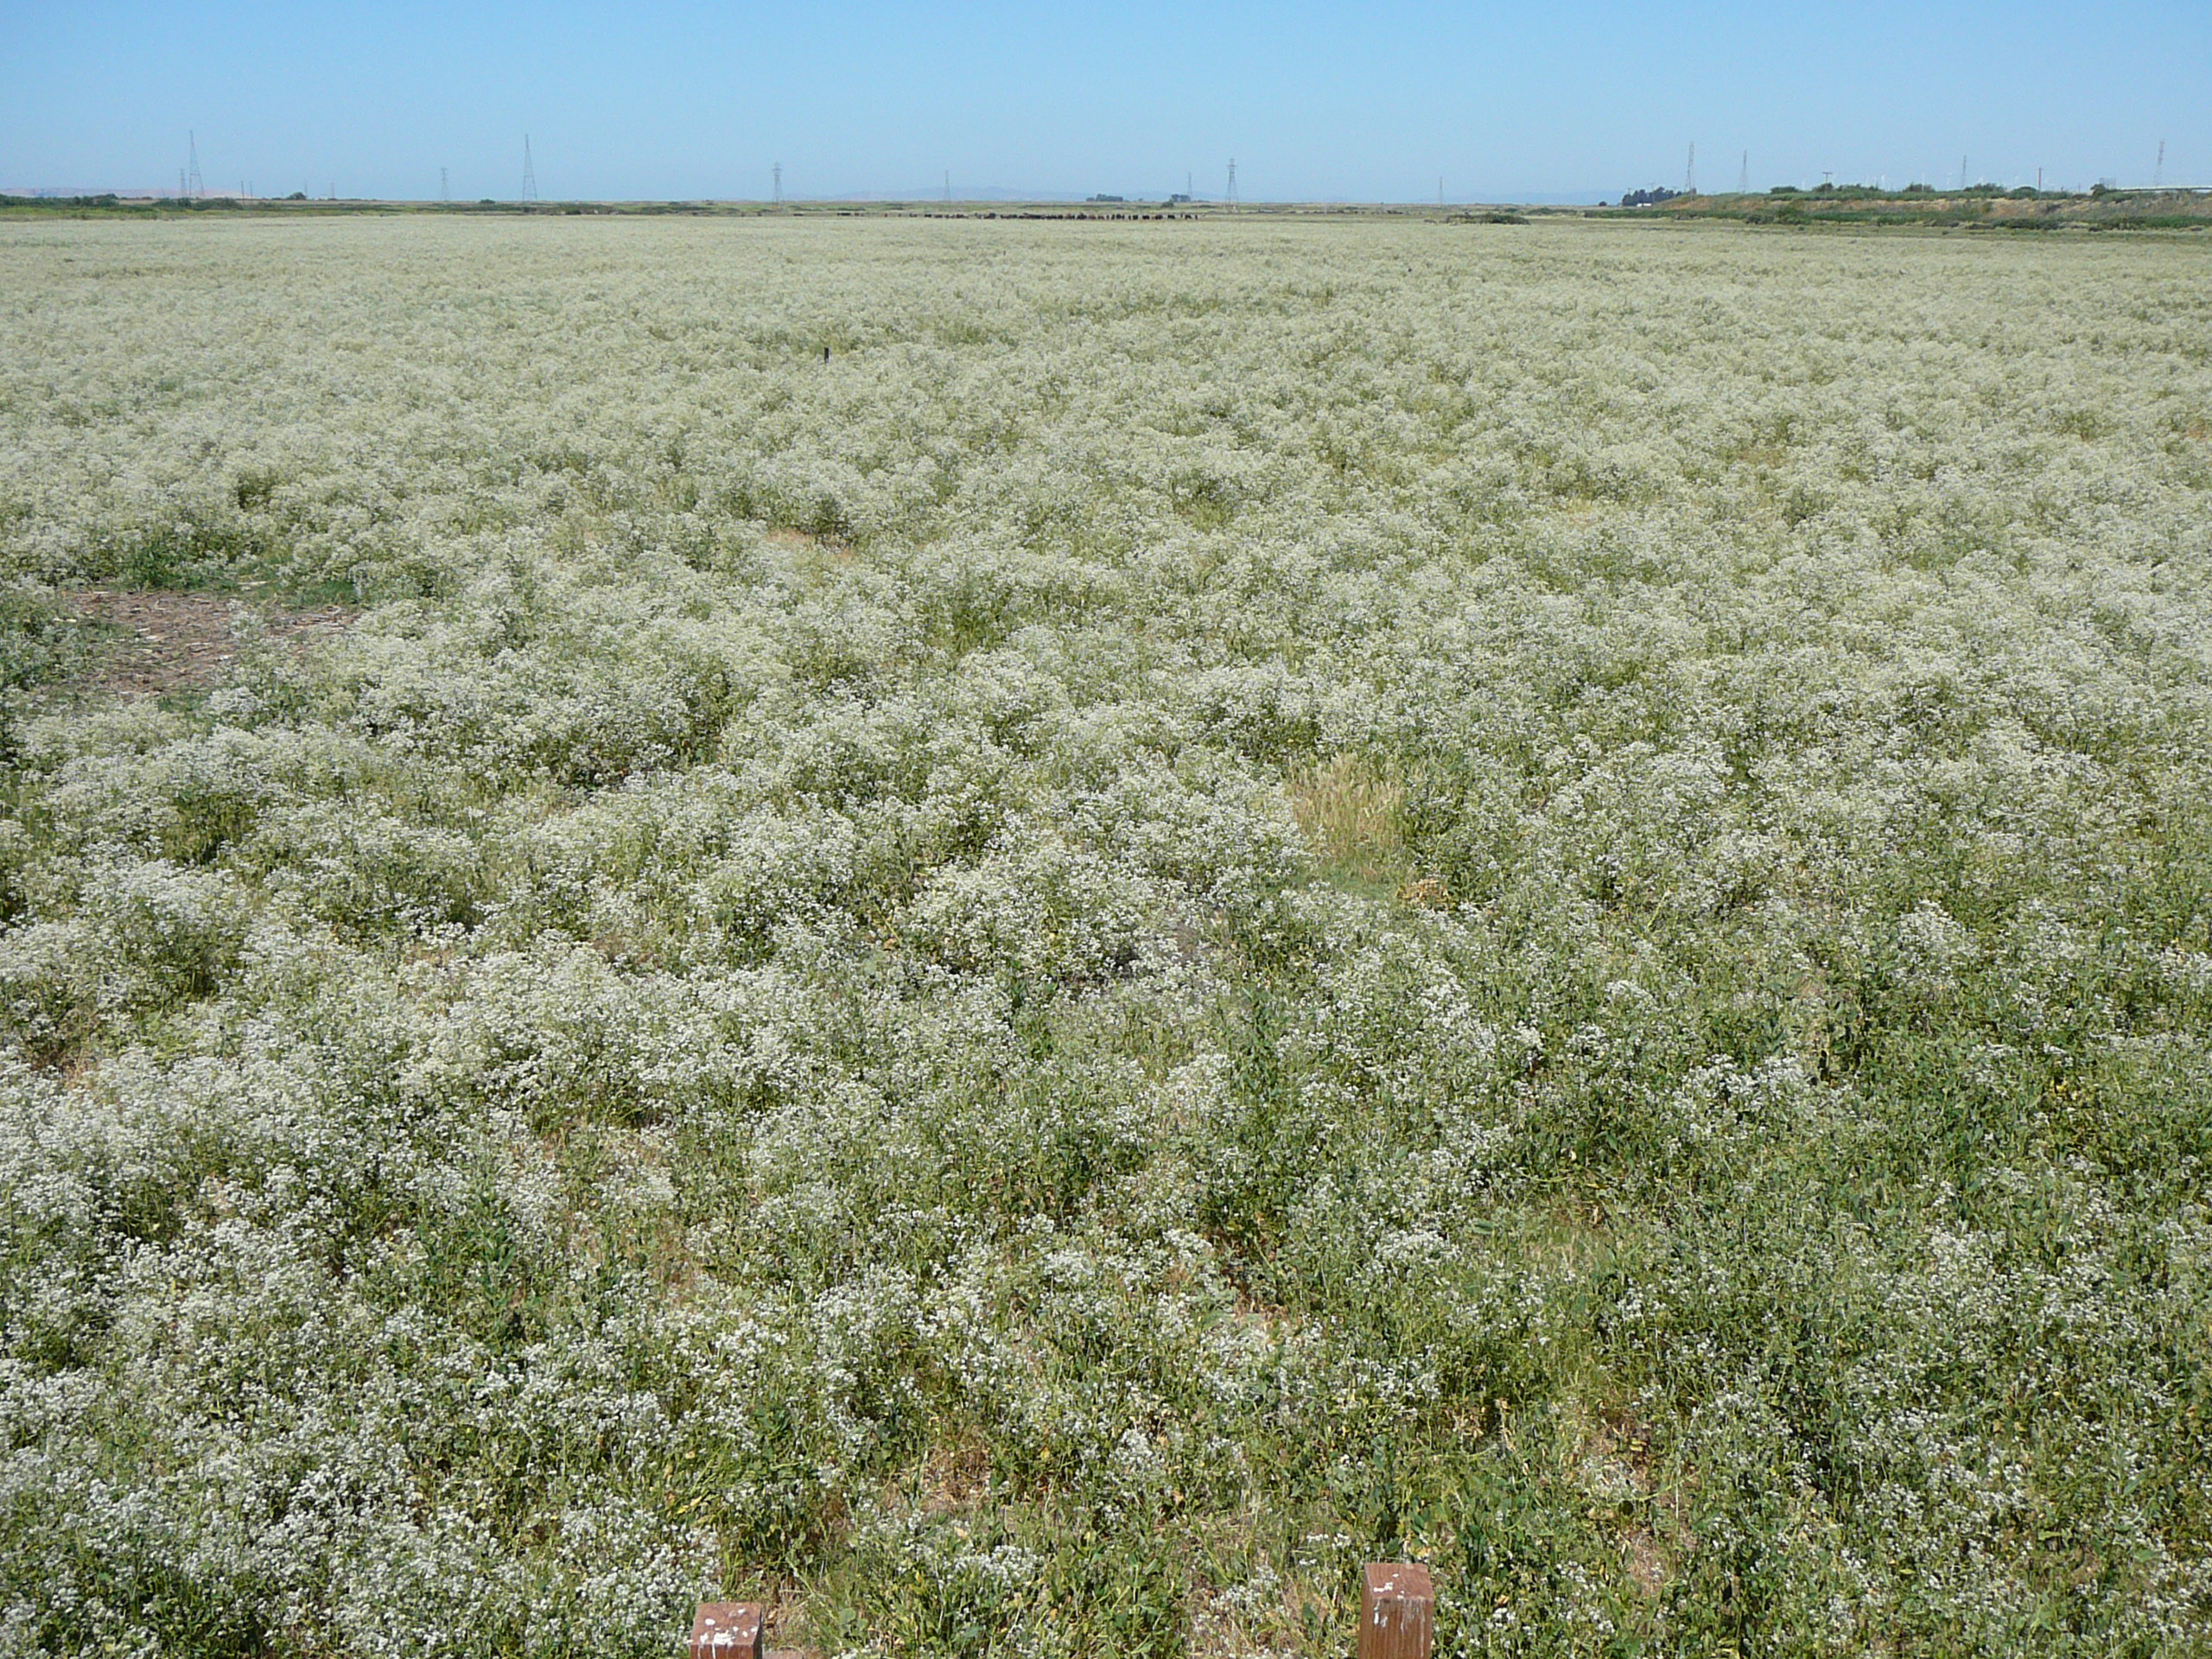
2011-06-21 I arrived about 11am with Jose. It was clear, sunny and hot with almost no wind. There was just a breath of breeze from the south. The pepper weed was in full bloom and stood about mid-thigh in the field and waist high inside the cow fence. From the bridge on the way home, the north ditch was damp but no water visible and the south ditch had water in it, which is unusual. I collected data. I did a full collection from the soil co2 system. The clock on that data logger was way off. Various times: Cell Phone 2011-06-21 11:14:00 Computer 2011-06-21 10:15:00 Data logger 1964-01-03 01:22:53 I started the data collection when the data logger’s clock read 01:24:00. Times on the data collected were unintelligible. I could not recreate data order. I swapped the LI7500. Sn 0073 came off and sn 0042 went on. The funnel on top of the rain bucket had fallen off. I found by the foot of the tower. Probably knocked off by a bird. I took photos of the diffuse PAR system. We did the moisture point probes. The last reading looked strange with the location number (4) blinking, maybe saturated? East sn ending in DAA1 12.7, 36.8, 36.6, 11.1 12.4, 36.5, 36.8, 11.1 North sn ending in 072 22.9, 33.8, 36.3, 11.1 22.9, 34.1, 41.9, 11.1 West 12.7, 25.8, 36.3, 4.4 13.5, 26.1, 36.8, 96.7 And we read the wells. The west well seemed to have a layer of scum/debris on the surface of the water that fouled the well depth sensor. All measurements from the top of the pipe using the black fitting that comes with the depth sensor. East 3.1ft, west 3.0, north 3.85 I reinstalled soil heat flux plate #2 Jose did the LI2000 and spectrum, clip plots and digital photos. |
10 photos found
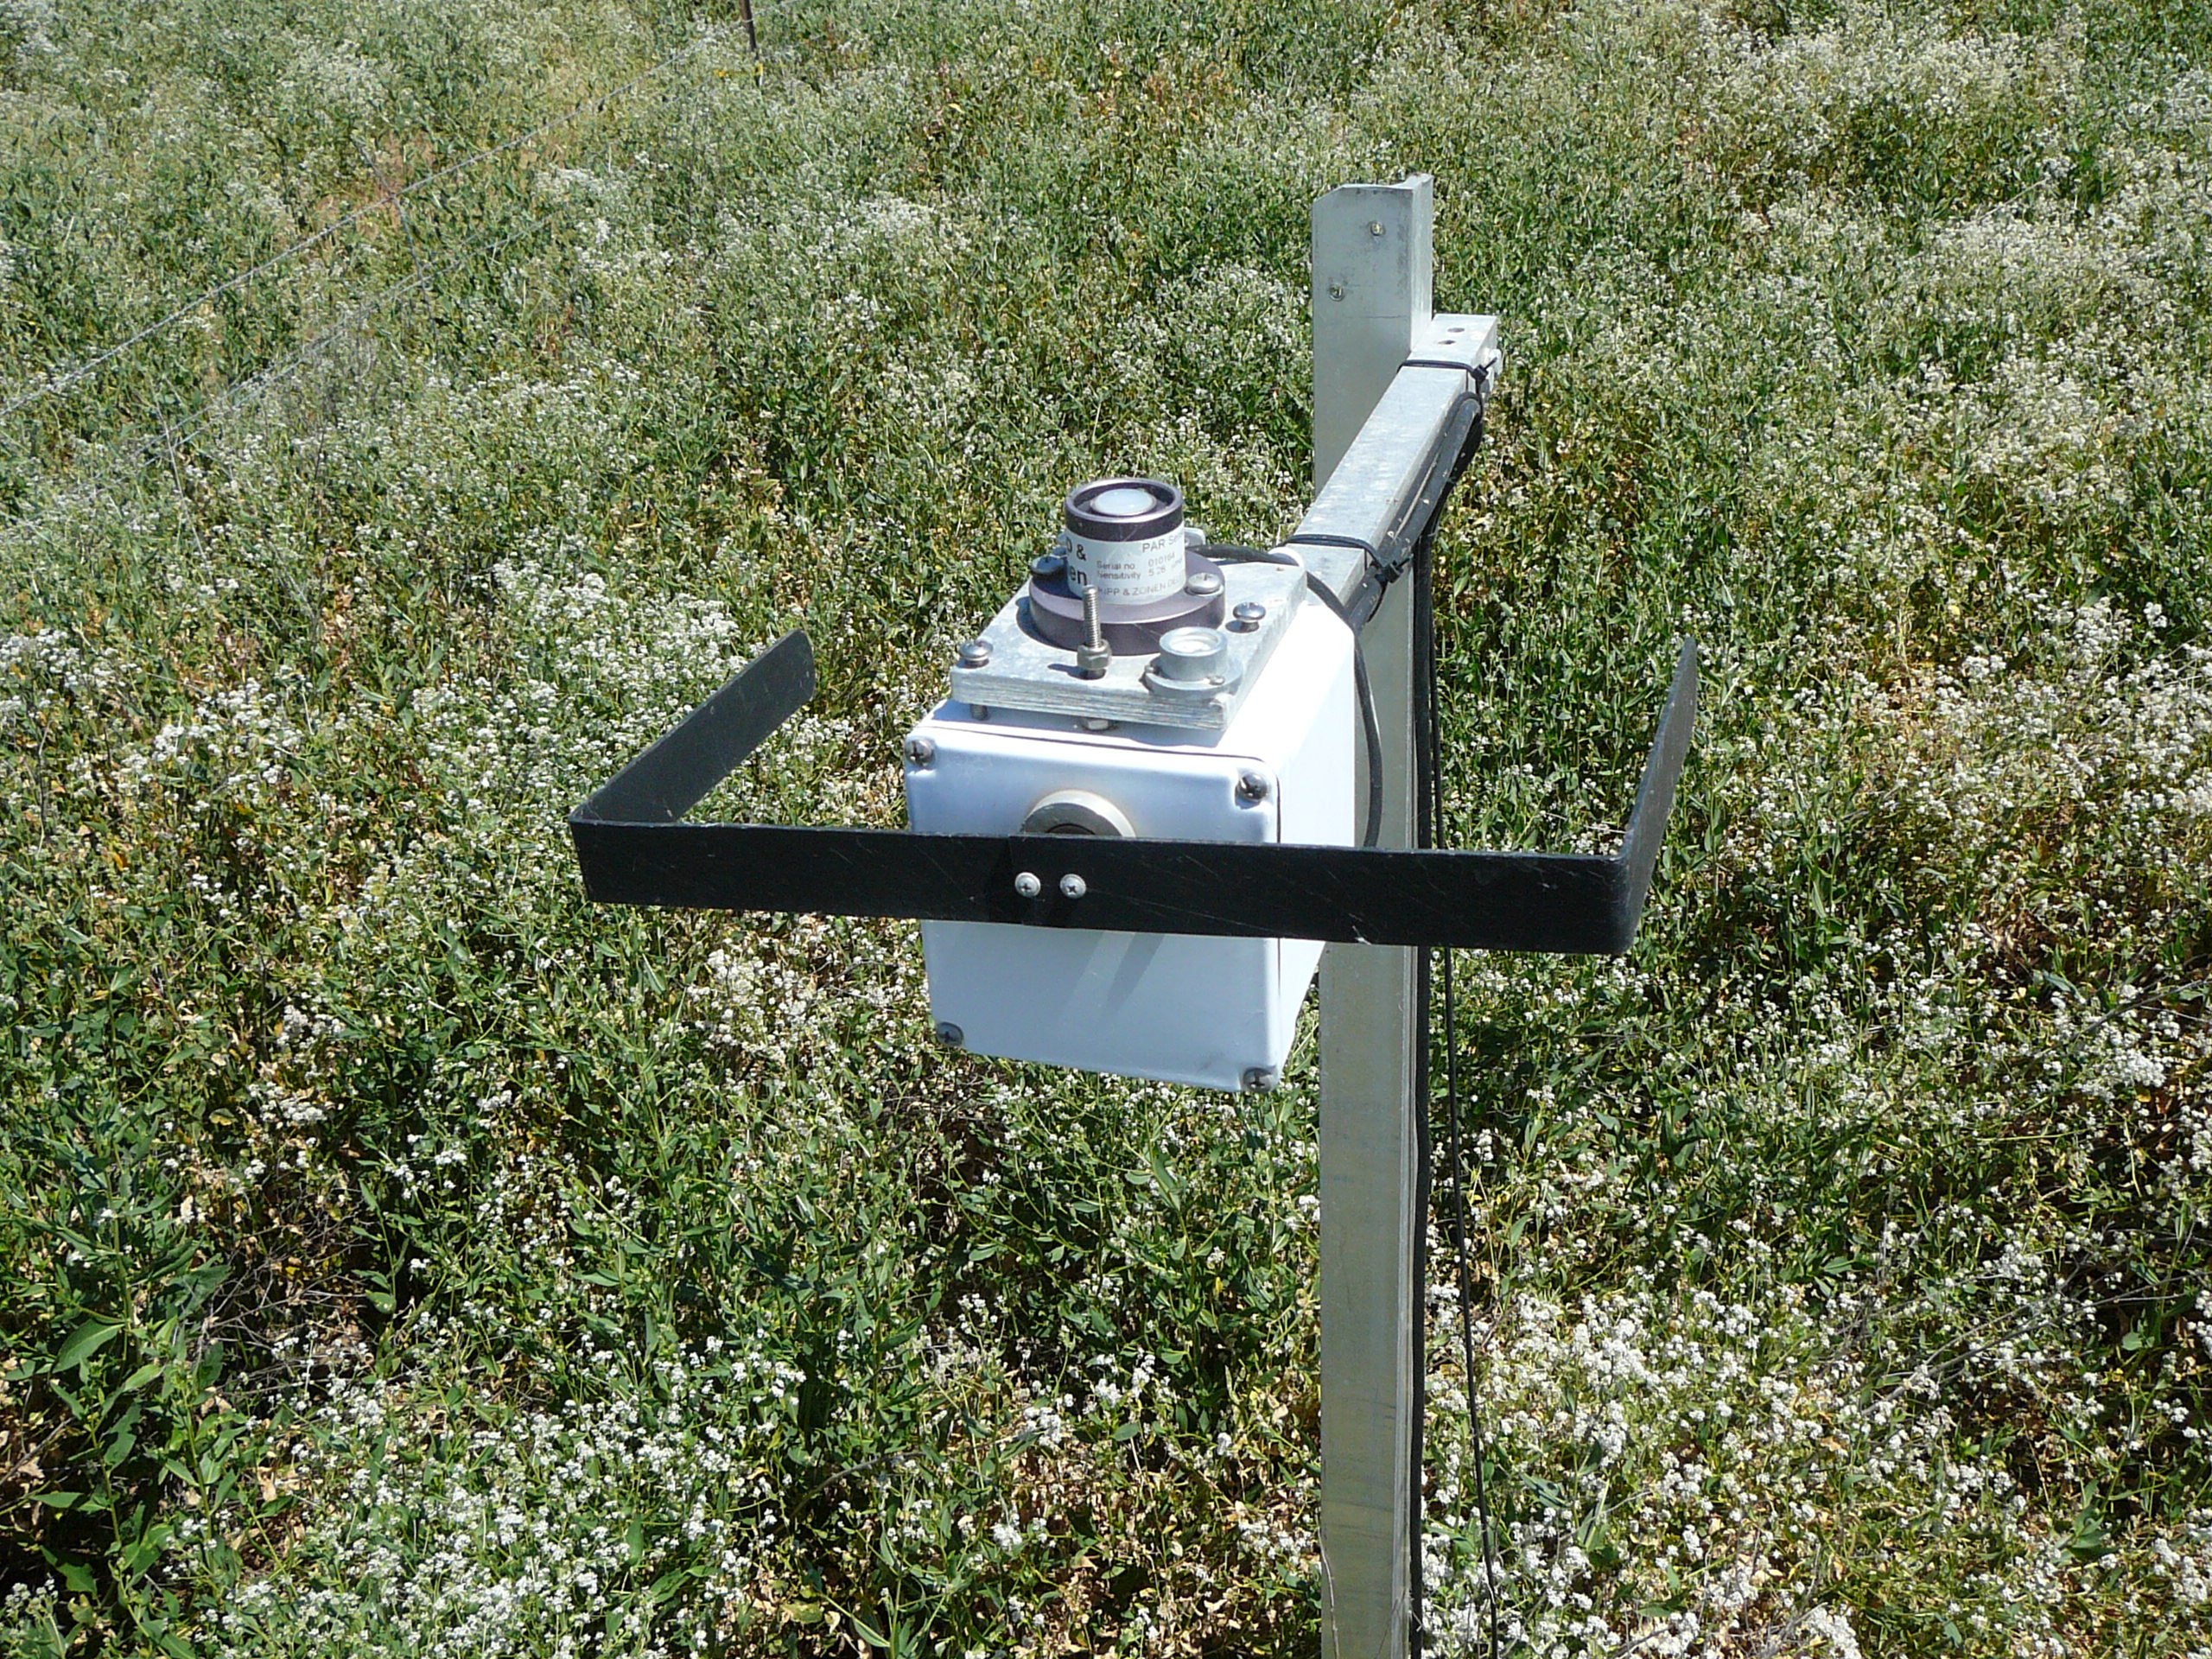
20110621SI_DiffusePAR1.jpg ( 2011-06-21 10:20:26 ) Full size: 2560x1920
Rotating shadow band for diffuse PAR
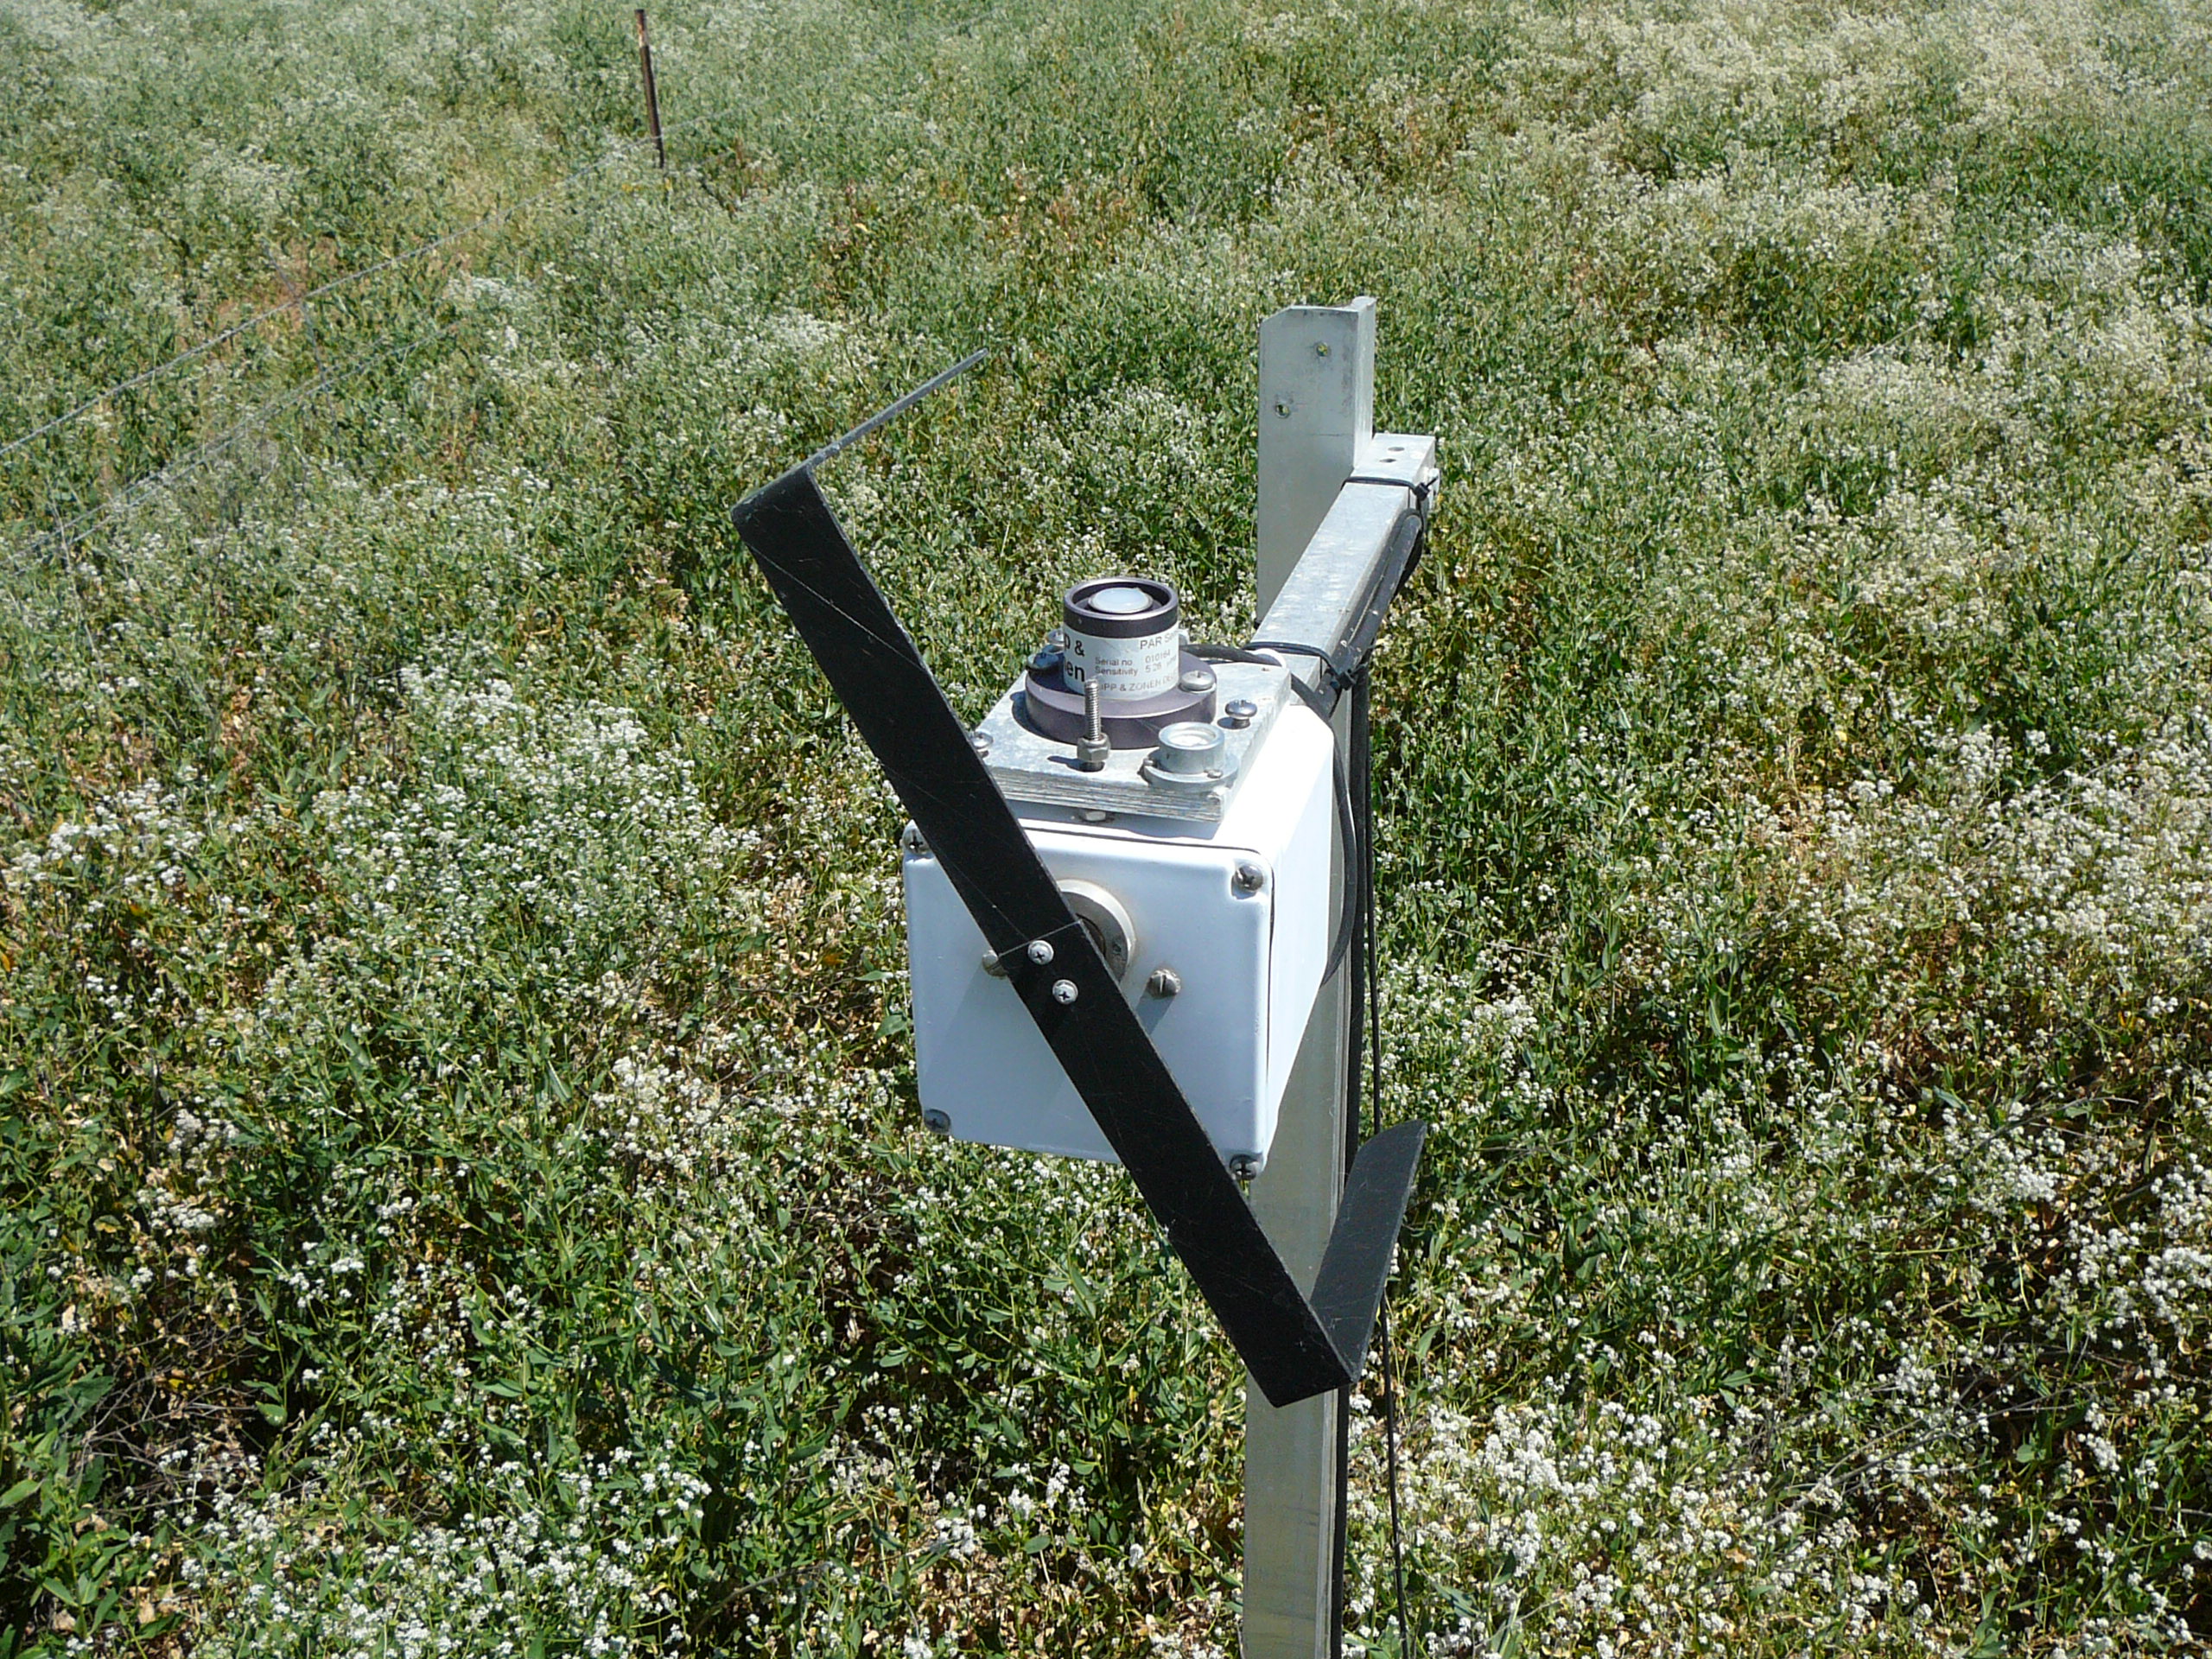
20110621SI_DiffusePAR2.jpg ( 2011-06-21 10:22:13 ) Full size: 2560x1920
Rotating shadow band for diffuse PAR
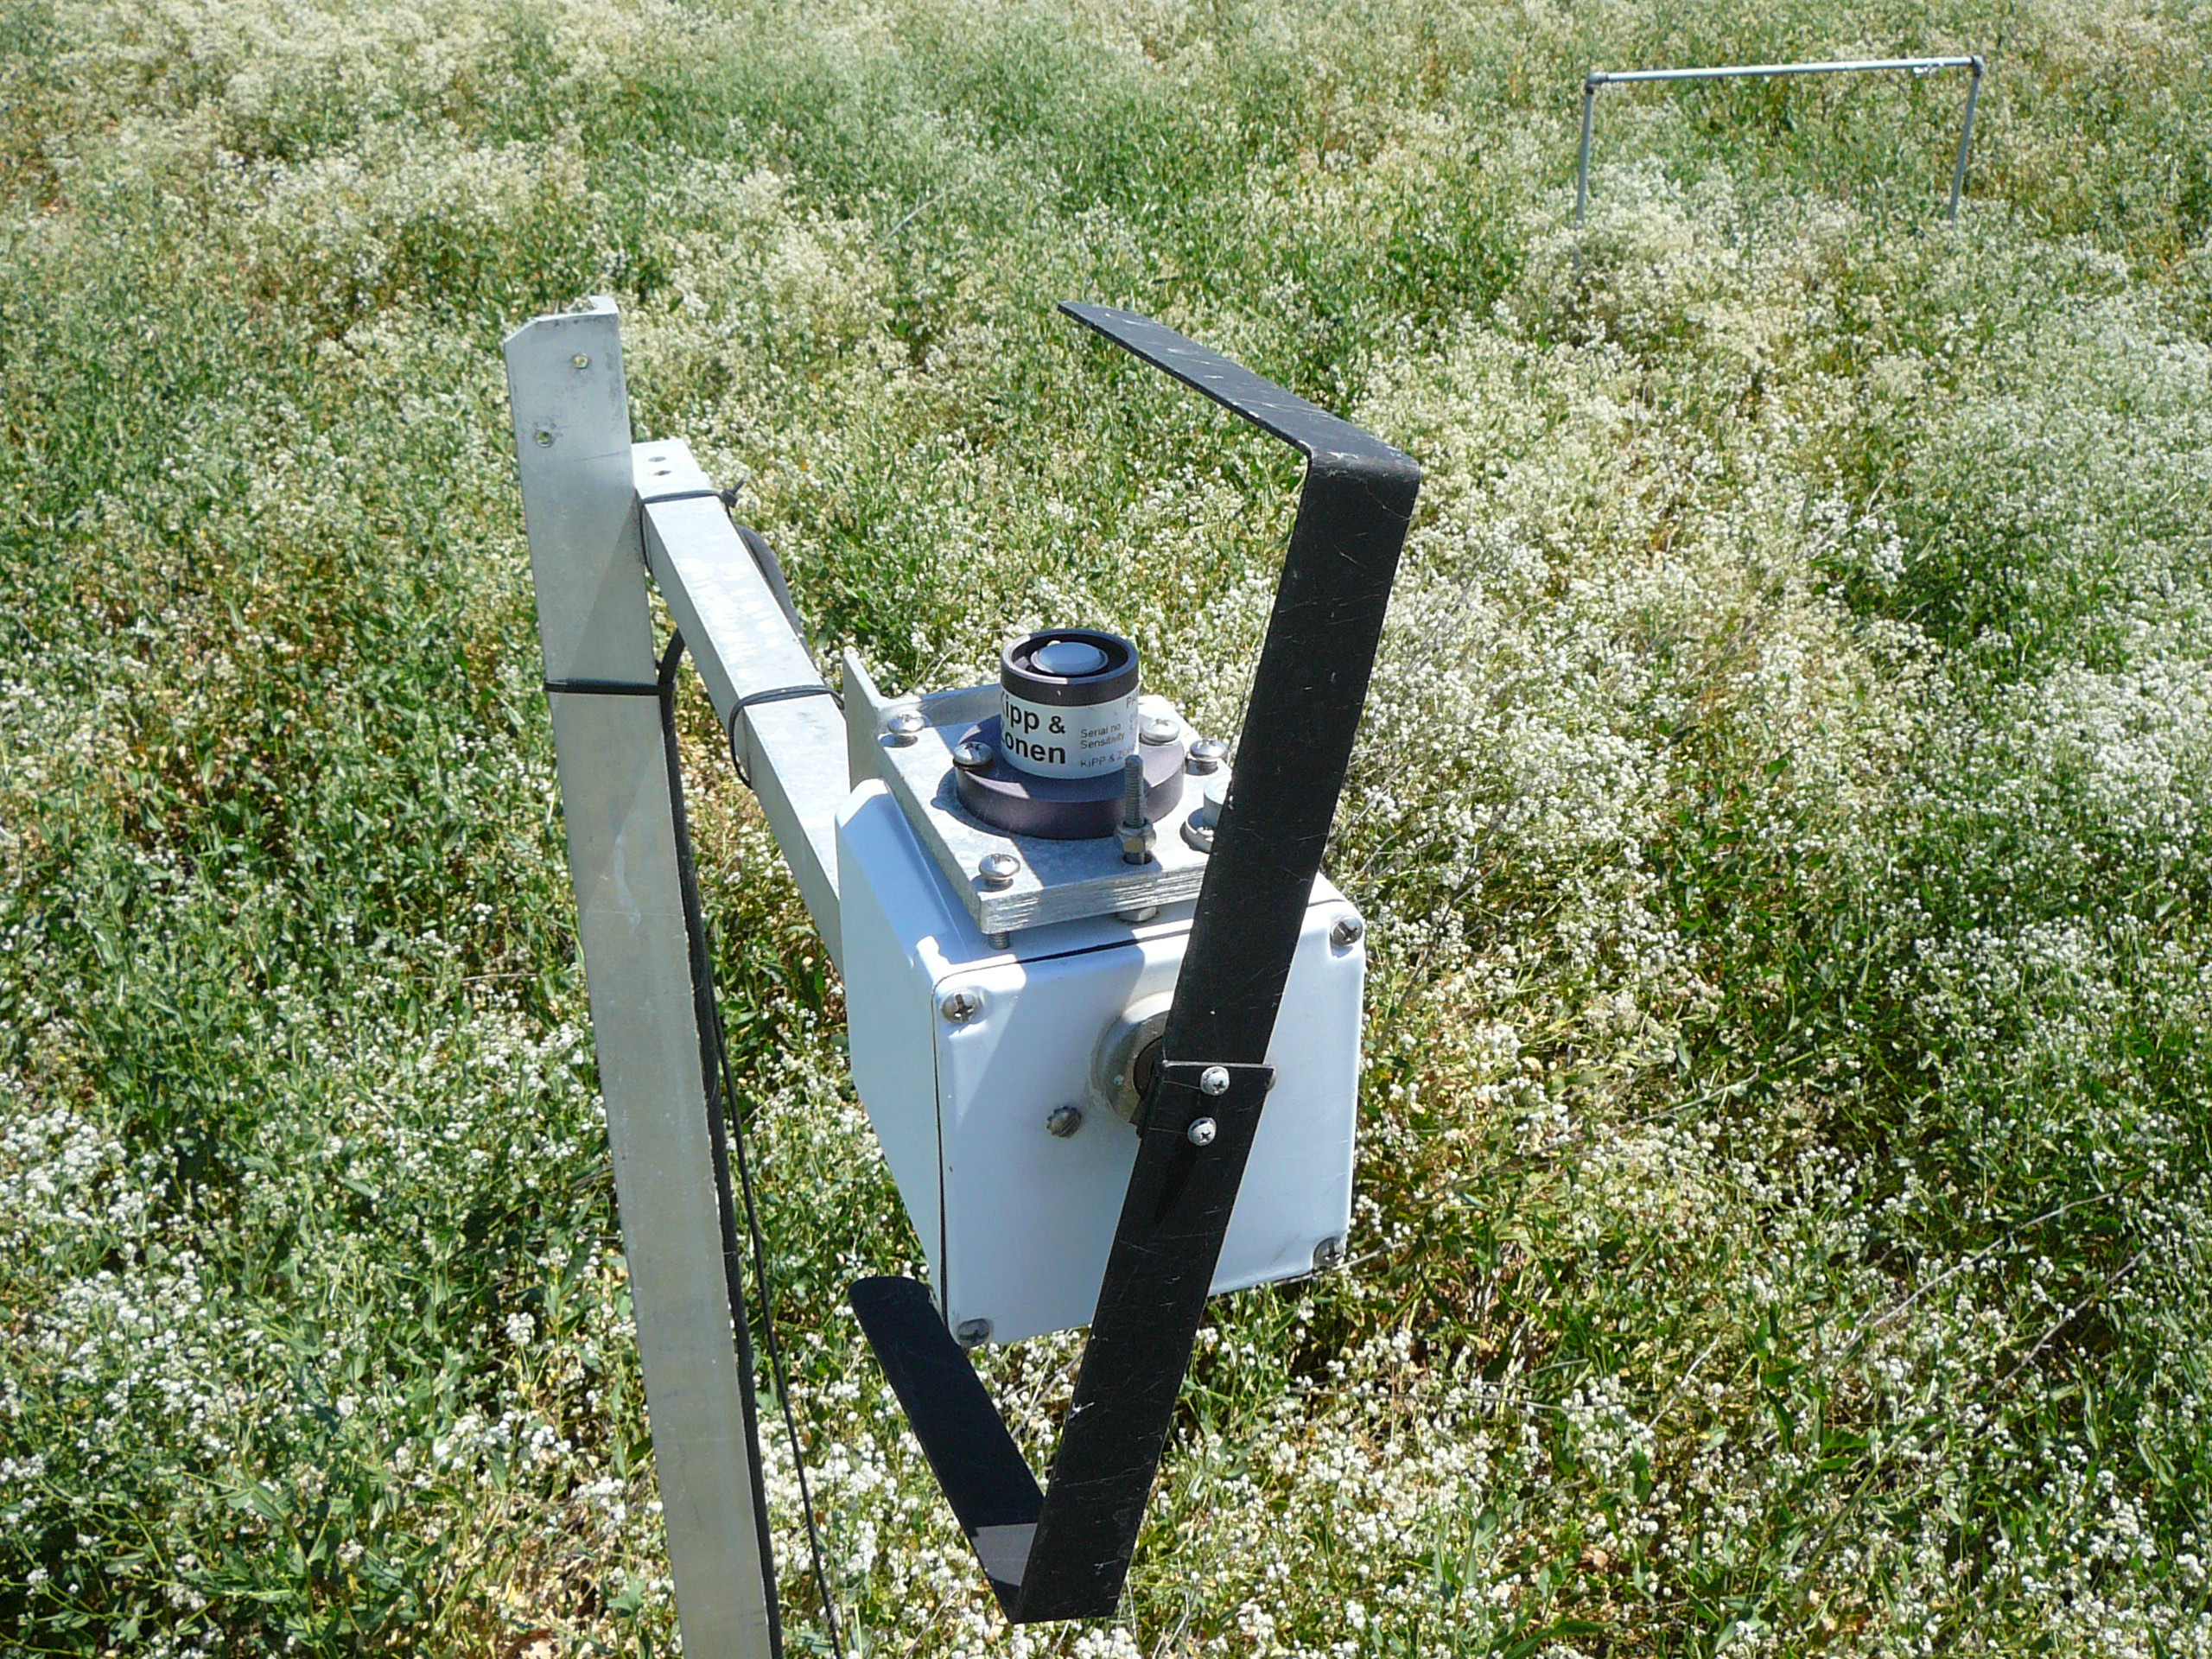
20110621SI_DiffusePAR3.jpg ( 2011-06-21 10:23:29 ) Full size: 2560x1920
Rotating shadow band for diffuse PAR
20110621SI_DiffusePARInside.jpg ( 2011-06-21 10:39:02 ) Full size: 2560x1920
AC motor for rotating shadow band
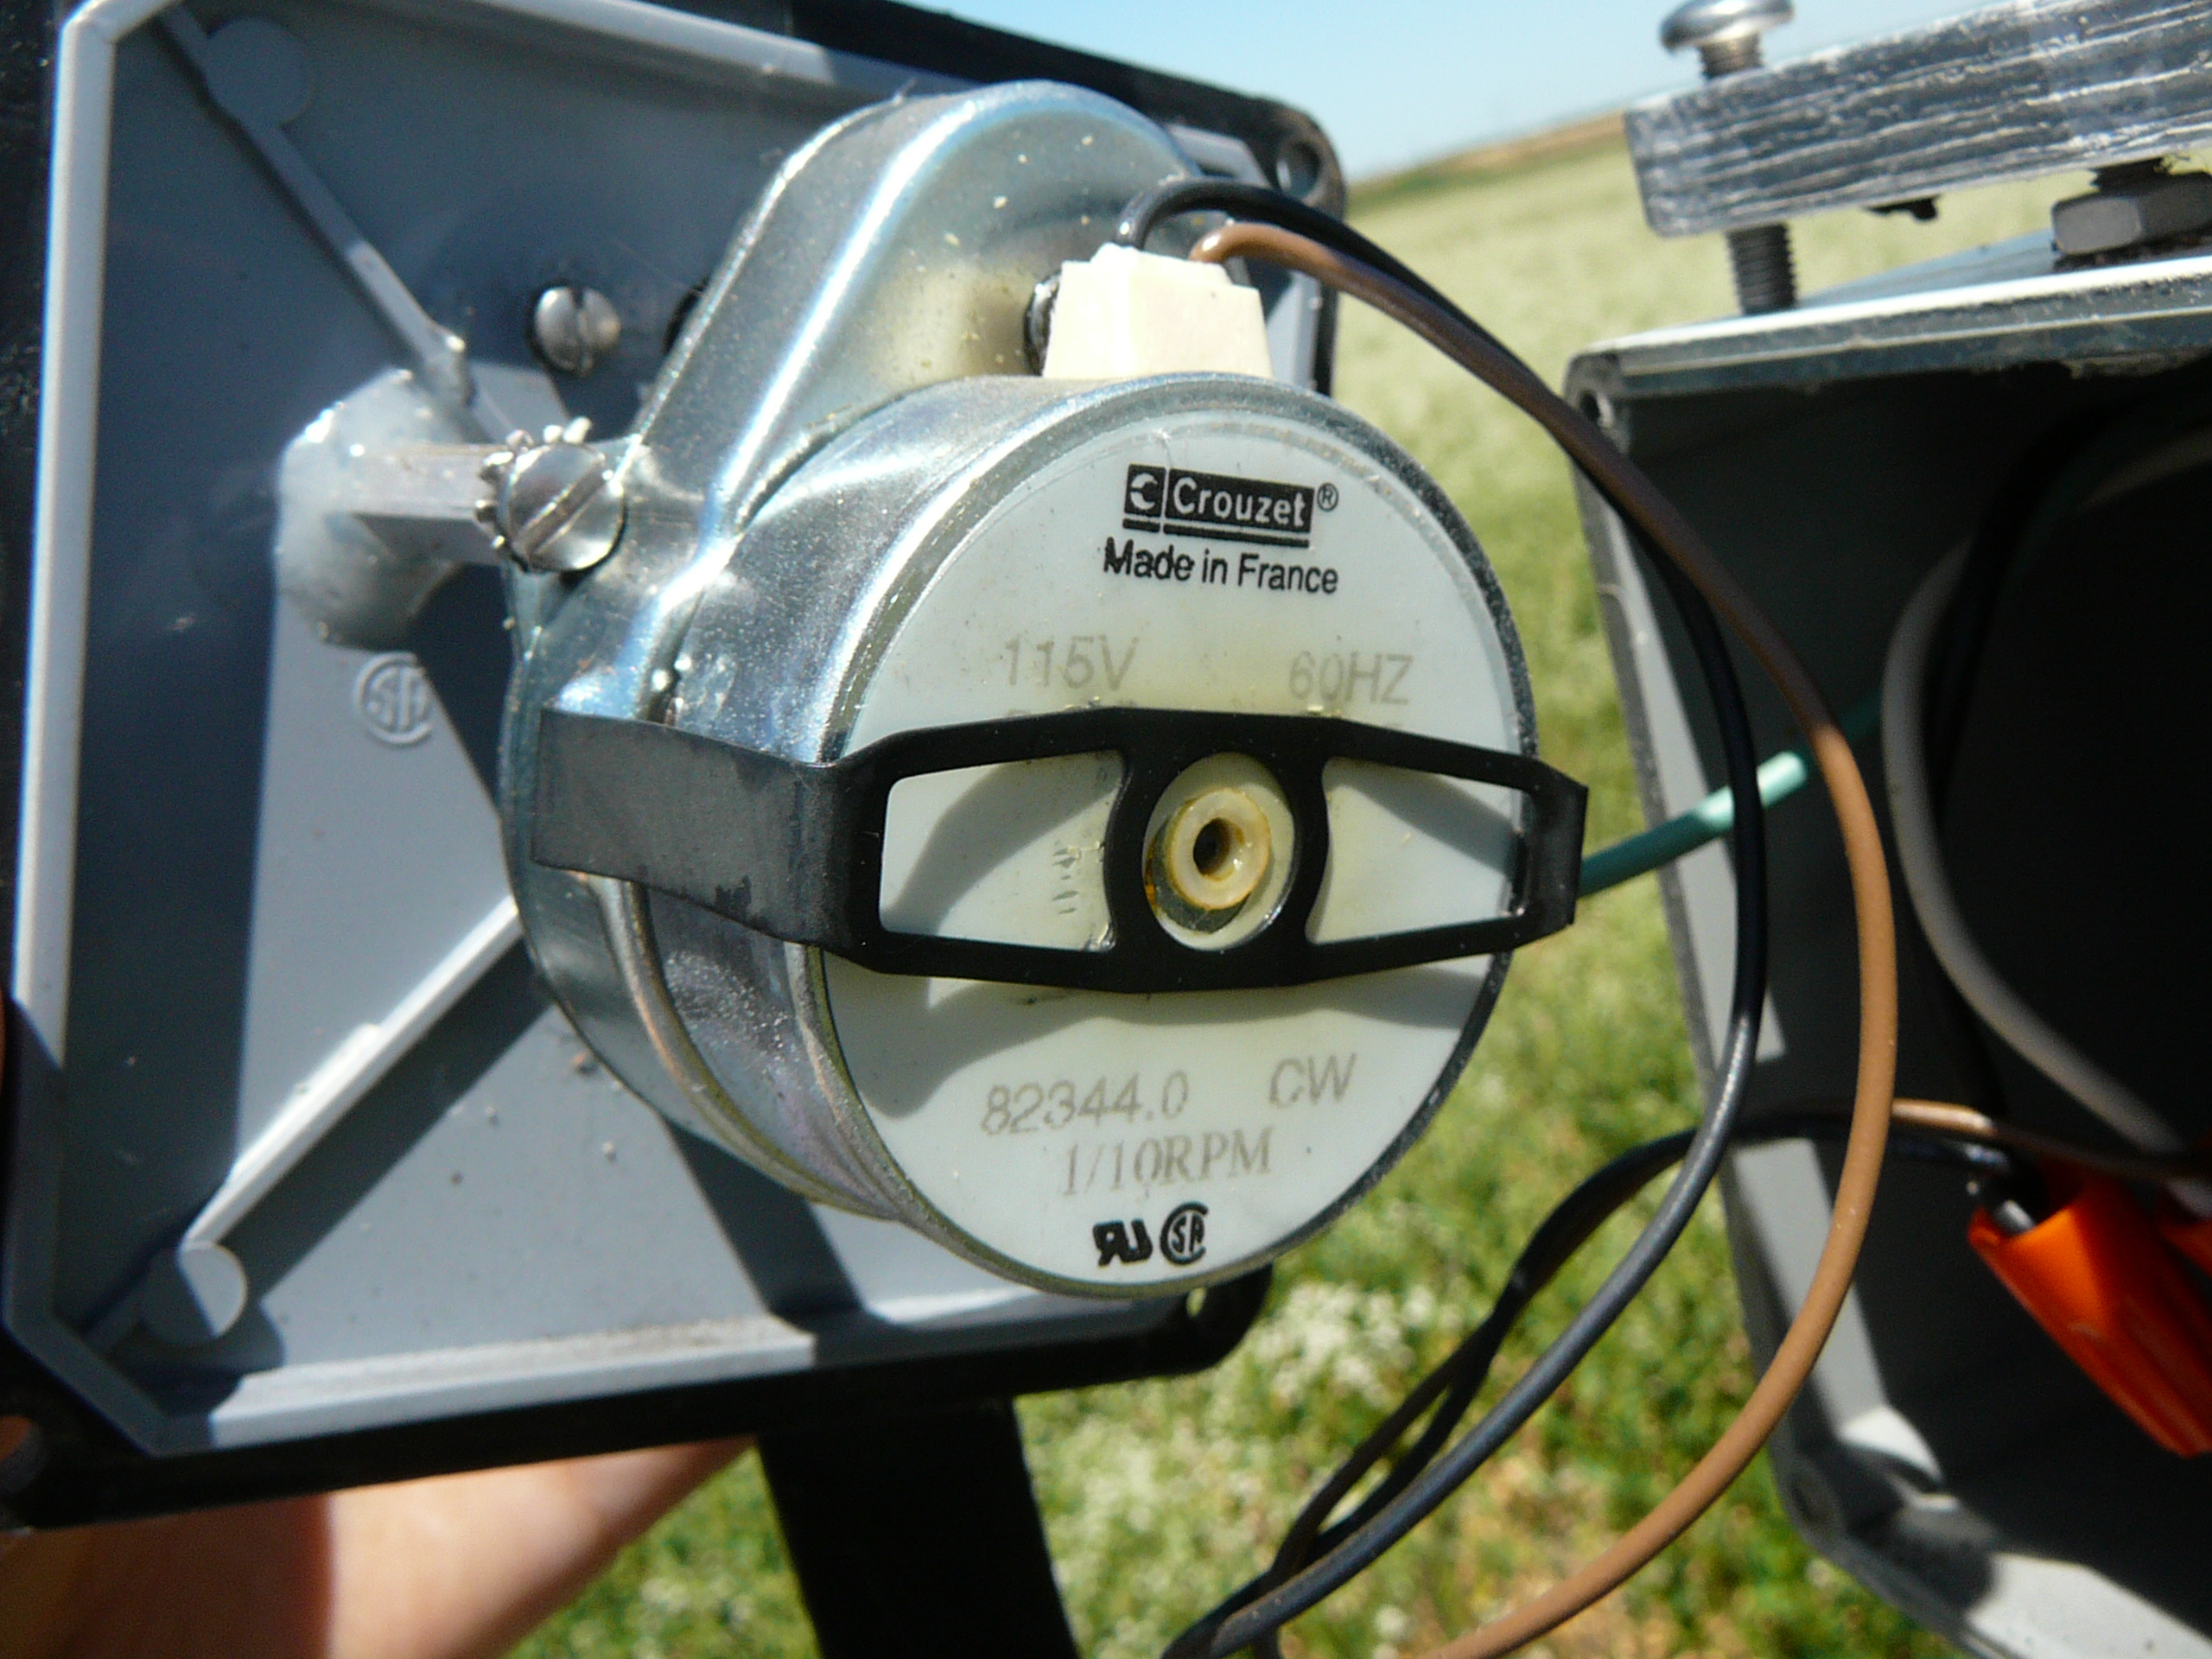
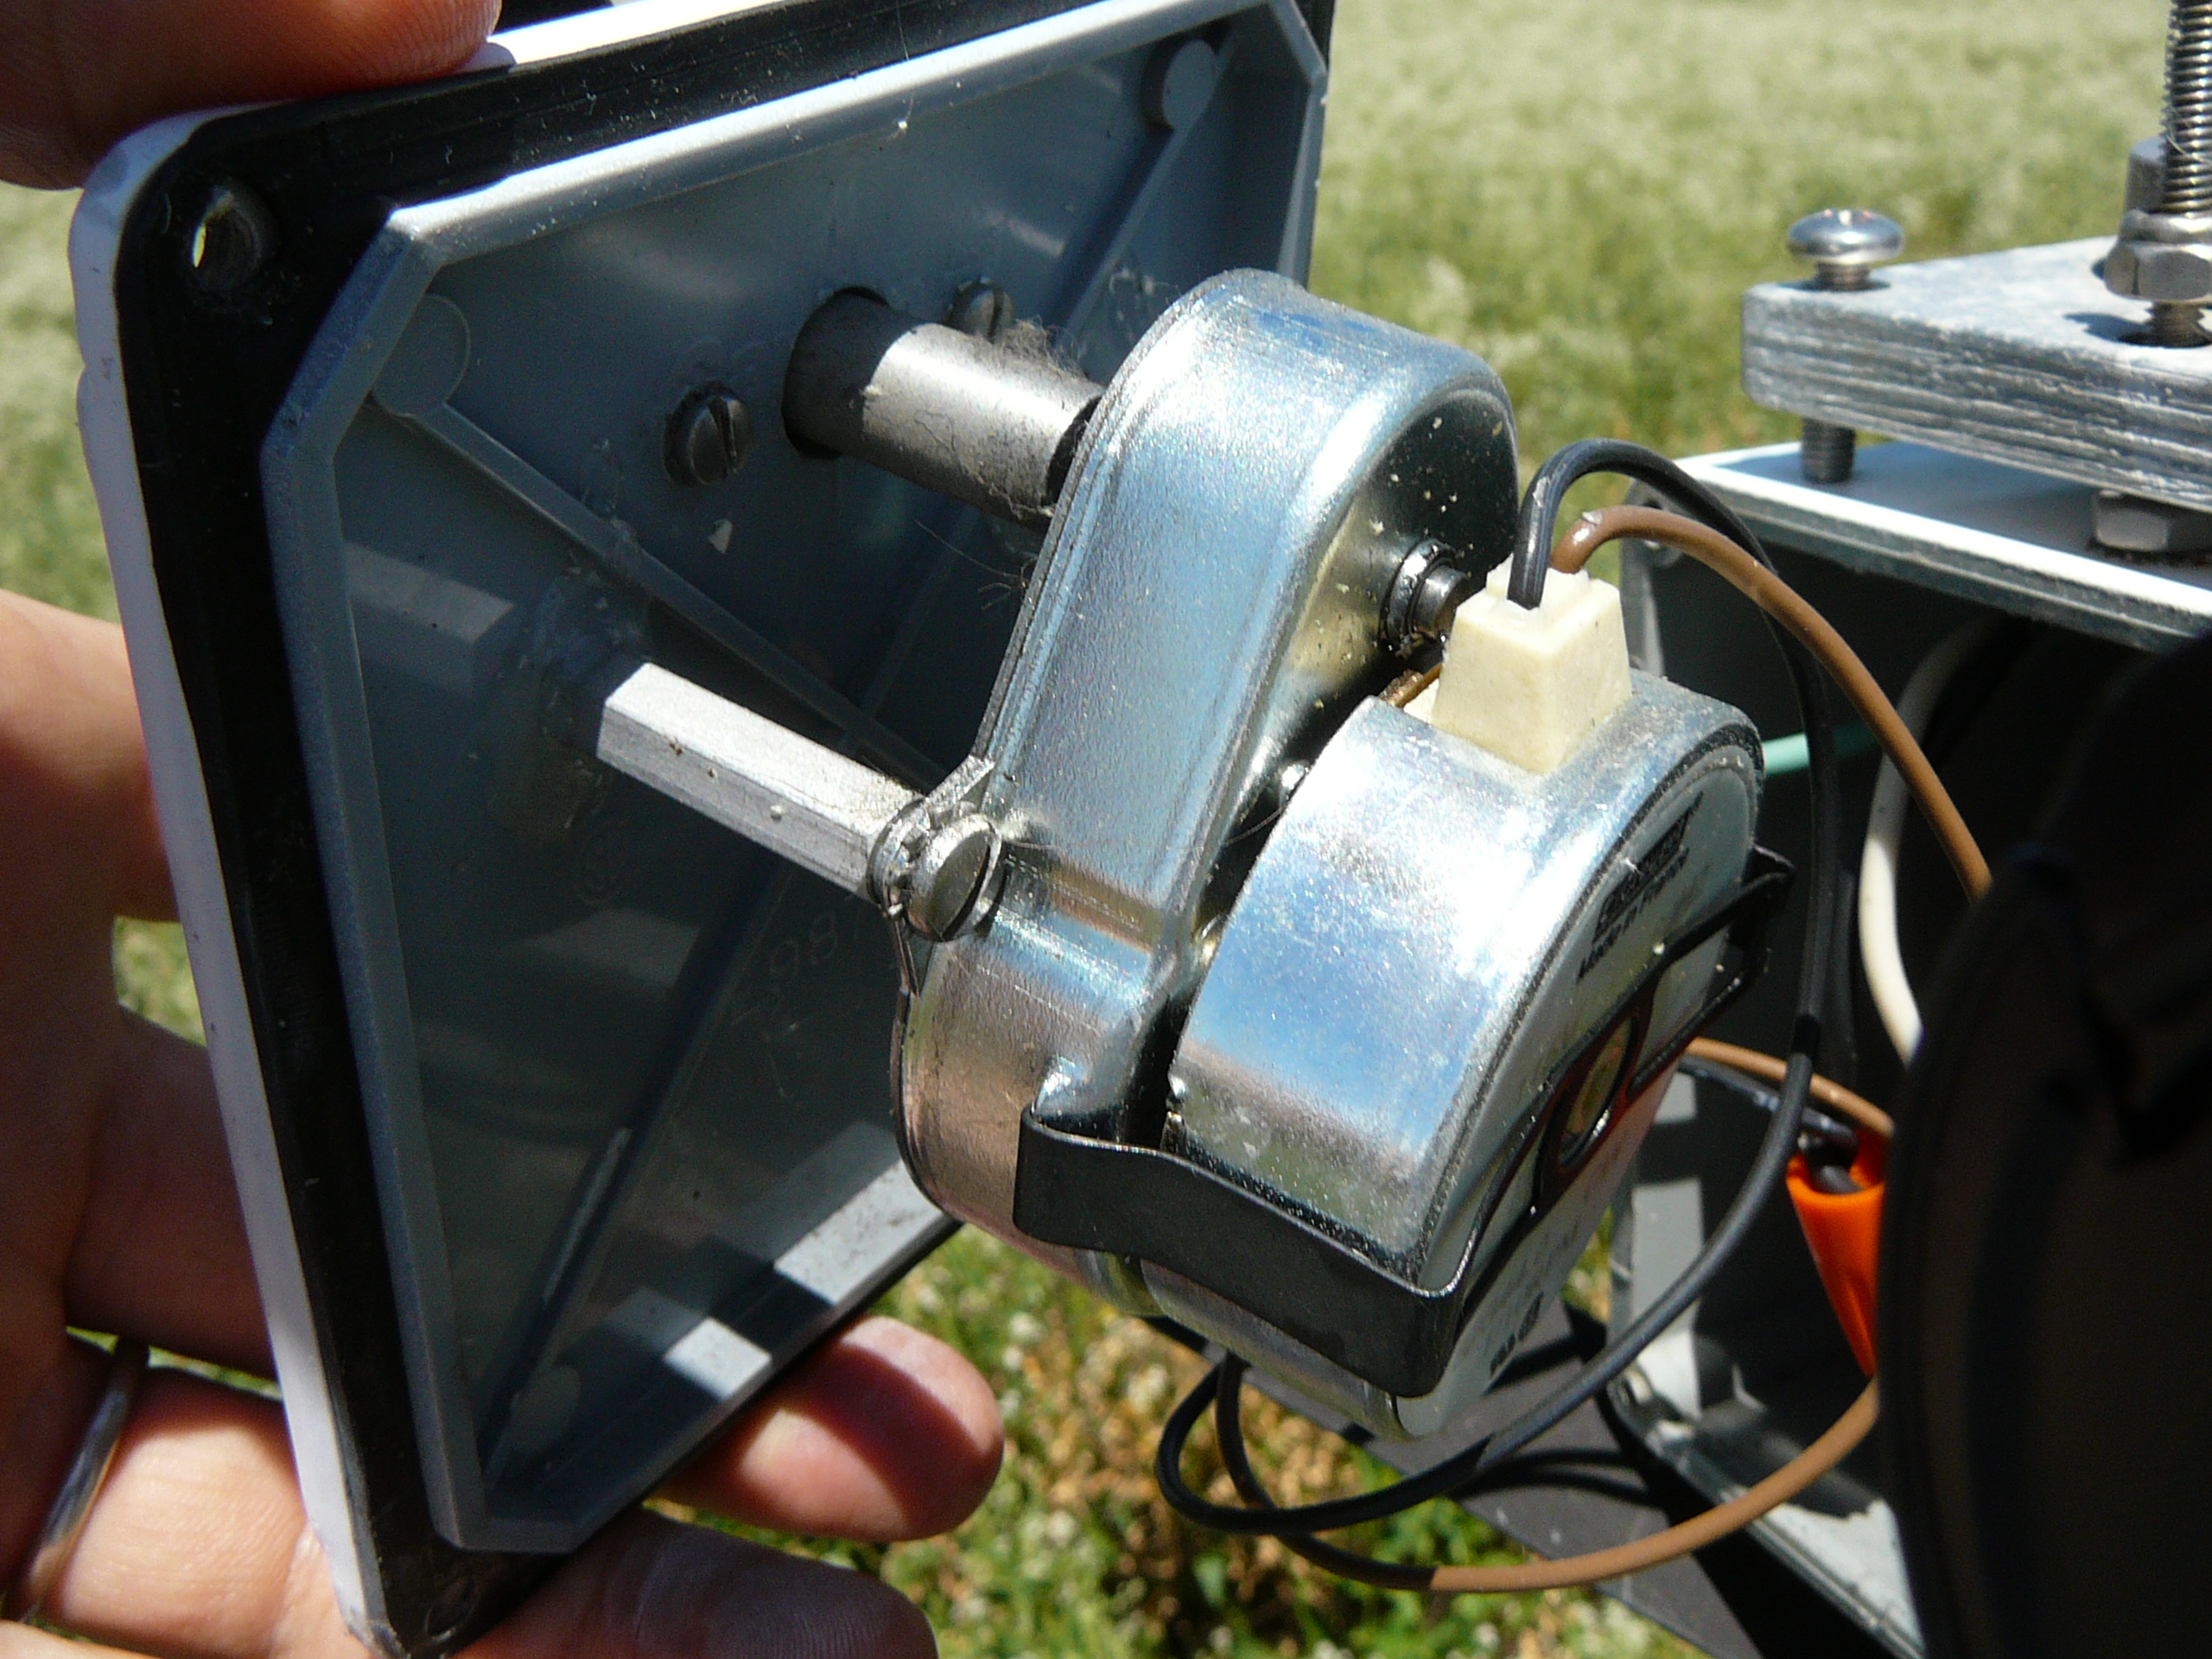
20110621SI_DiffusePARMotor.jpg ( 2011-06-21 10:38:49 ) Full size: 2560x1920
Diffuse PAR AC motor
20110621SI_FieldSouth.jpg ( 2011-06-21 10:21:57 ) Full size: 2560x1920
Pepper weed in full bloom with Mt Diablo
20110621SI_FieldWest.jpg ( 2011-06-21 10:21:51 ) Full size: 2560x1920
Pepper weed blooming
SI_webcam_20111721045.jpg ( 2011-06-21 10:45:04 ) Full size: 640x480
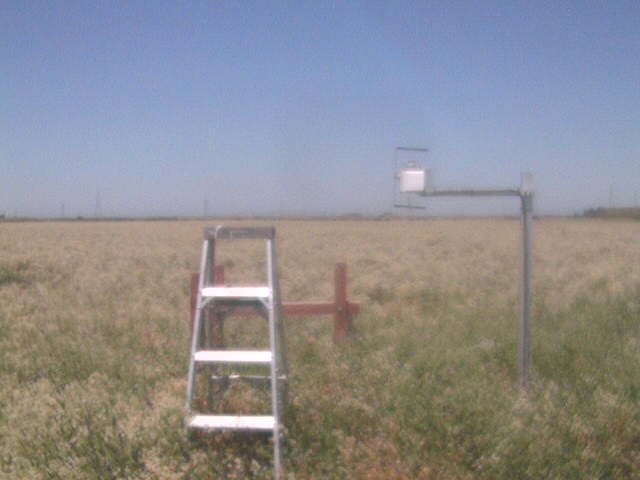
Ladder
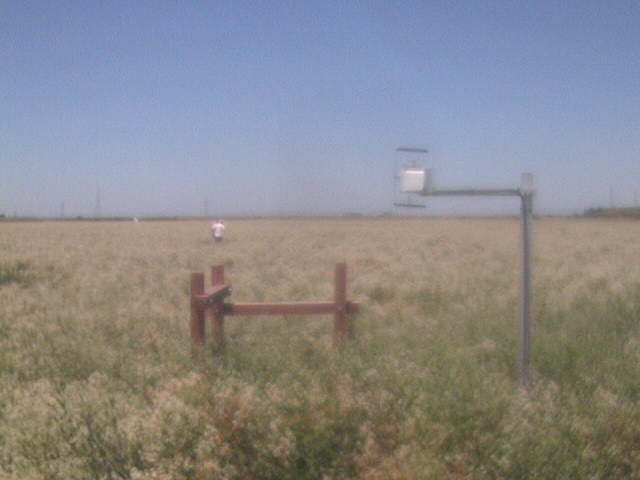
SI_webcam_20111721115.jpg ( 2011-06-21 11:15:04 ) Full size: 640x480
People in the field
SI_webcam_20111731715.jpg ( 2011-06-22 17:15:04 ) Full size: 640x480
Big bird on fence
7 sets found
No data found for SI_mp.
11 SI_met graphs found
Can't check SI_mixed
2 SI_mixed graphs found
5 SI_flx graphs found
No data found for SI_soilco2.
Can't check TWSI_mixed
Can't check SIMBTWEE_met