
Field Notes
<--2025-02-19 12:30:00 | 2025-03-25 08:30:00-->Other sites visited today: Mayberry | East End | Rush Ranch | Hill Slough | Bouldin Alfalfa | Gilbert Tract
Phenocam link: Searching...
Bouldin Corn: 2025-03-07 11:10:00 (DOY 66)
Author: Daphne Szutu
Others: Arman
Summary: Windy, field has been drained, unwired bad VWC, only 2 days of photos on card--needs more attention
| 2025-03-07 Bouldin Corn Arman and I arrived at 11:10 PST. It was cool, sunny, and much windier than the morning. The field has been drained. We should check in with Charlotte to see when they plan to mow/plant. We dropped off two pre-cut pieces of plywood for replacing the boardwalks at a later date. The lithium power pack still has 3 of 4 LED lights on. I downloaded met, cam, USB GHG, and PA data. Arman cleaned flux and rad sensors and topped off the wash reservoir. The laptop blew off of the enclosure at one point, but it fell down into a nice thick cushion of grass growing under the tower. Afterwards, I kept the laptop completely flat on the boardwalk. The water level was 67.5cm below the ground. (Top of well pipe to water level = 121cm, (Previous visit measured) top of well pipe to ground = 53.5cm) The 7500 read: 427 ppm CO2, 380 mmol/m3 H2O, 15.8 deg.C, 101.9 kPa, 79 SS --> 99 after cleaning The 7700 read: 2.05 ppm CH4, 57 RSSI --> 81 after cleaning I spent some time troubleshooting the three Campbell VWC sensors: VWC_3, VWC_8, and VWC_9 which are named after the last digit of the serial number. I tested them one at a time by plugging in their power on the right side of the power strip, but none of them seemed to work. Plugging in any of the 3 sensors would also cause the dfPAR and NDVI values to become NAN—these three types of sensors all share one control port. Then I tested the VWC sensors one at a time on the left side of the power strip. I got data from VWC_8 and VWC_9, so I connected both of those to the left side of the power strip and confirmed that dfPAR and NDVI were both working. Lots of sensors are doubled up on the power strip, so we should try a new power strip here. I left VWC_3 unplugged. The VWC sensors are programmed to turn on every 10 minutes, warm-up for 1 minute, then read data. To speed up troubleshooting, I kept jiggering the laptop clock to 11:19, synching the datalogger clock to the laptop clock, and then waiting for data to refresh around the datalogger’s 11:21. At the end of troubleshooting, I set the laptop clock with my cellphone clock and synched the datalogger to the laptop clock one last time. For the future, Joe suggested writing a quick program that just reads the VWC sensors frequently for troubleshooting. Then when I’m done troubleshooting, I can just upload the original program back on and don’t have to worry about setting the clock multiple times. Future equipment/program changes: -Remove VWC_3 -Remove Theta probe -Remove PRI sensors from boom (already unwired) We left at 12:10 PST. Looking at the data back in the lab, there are only 2 days of camera photos, which is too bad since we can’t track when the field started draining. We could probably see it from Charlotte’s data though. At the next site visit, if camera-datalogger connection looks fine, might be time to reformat the CF card. |
1 photos found
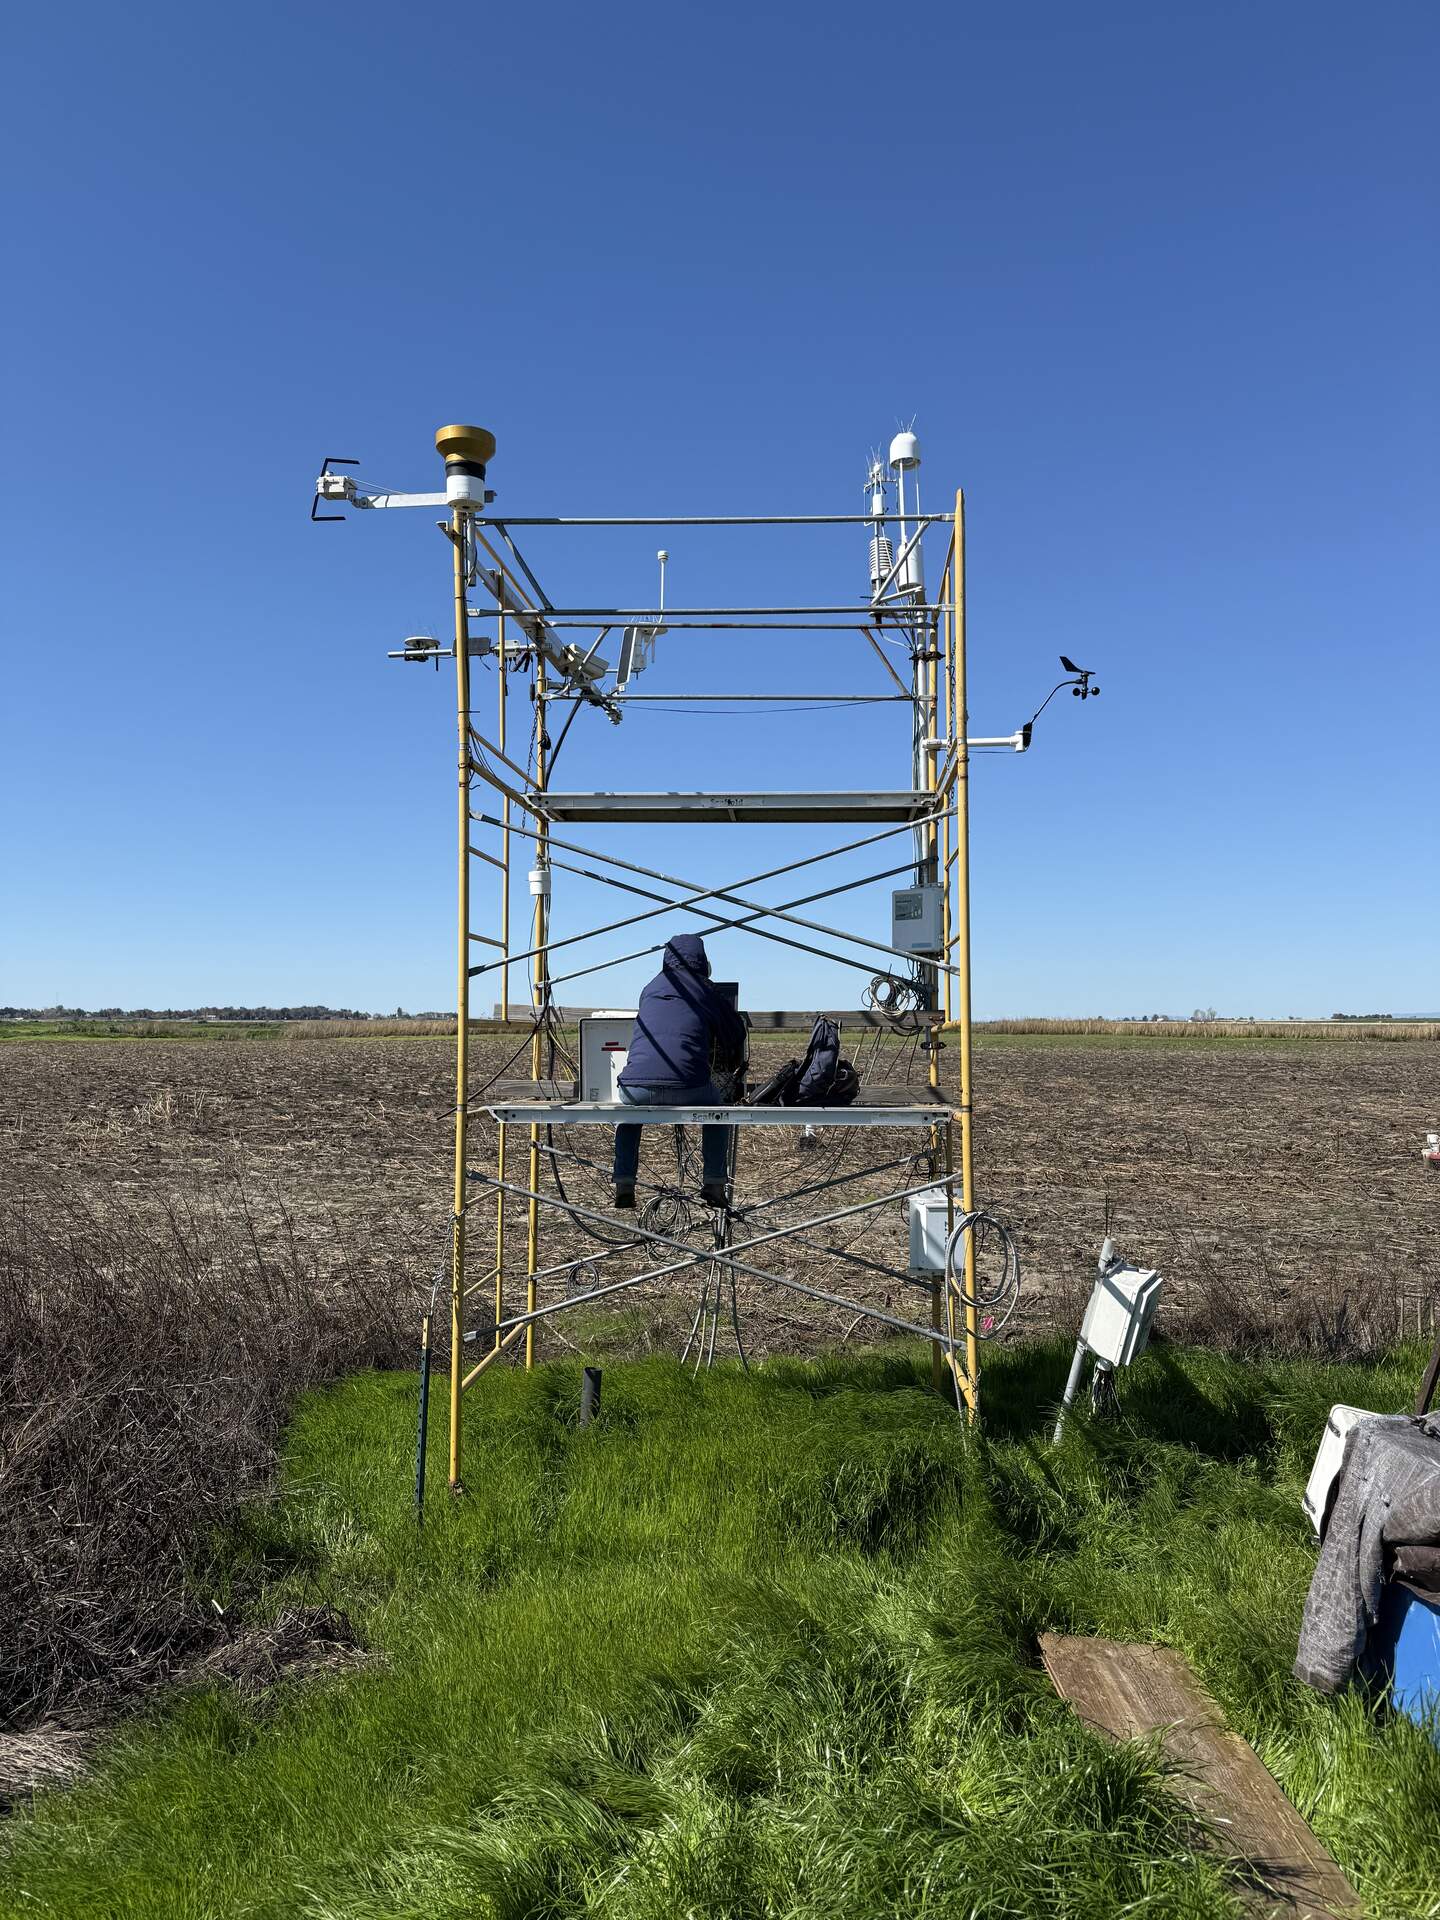
20250307BC_DaphneTower.jpg ( 2025-03-07 11:20:43 ) Full size: 1440x1920
Daphne working on the tower on a windy day
6 sets found
17 BC_met graphs found
5 BC_flux graphs found
Can't check TATWBABCSB_cam
Can't check MBSWEEWPBCBA
2 BC_pa graphs found
1 BC_arable graphs found