
Field Notes
<--2025-02-19 14:10:00 | 2025-03-20 08:10:00-->Other sites visited today: Mayberry | East End | Rush Ranch | Hill Slough | Bouldin Corn | Gilbert Tract
Phenocam link: Searching...
Bouldin Alfalfa: 2025-03-07 12:35:00 (DOY 66)
Author: Daphne Szutu
Others: Arman
Summary: Taller wheat, downloaded LI-720 data
| 2025-03-07 Bouldin Alfalfa Arman and I arrived at 12:35 PST. It was sunny, clear, and windy. We parked off of the field and walked along the edge of the field to the tower. The wheat is knee-to-thigh high but thankfully not too wet and the ground was relatively firm. Some of the leaves have yellow speckles; maybe they sprayed with something. I wonder when they will harvest this wheat. The internet says May. Arman cleaned flux and rad sensors and noticed the bottom window of the LI-720 was dirty with bird poop. He cleaned it off and maybe we can add some bird spikes to the top horizontal bar (without shading the PAR sensor). I downloaded met, cam, USB GHG, and zcam data. I changed the eddy clock +3:15min from 12:43:30 to 12:46:45 to match the laptop clock (confirmed with my cellphone clock). I restarted logging afterwards. I also downloaded the LI-720 data: I moved all files from the microSD card to my laptop and downloaded two tables from the CR6 that seemed most relevant. Arman took spectral and veg height measurements. 7500 read: 407 ppm CO2, 238 mmol/m3 H2O, 16.9 deg.C, 101.9 kPa, 91 SS – 97 after cleaning We left at 13:00 PST. I noticed from the phenocam photos that the LI-720 is getting shaded in the early morning by our scaffolding. |
Next Mowing: 2025-05-02
Veg Height (cm): Tape measure from ground to top of plant - Wheat
81, 78, 72, 81, 73, 88, 75, 88, 73, 83, avg = 79.2, stdev = 6
1 photos found
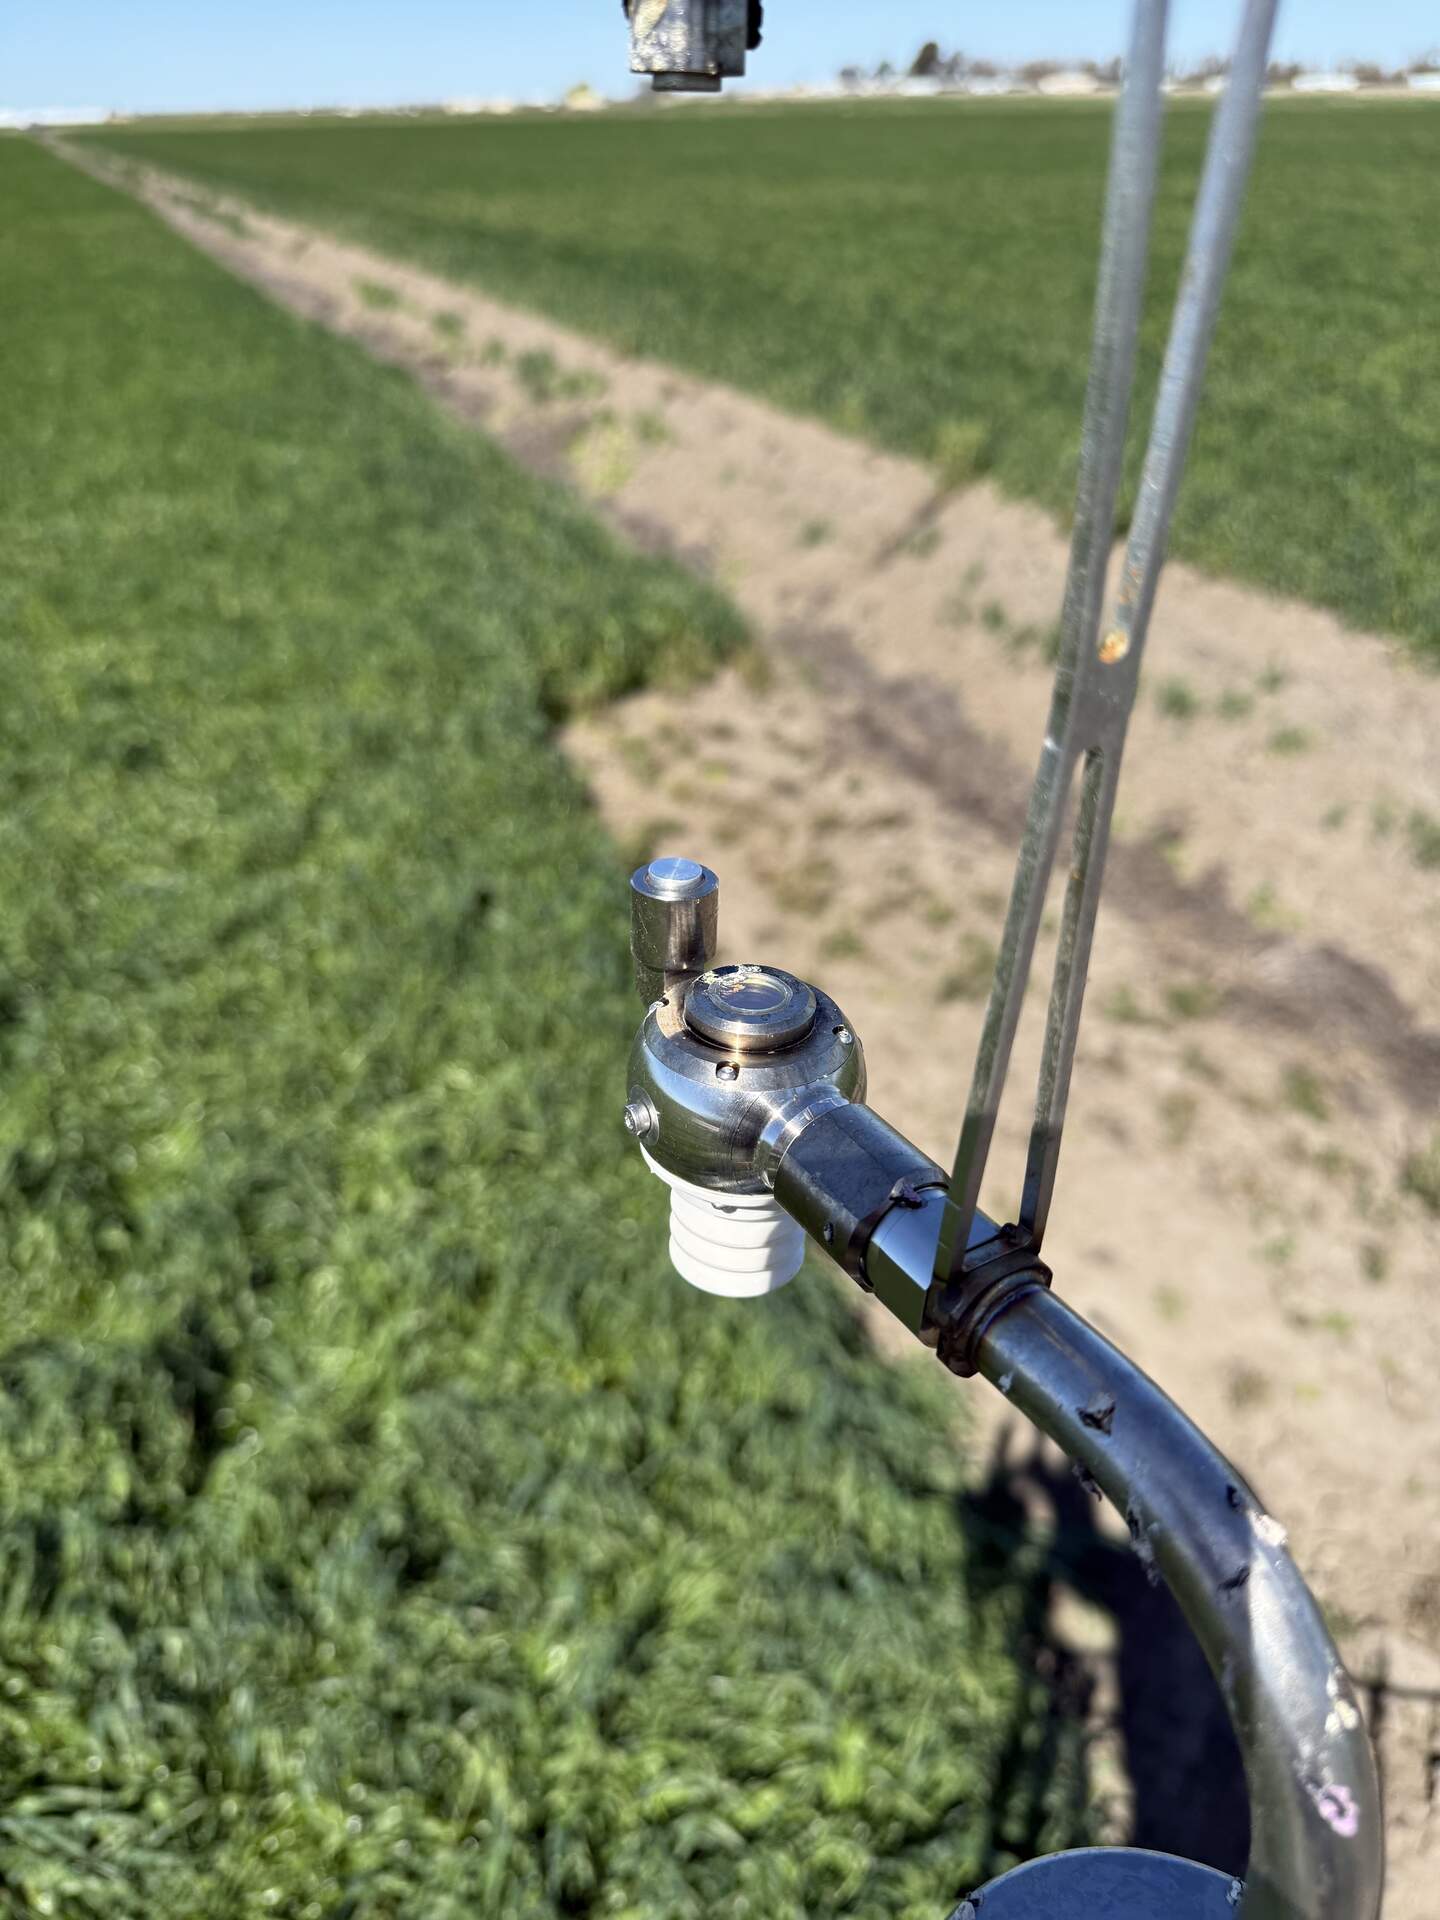
20250307BA_720BirdPoop.jpg ( 2025-03-07 12:55:50 ) Full size: 1440x1920
Bird poop on the structure and window of the LI-720
7 sets found
4 BA_flux graphs found
21 BA_met graphs found
6 BA_arable graphs found
Can't check TATWBABCSB_cam
Can't check MBSWEEWPBCBA
No data found for BA_processed.
No data found for BA_adex.