
Field Notes
<--2024-06-12 08:50:00 | 2024-06-25 09:50:00-->Phenocam link: Searching...
Hill Slough: 2024-06-24 12:00:00 (DOY 176)
Author: Daphne Szutu
Others: Jess Turner
Summary: CRAM assessment
| 2024-06-24 Hill Slough Jess Turner and her two crew members were on site (probably in the afternoon) to do the CRAM assessment at Hill Slough. CRAM = California Rapid Assessment Method, a standardized field methodology for assessing the ecological functioning of wetlands. Jess is with the Central Coast Wetlands Group at Moss Landing Marine Labs and the CRAM work will be part of her M.S. project at CSUMB looking at wetlands conditions and carbon burial rates. |
12 photos found

20240625HS_KoongRobert.jpg ( 2024-06-25 00:00:00 ) Full size: 1440x1920
Koong and Robert dragging soil coring equipment across the wetland. Taken between HSM_6 and HSM_4, and the water level got that low in that area during spring tide, even though it is close to the levees.
20240625HS_RobertGps.jpg ( 2024-06-25 00:00:00 ) Full size: 1382x1842
Robert taking GPS points in the mud pit
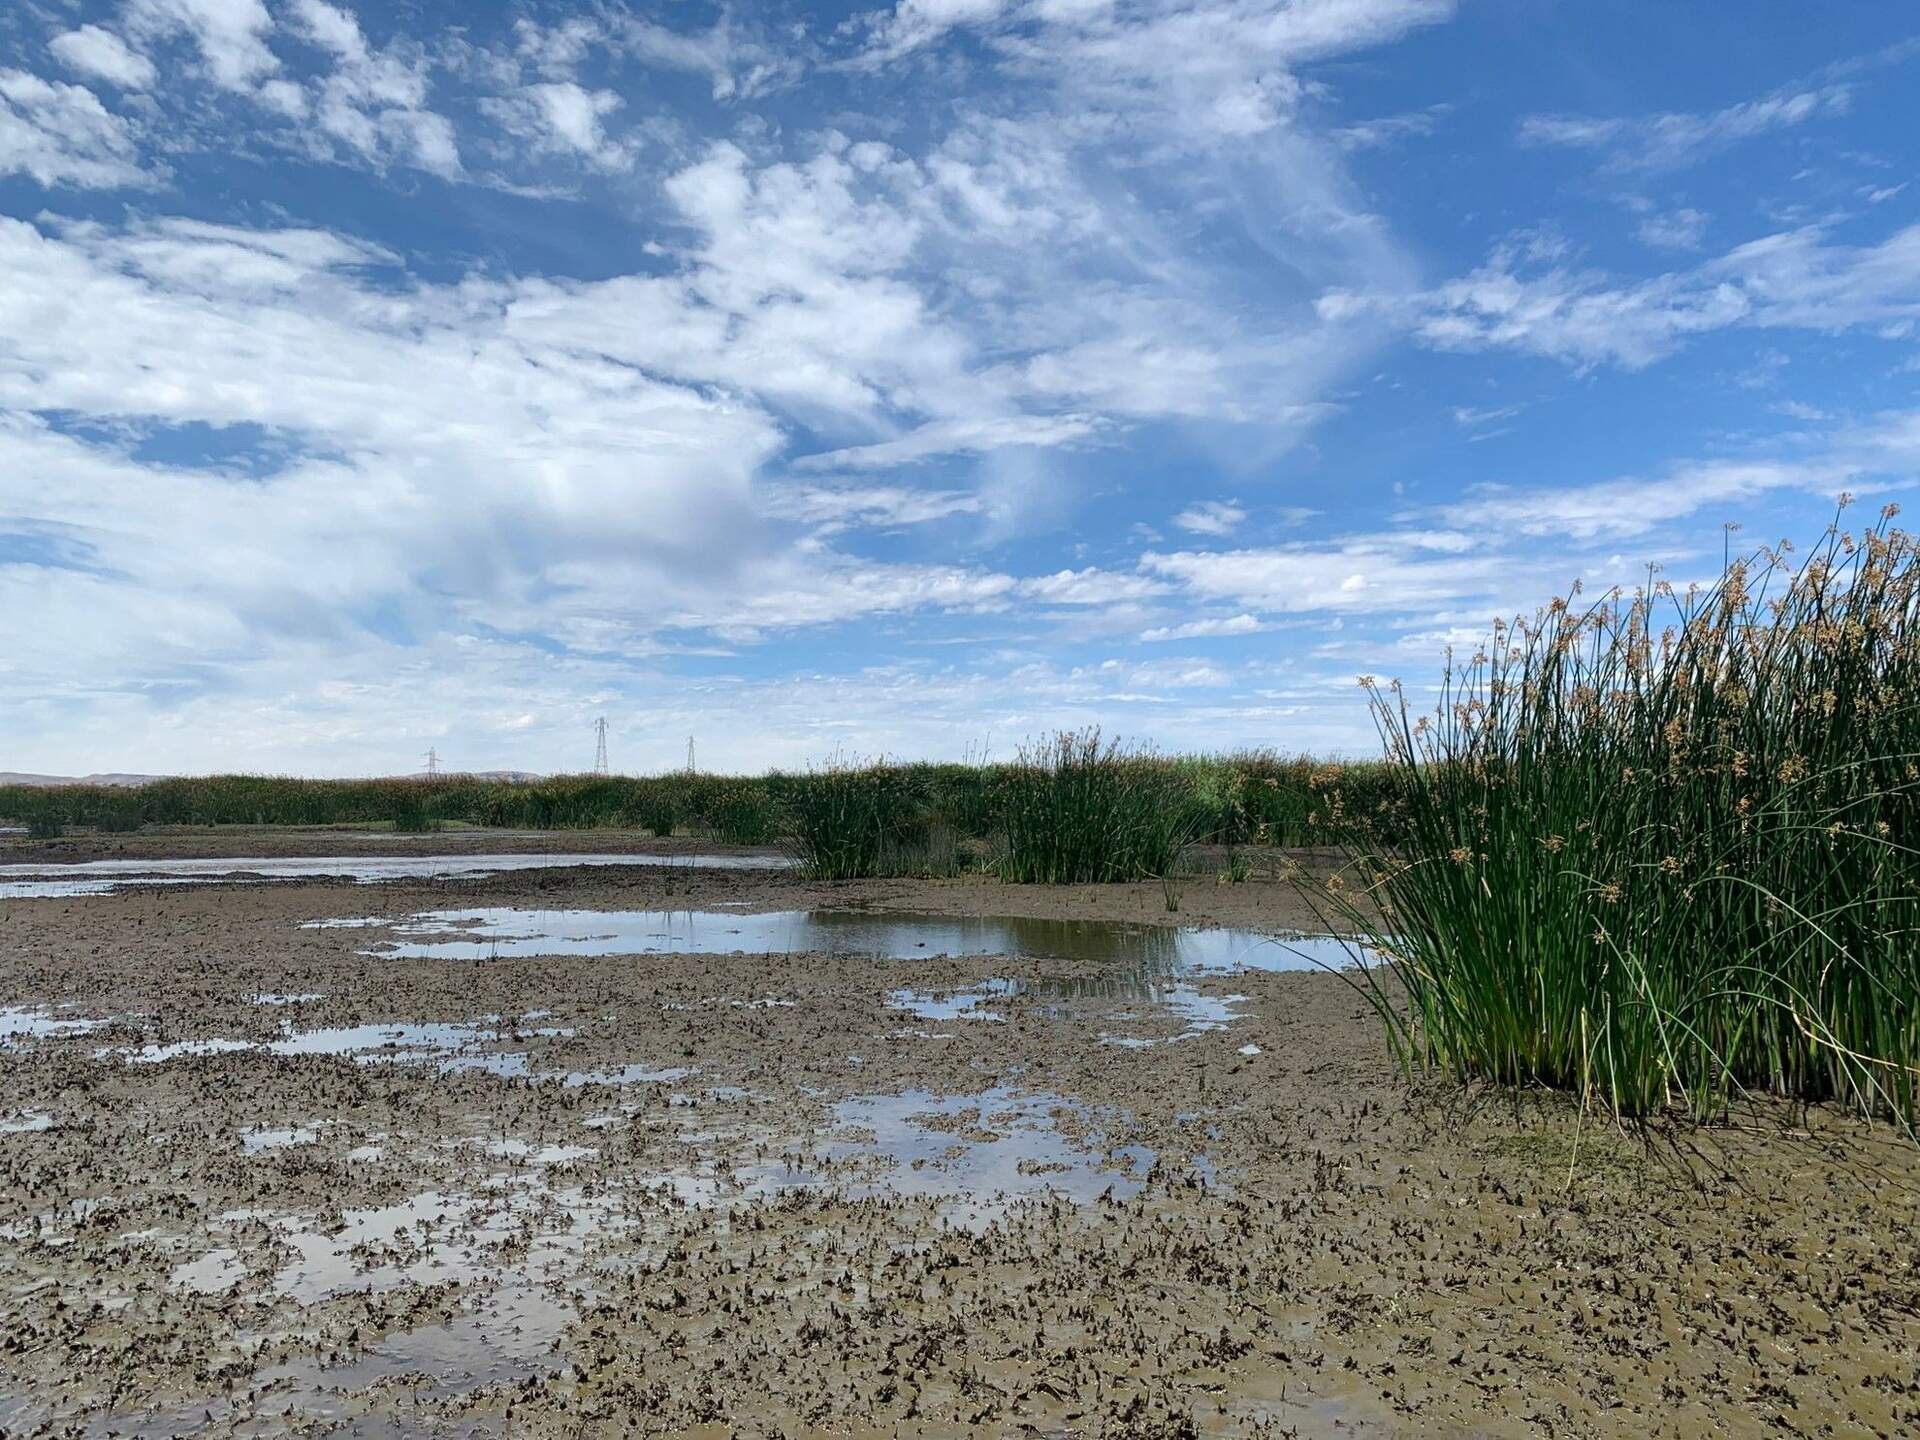
20240625HS_Tules.jpg ( 2024-06-25 00:00:00 ) Full size: 1920x1440
Tules establishing in the wetland
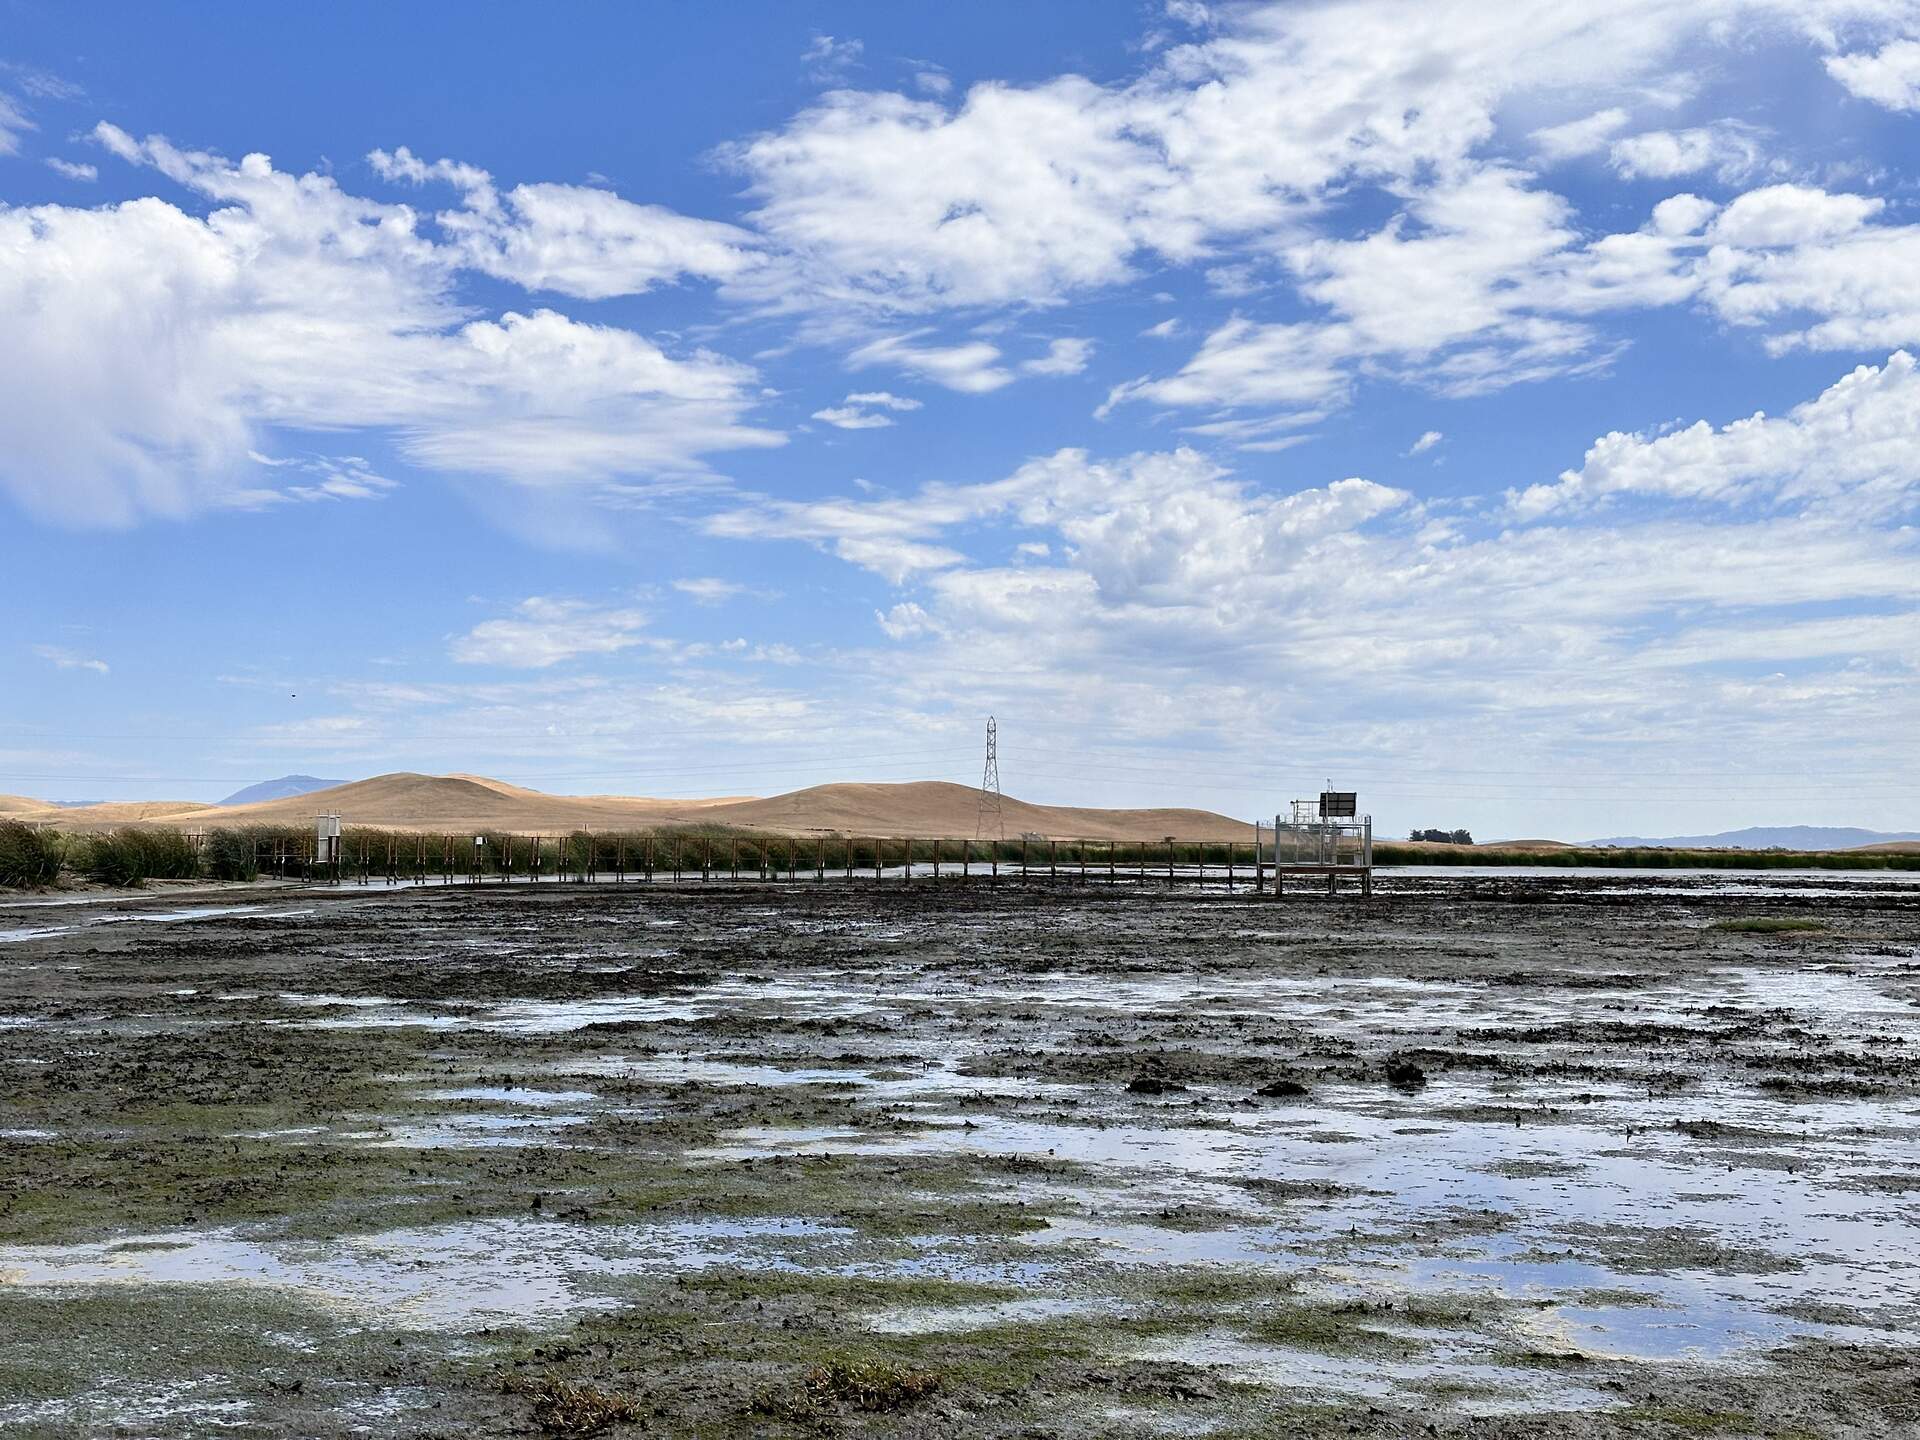
20240625HS_Boardwalk.jpg ( 2024-06-25 14:47:07 ) Full size: 1920x1440
The boardwalk and tower at low tide
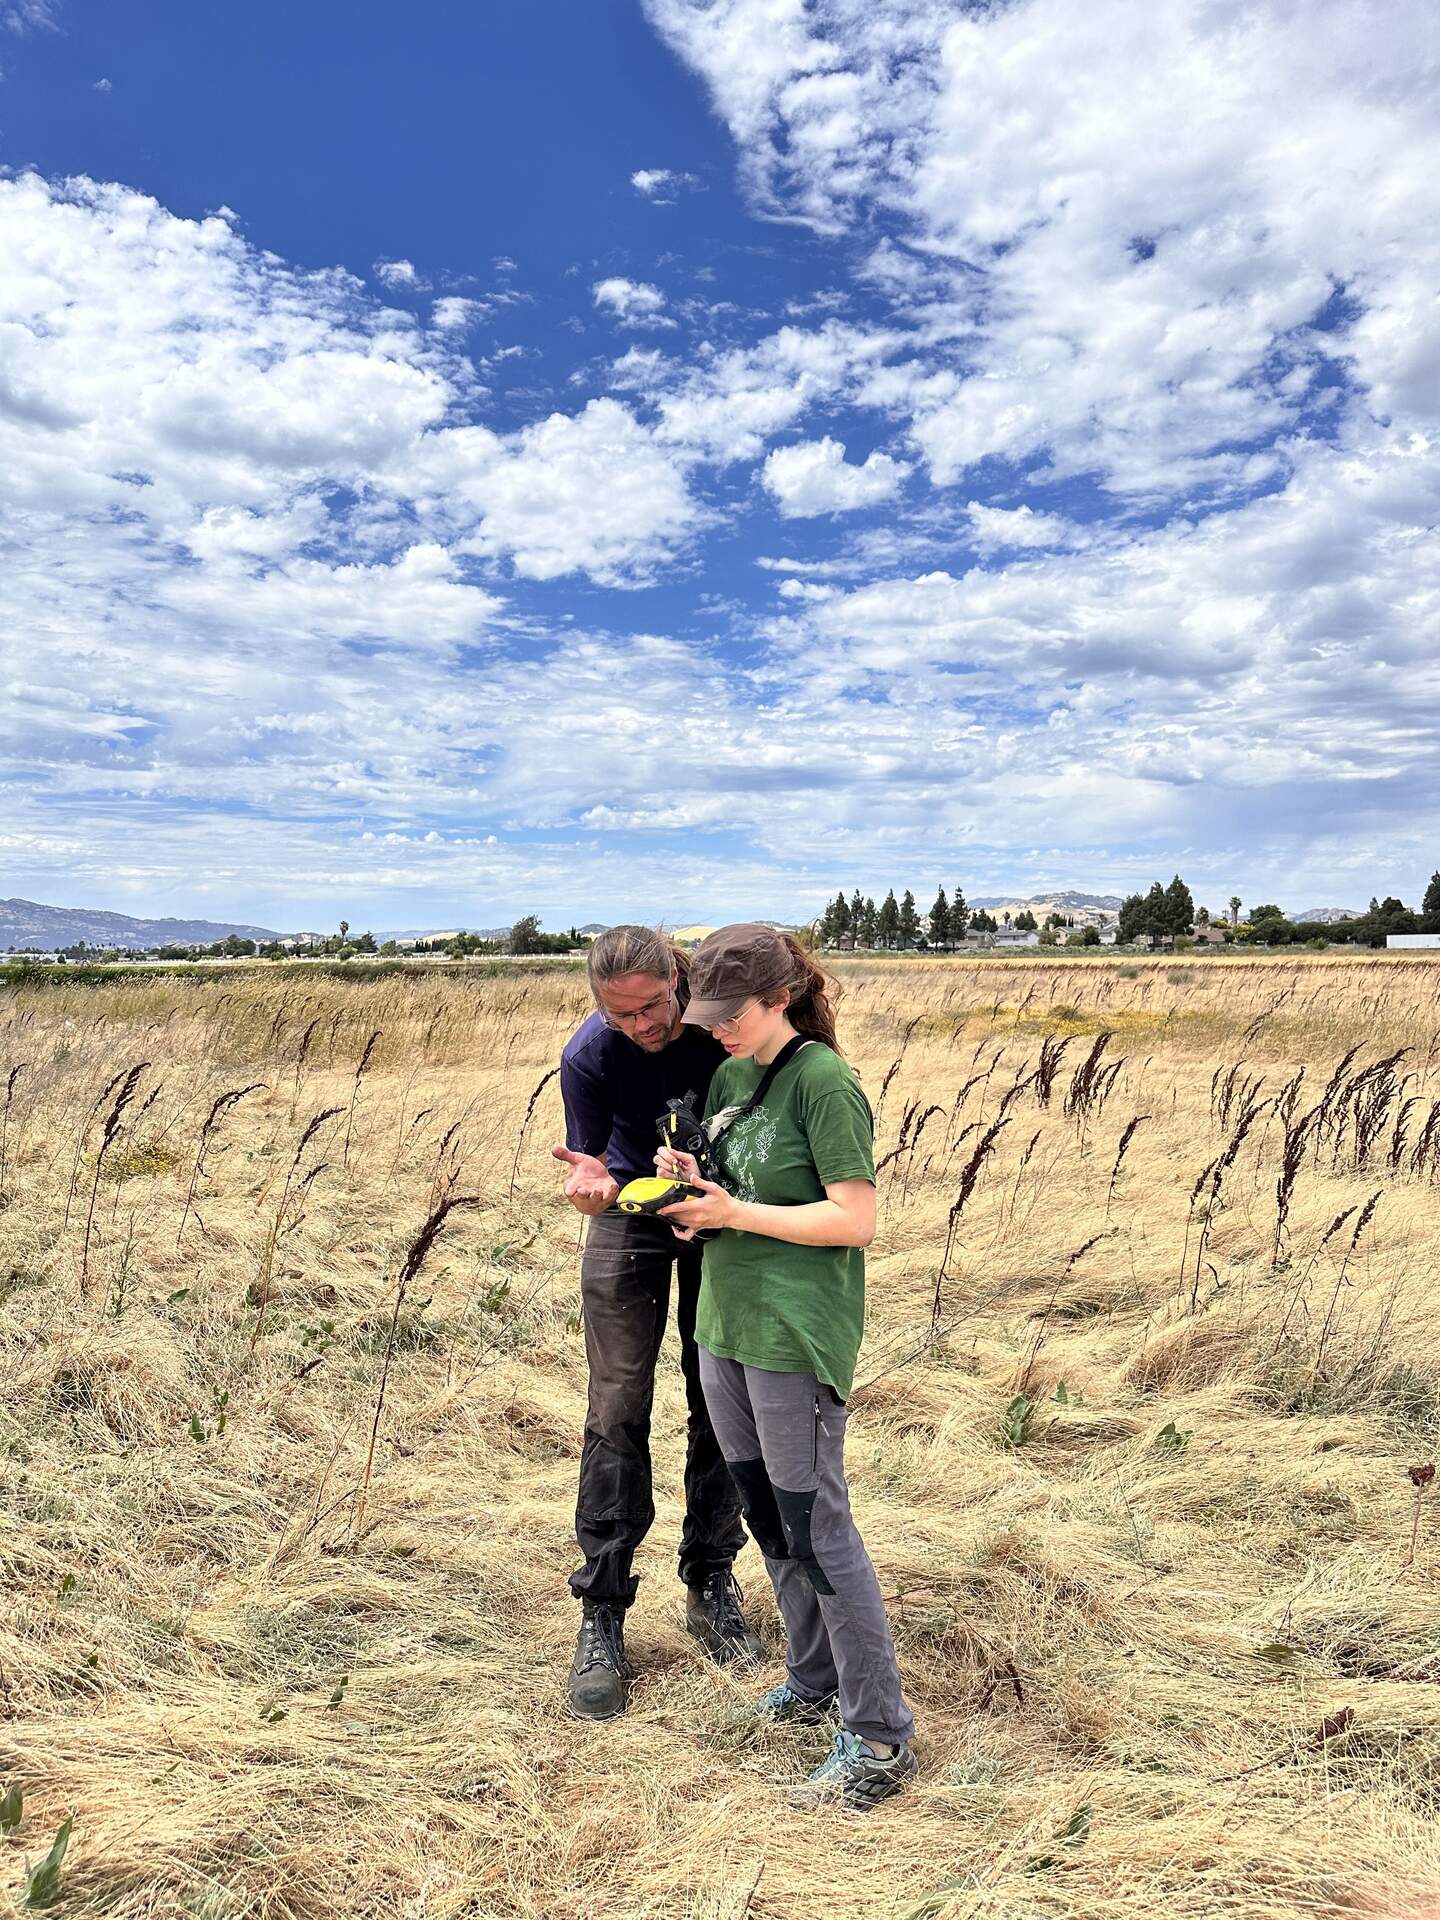
20240625HS_GpsTrouble.jpg ( 2024-06-25 14:30:38 ) Full size: 1440x1920
Robert and Irene troubleshooting the GPS at HSM_9.
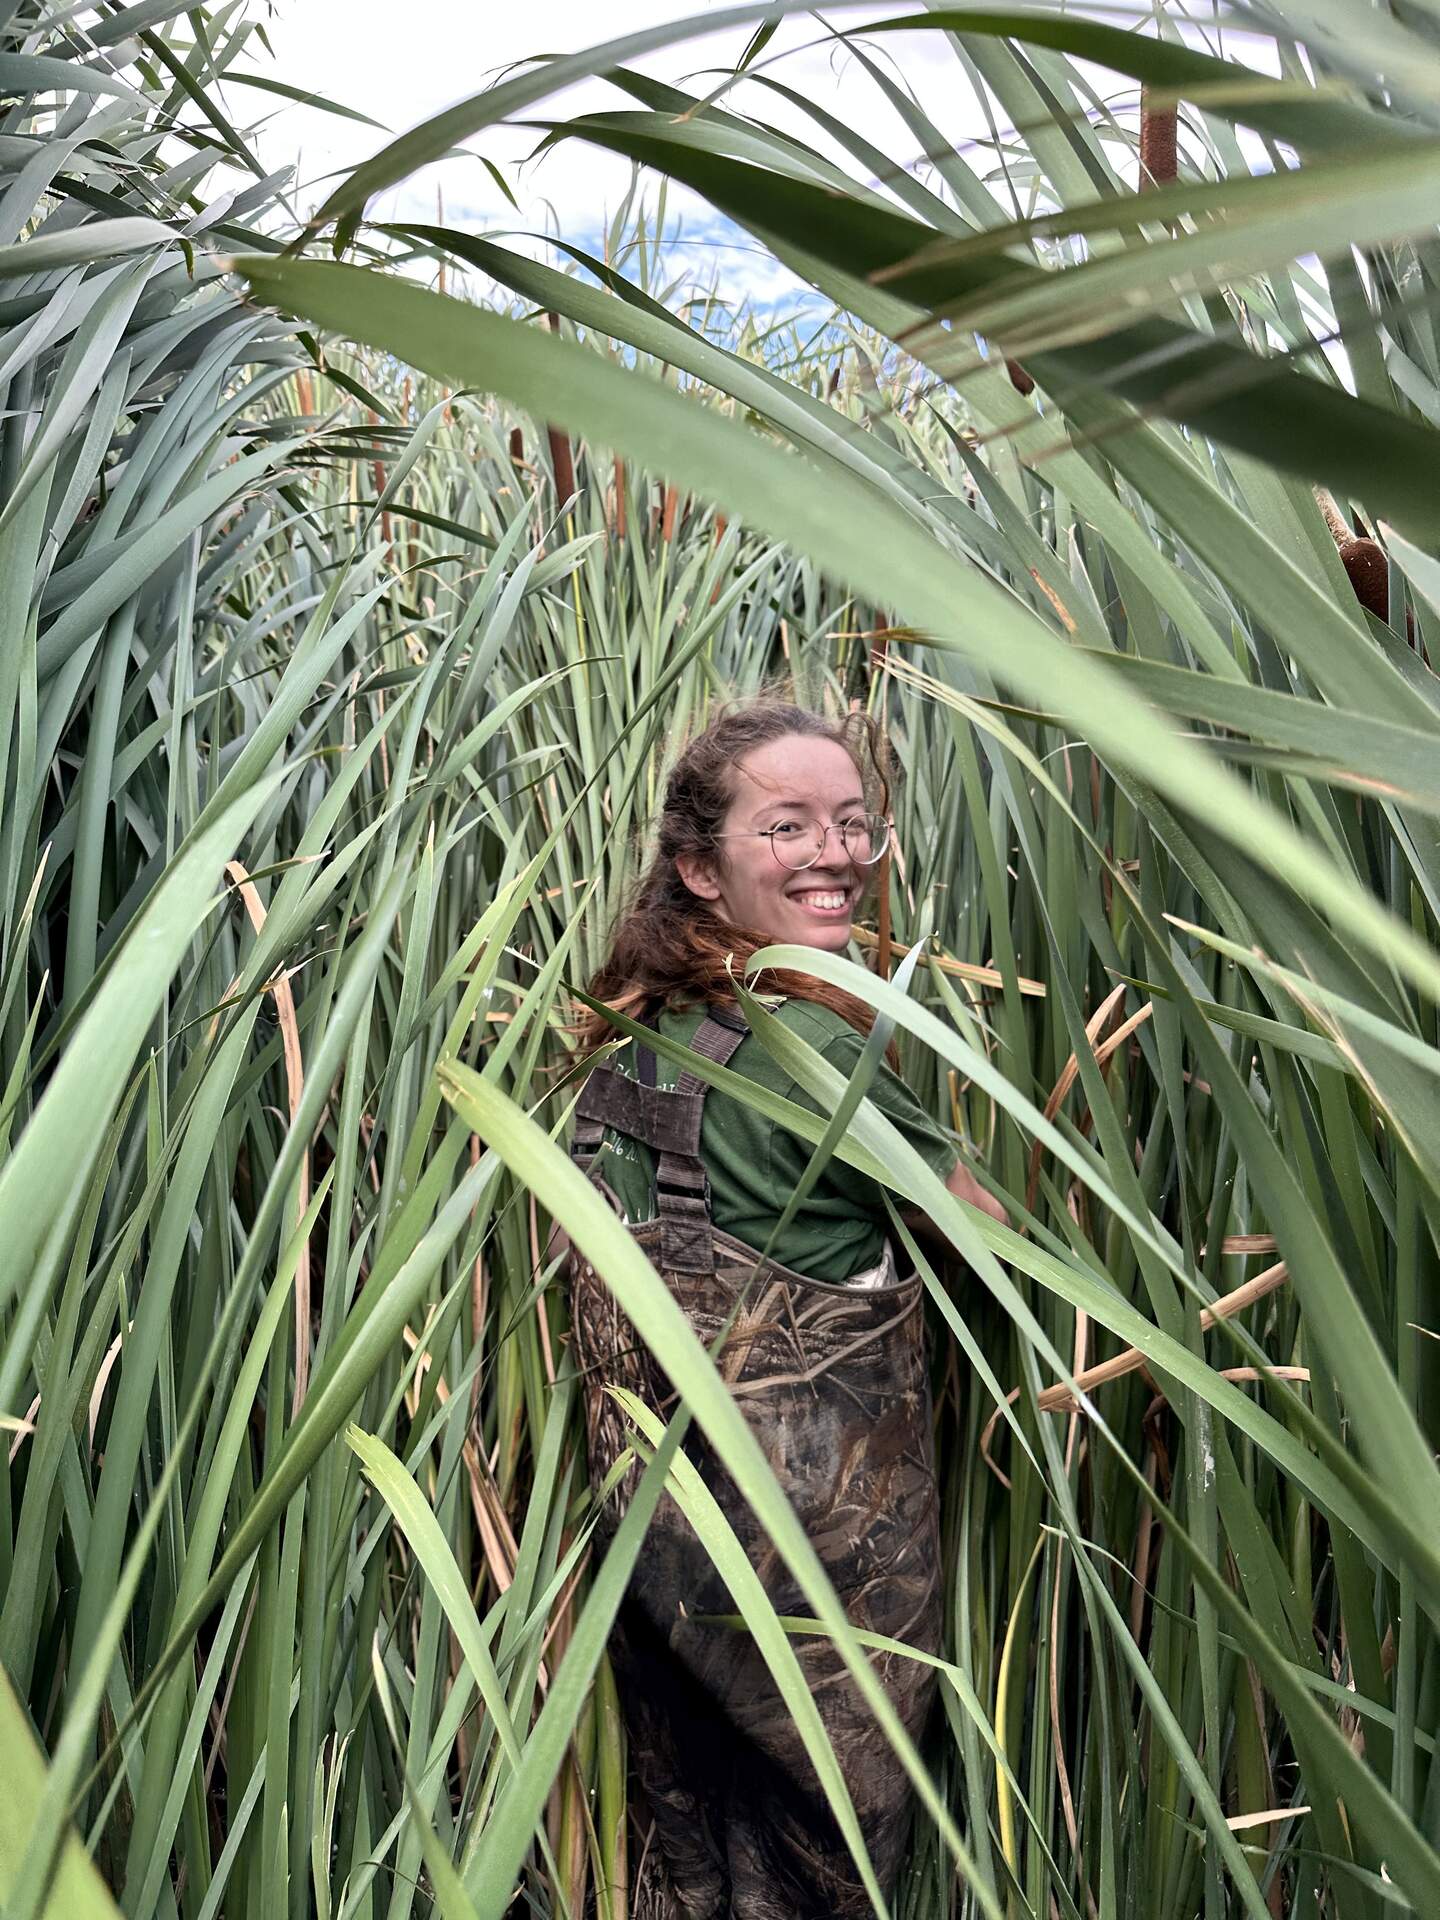
20240625HS_Irene.jpg ( 2024-06-25 14:49:54 ) Full size: 1440x1920
Irene among the cattails. We are trying to relocate HSM_8 to take its GPS point.
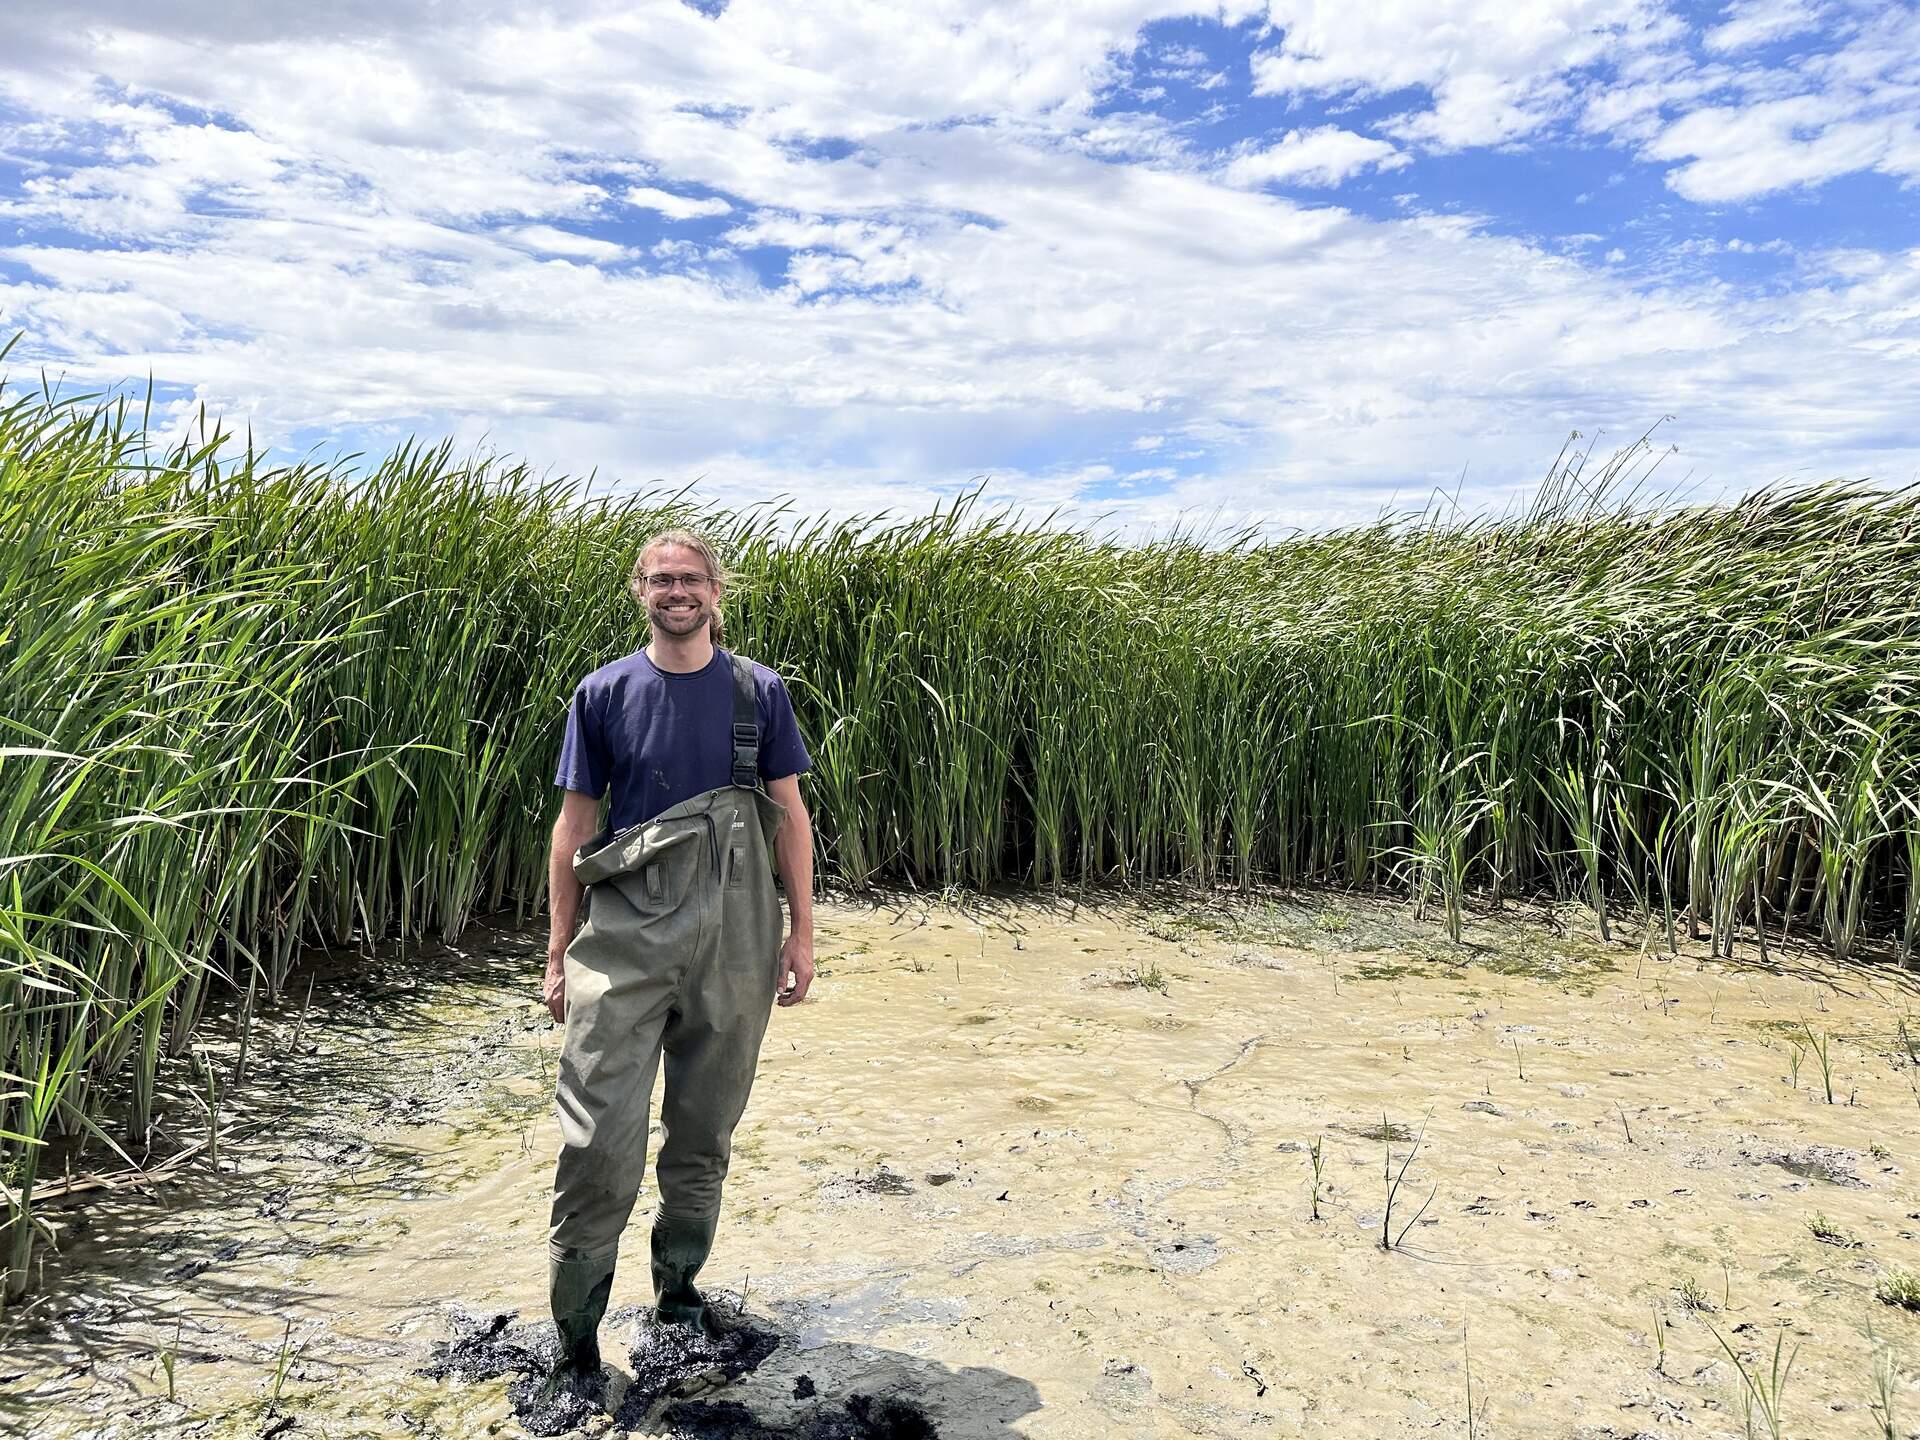
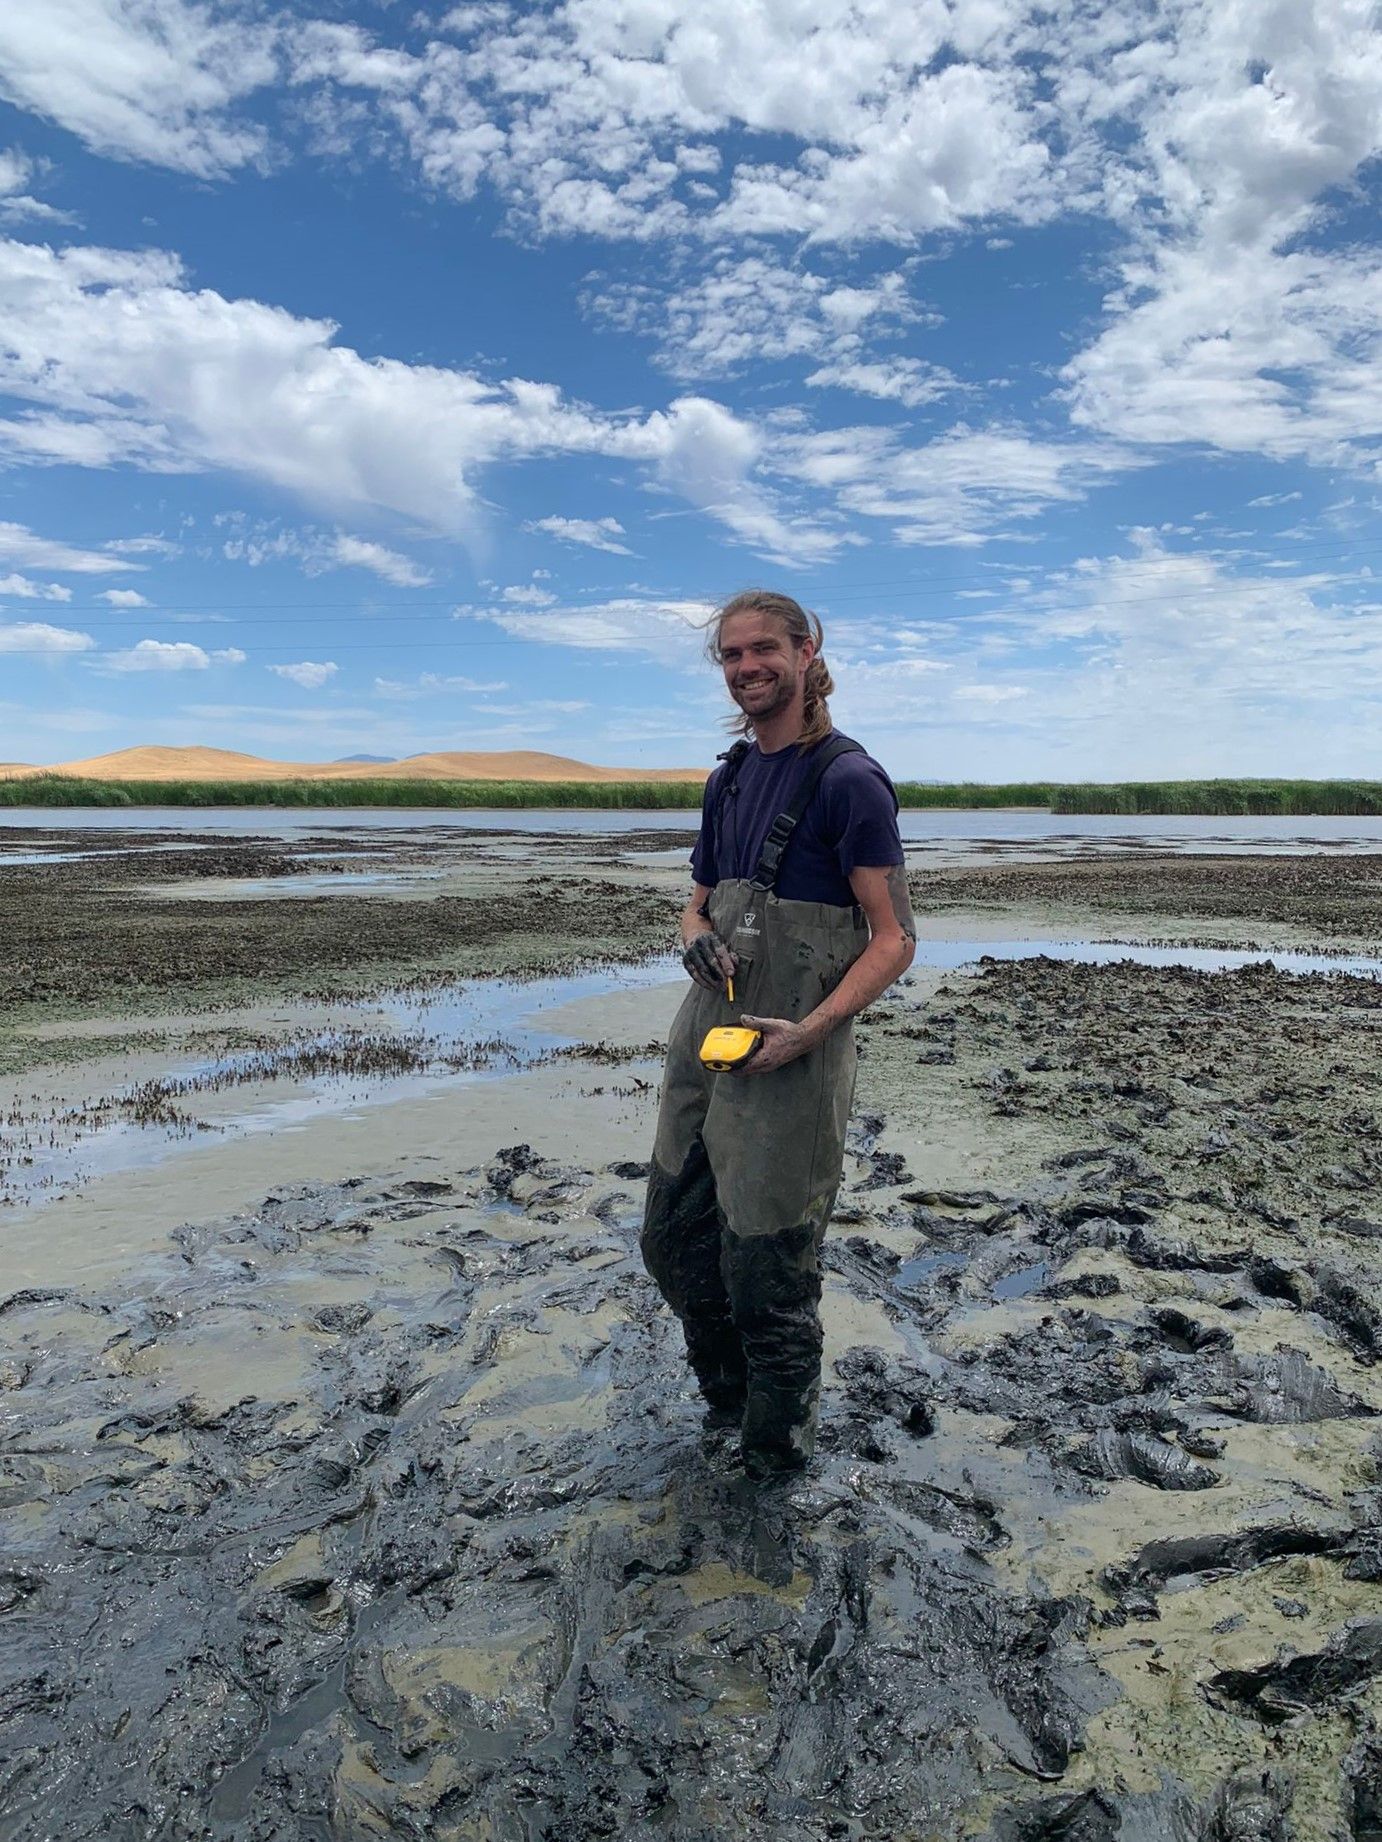
20240625HS_Robert.jpg ( 2024-06-25 14:45:37 ) Full size: 1920x1440
Robert modeling our newest waders which already have a broken clip
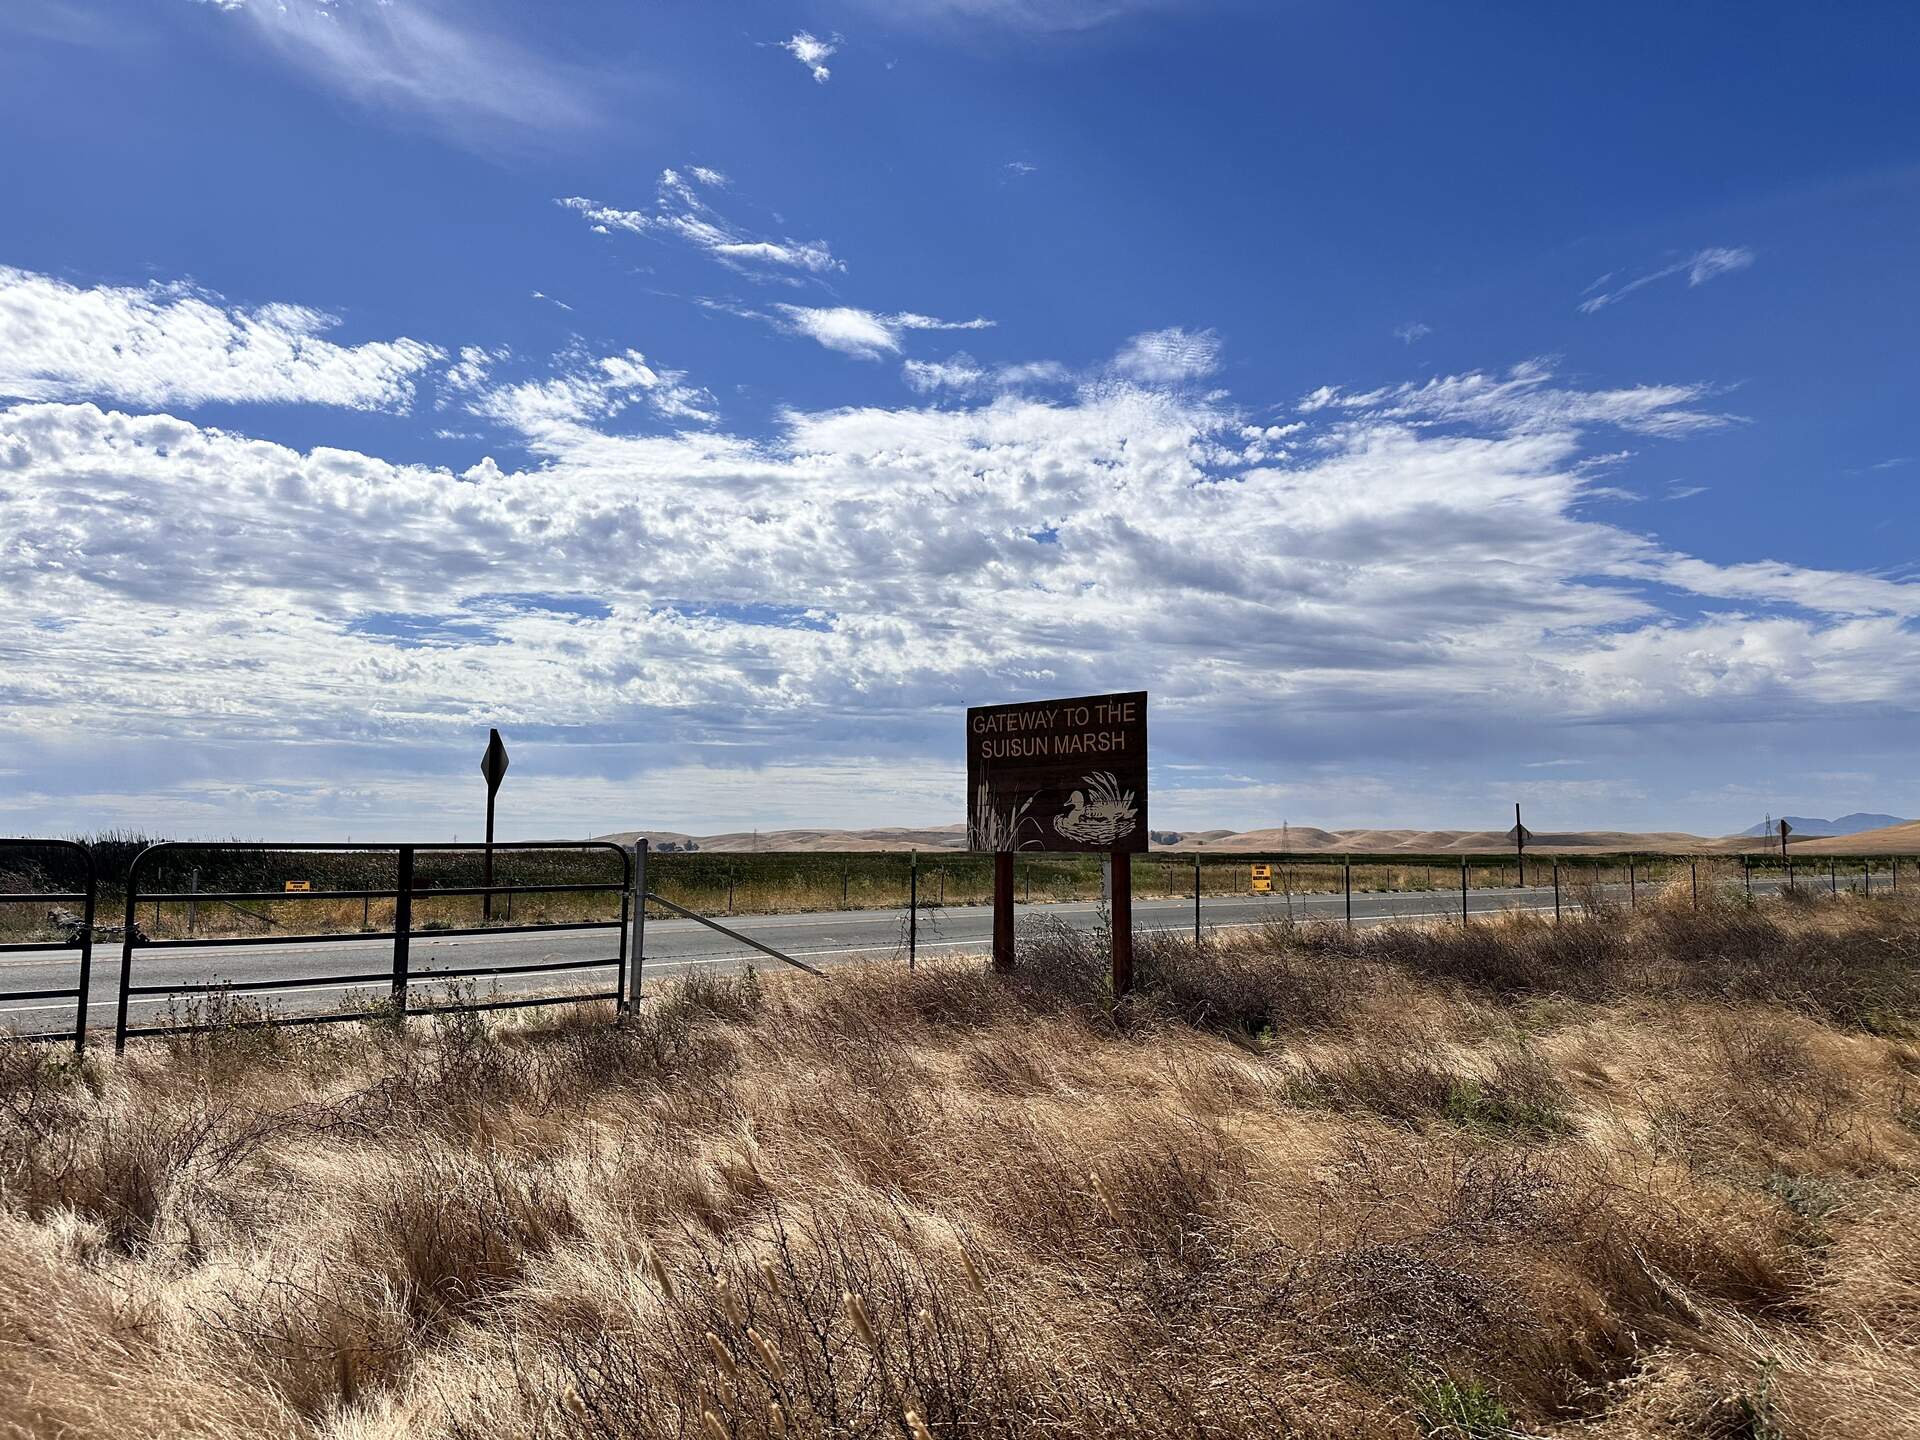
20240625HS_Sign.jpg ( 2024-06-25 09:59:17 ) Full size: 1920x1440
Welcome to Suisun Marsh!
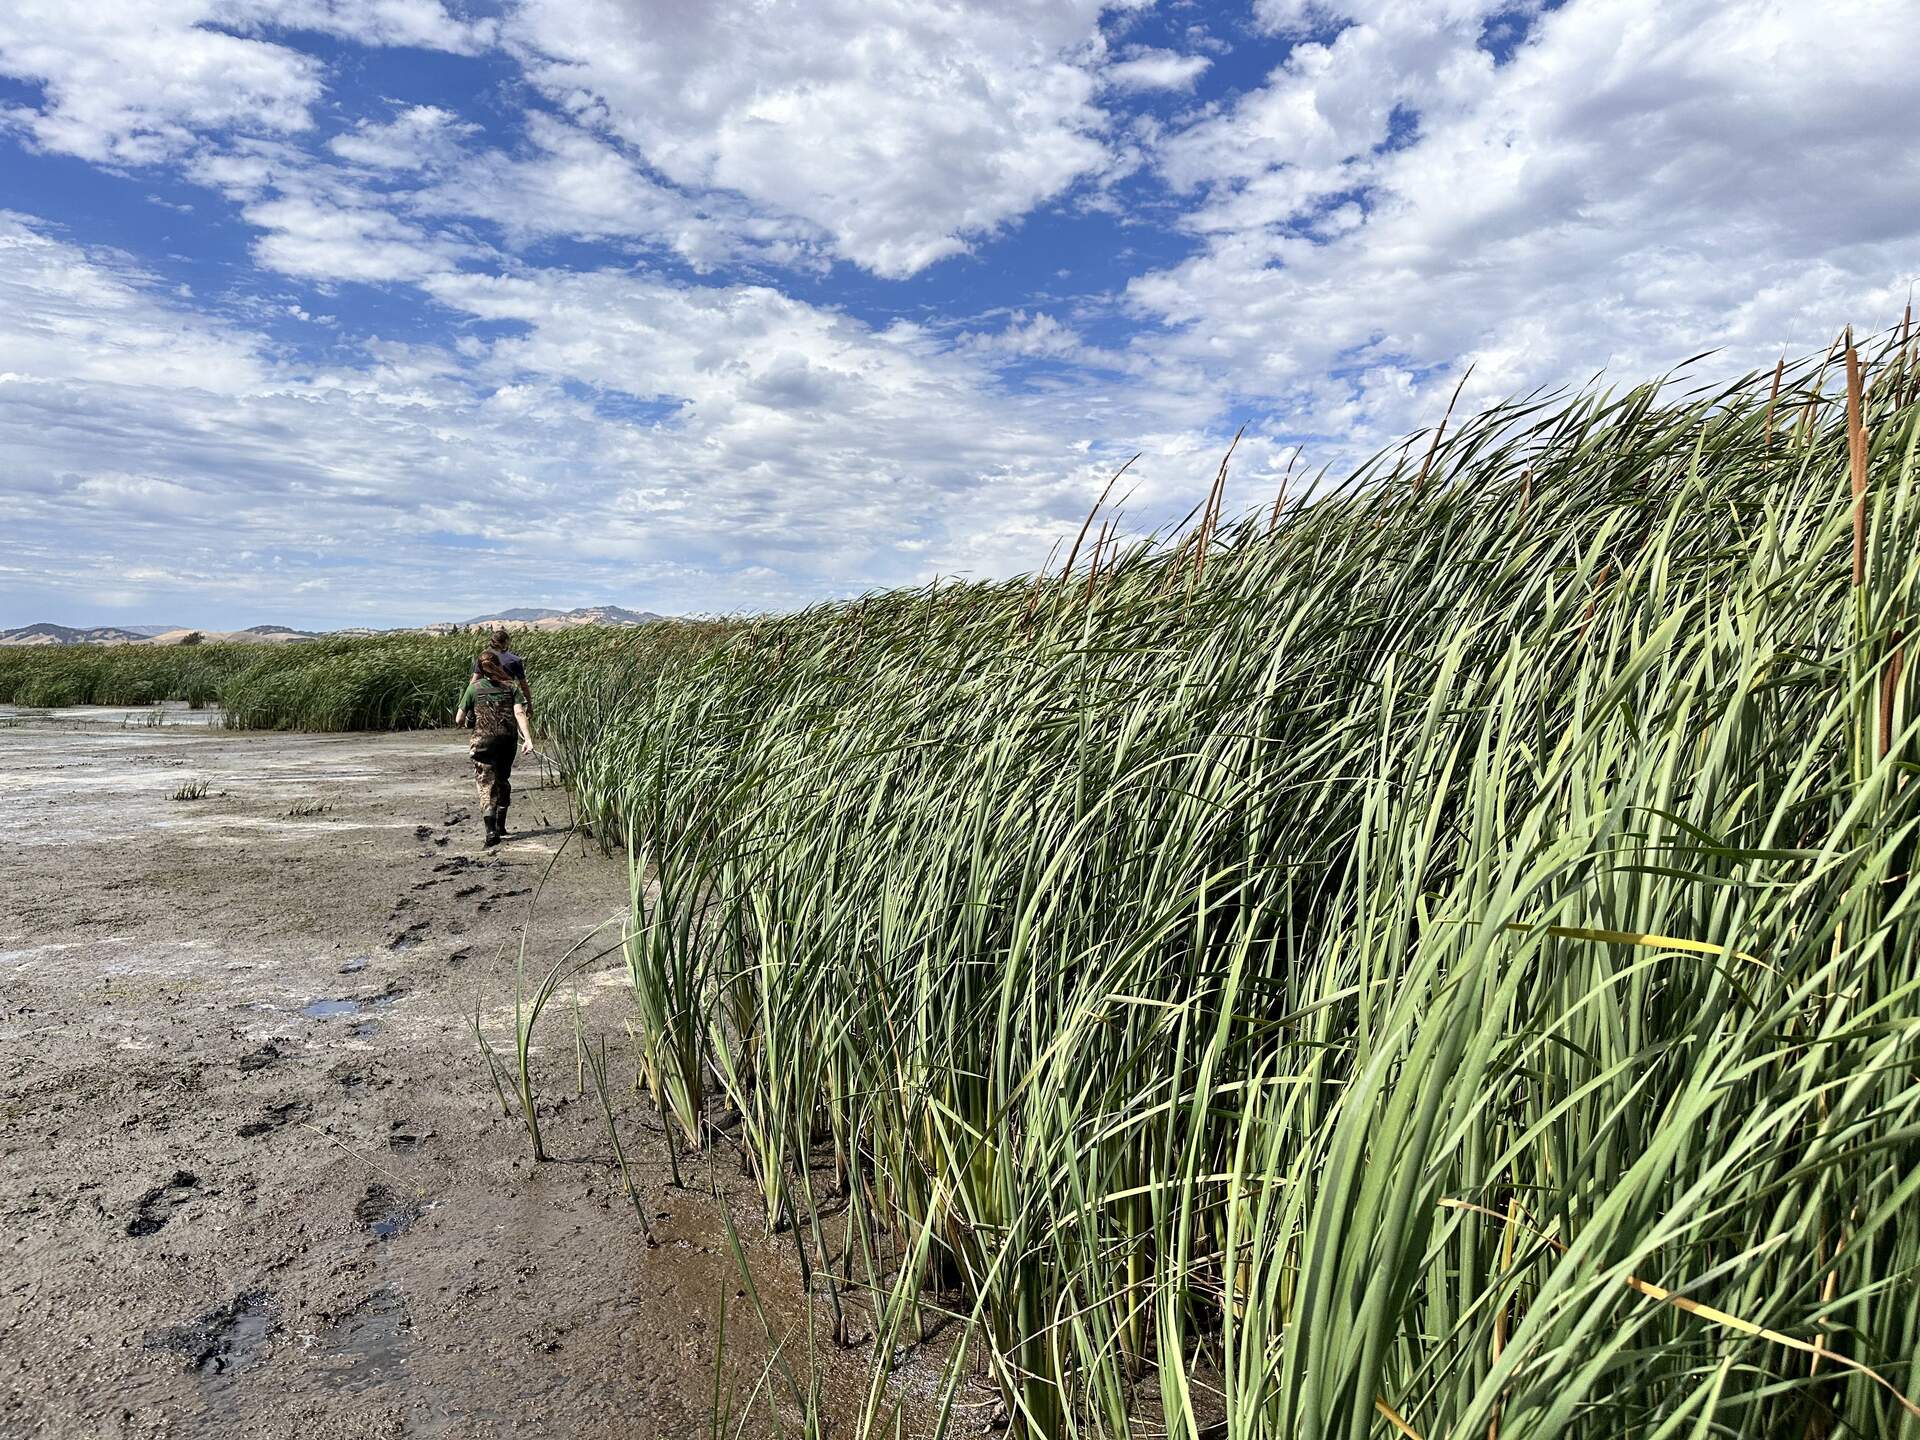
20240625HS_Trekking.jpg ( 2024-06-25 14:47:47 ) Full size: 1920x1440
Robert and Irene trekking into the wetland. We are trying to relocate HSM_8 to take its GPS point. Either we did not find the exact point, or we could not find the tall, thin, green garden stake we used to mark the location. So the garden stake is still in there somewhere.
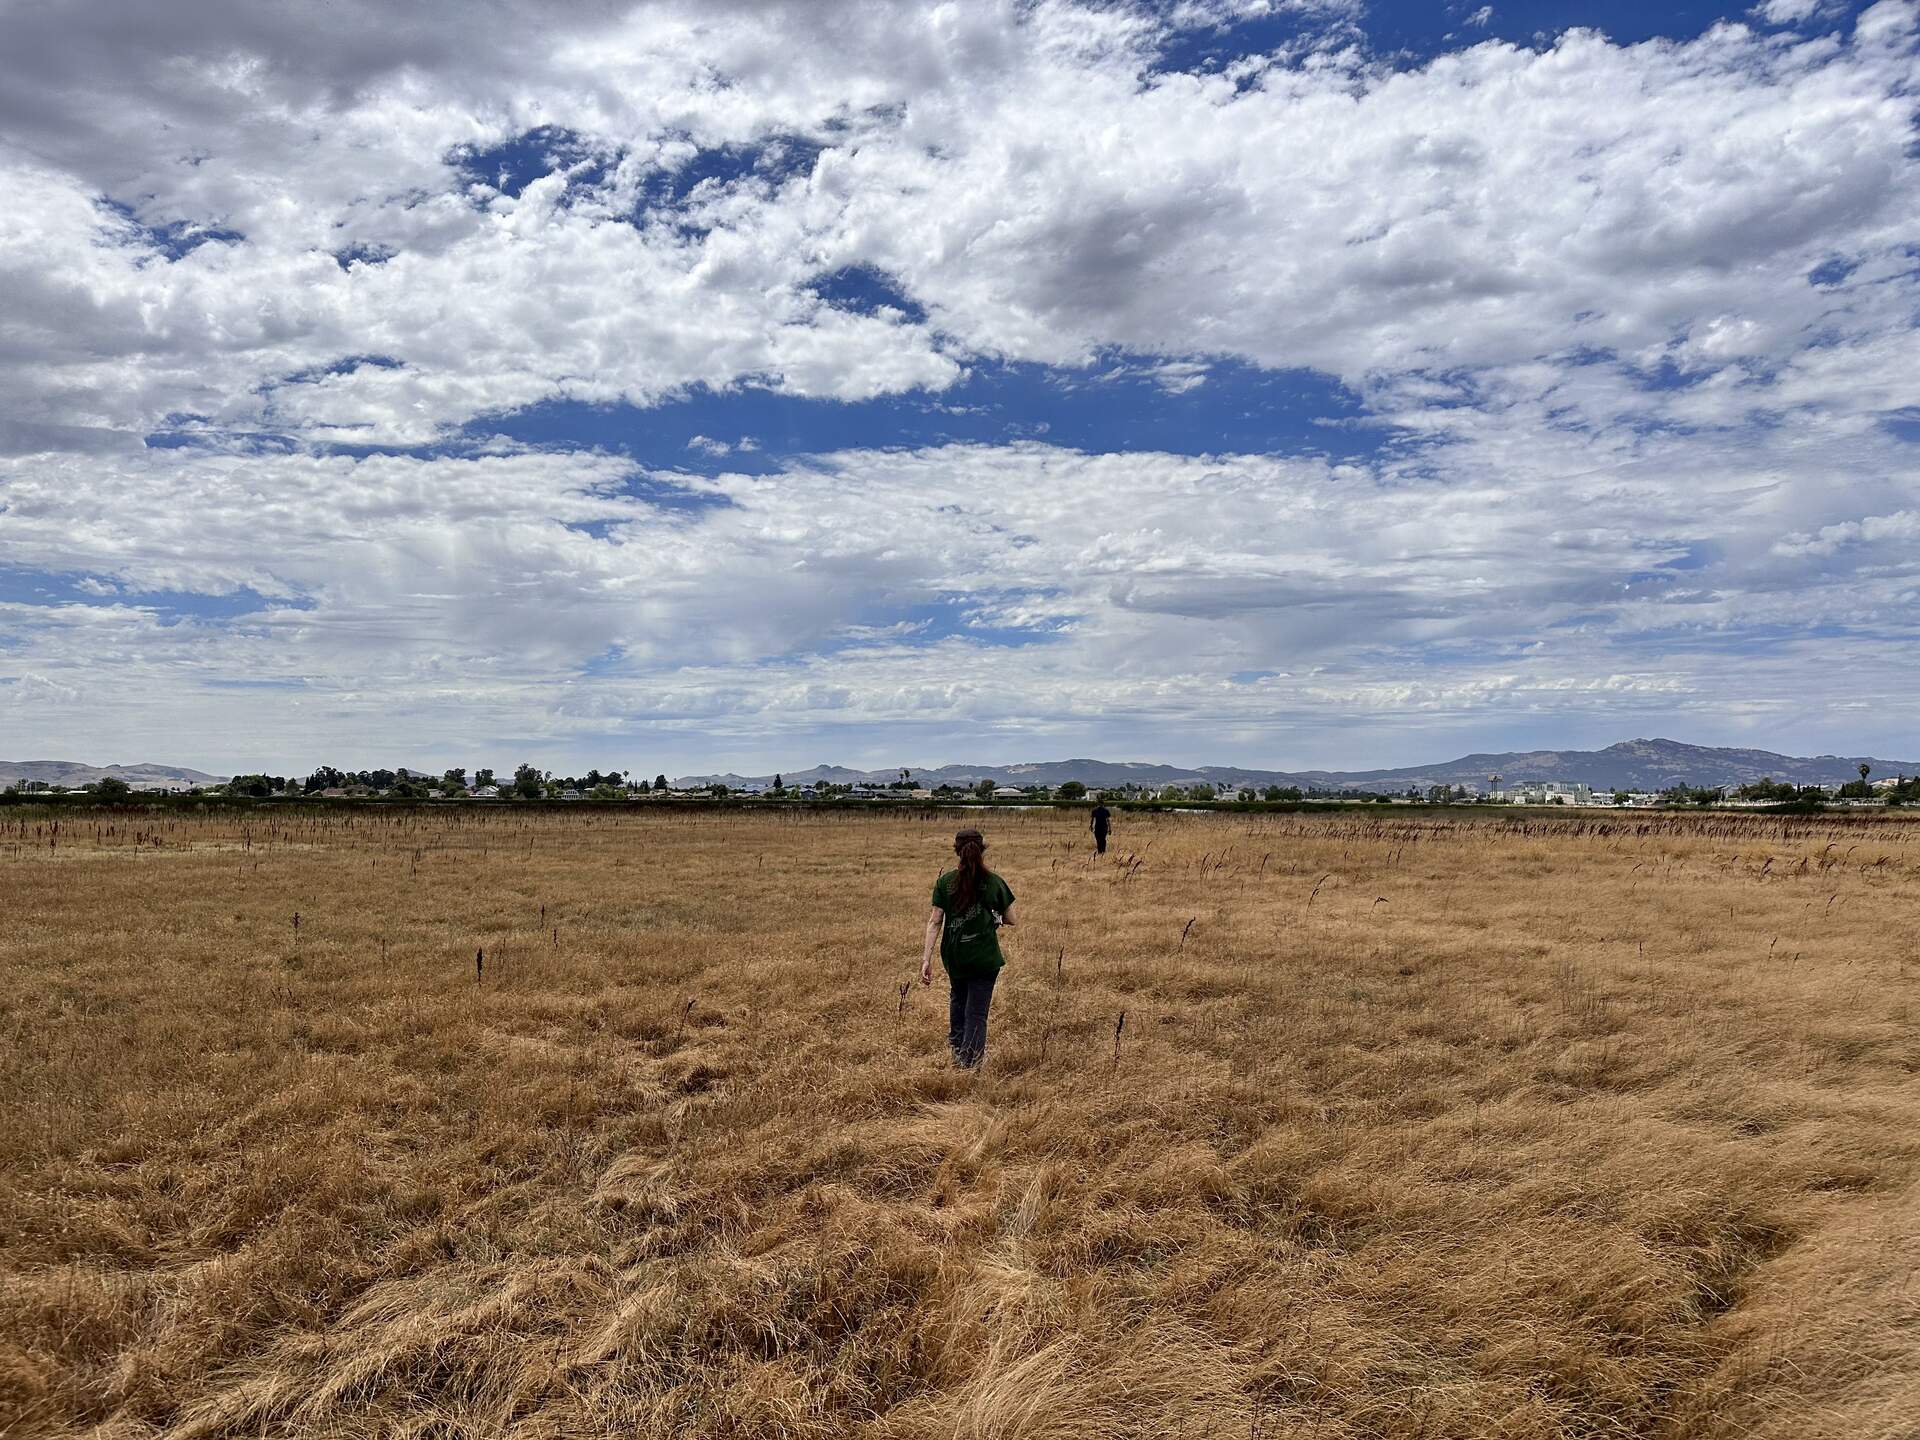
20240625HS_Upland.jpg ( 2024-06-25 14:28:56 ) Full size: 1920x1440
Irene and Robert walking into the upland section at the north end of Hill Slough marsh. We are trying to relocate HSM_9 to take its GPS point.
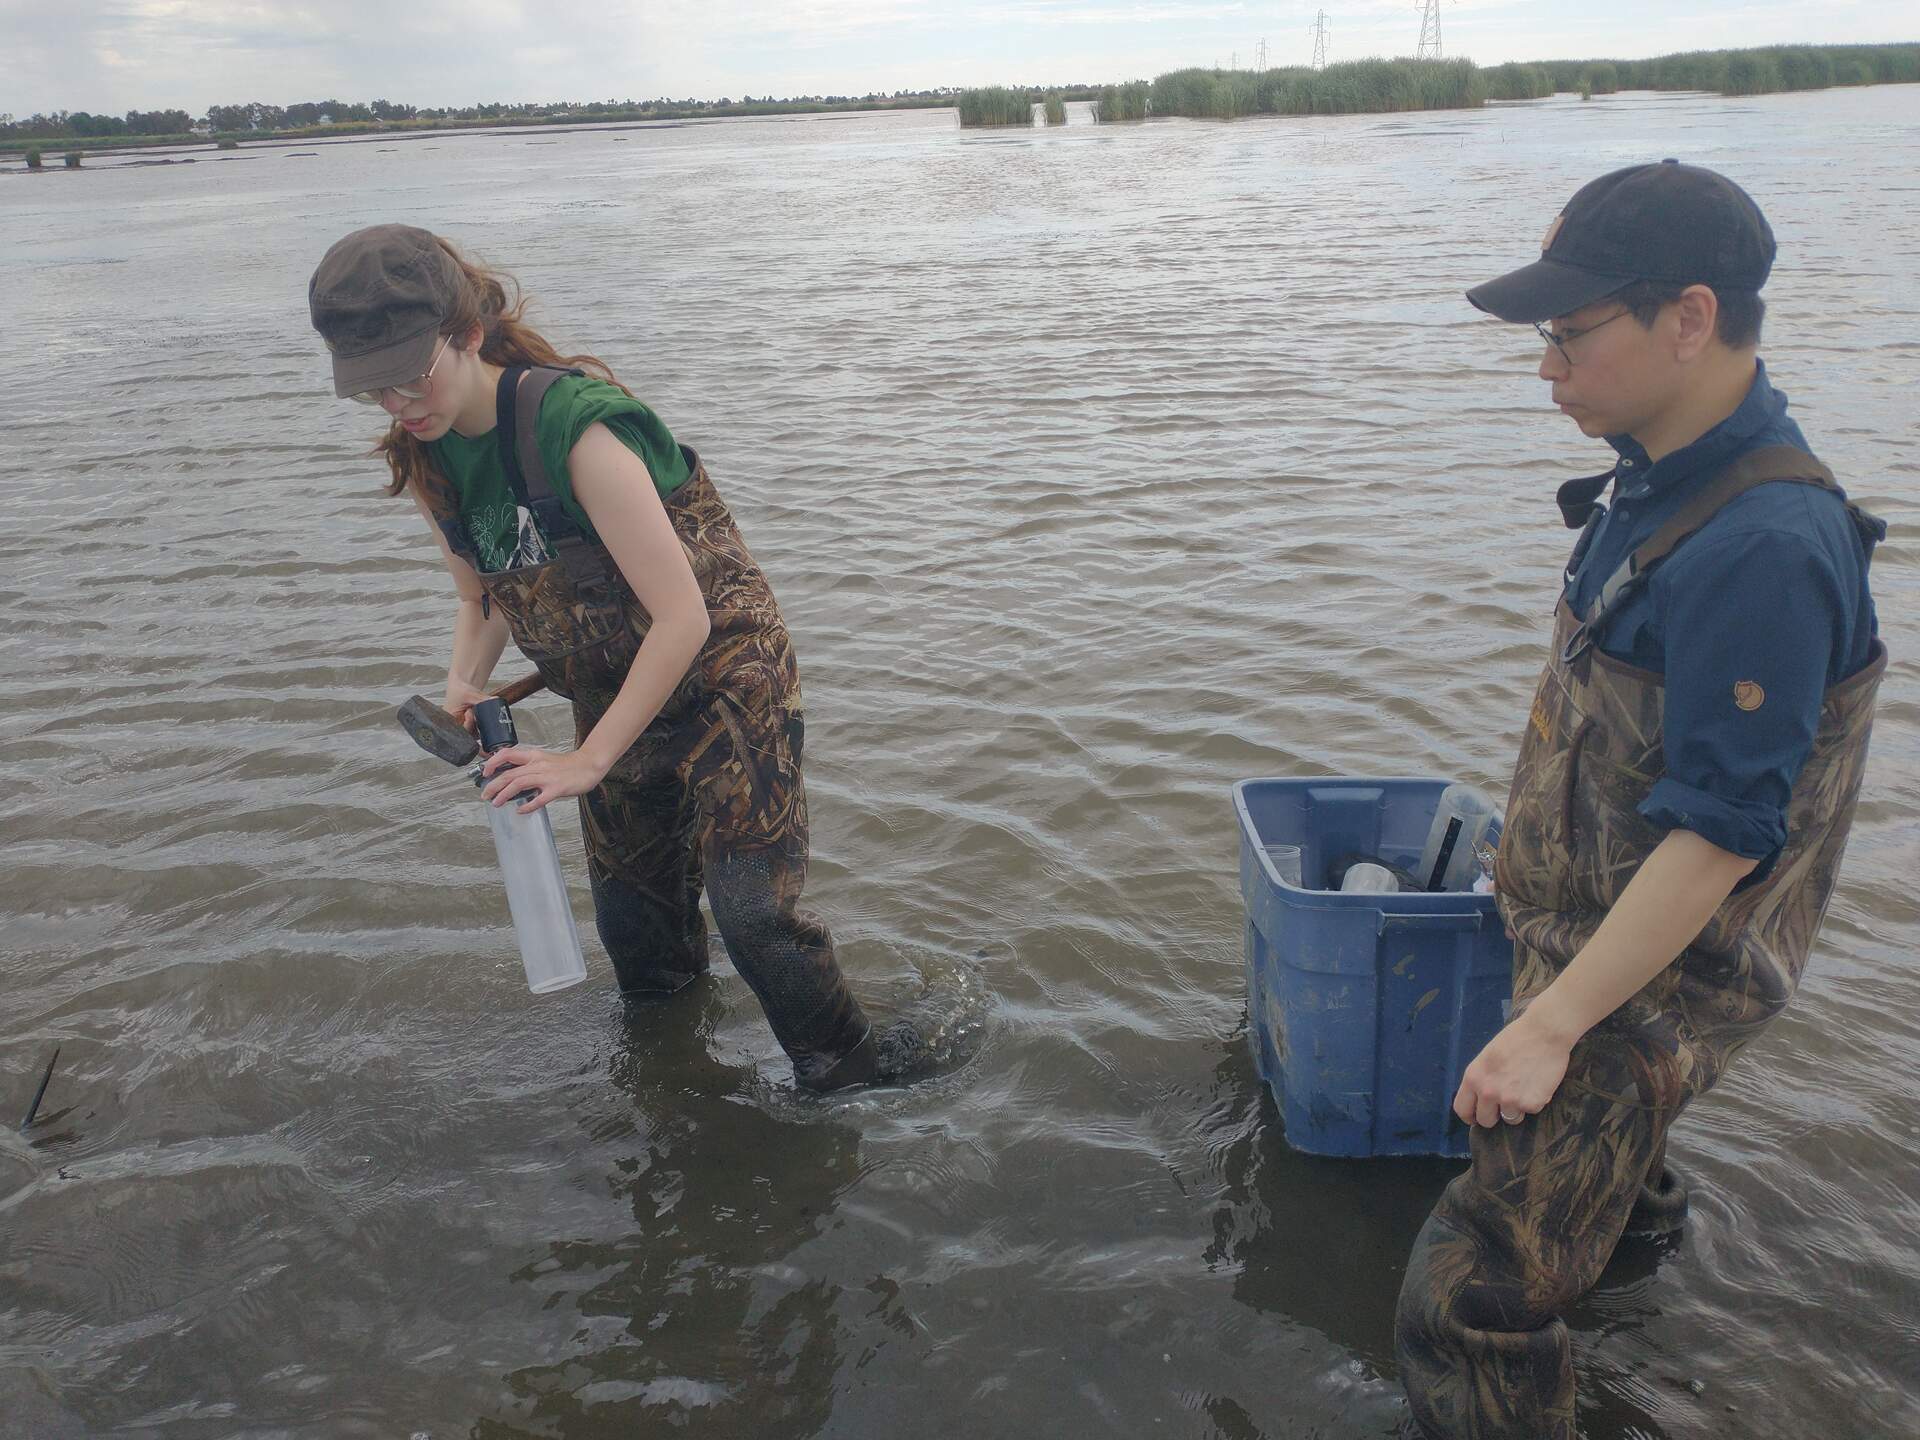
20240625HS_IreneKoong.jpg ( 2024-06-25 11:34:22 ) Full size: 1920x1440
Irene and Koong preparing to sample over standing water
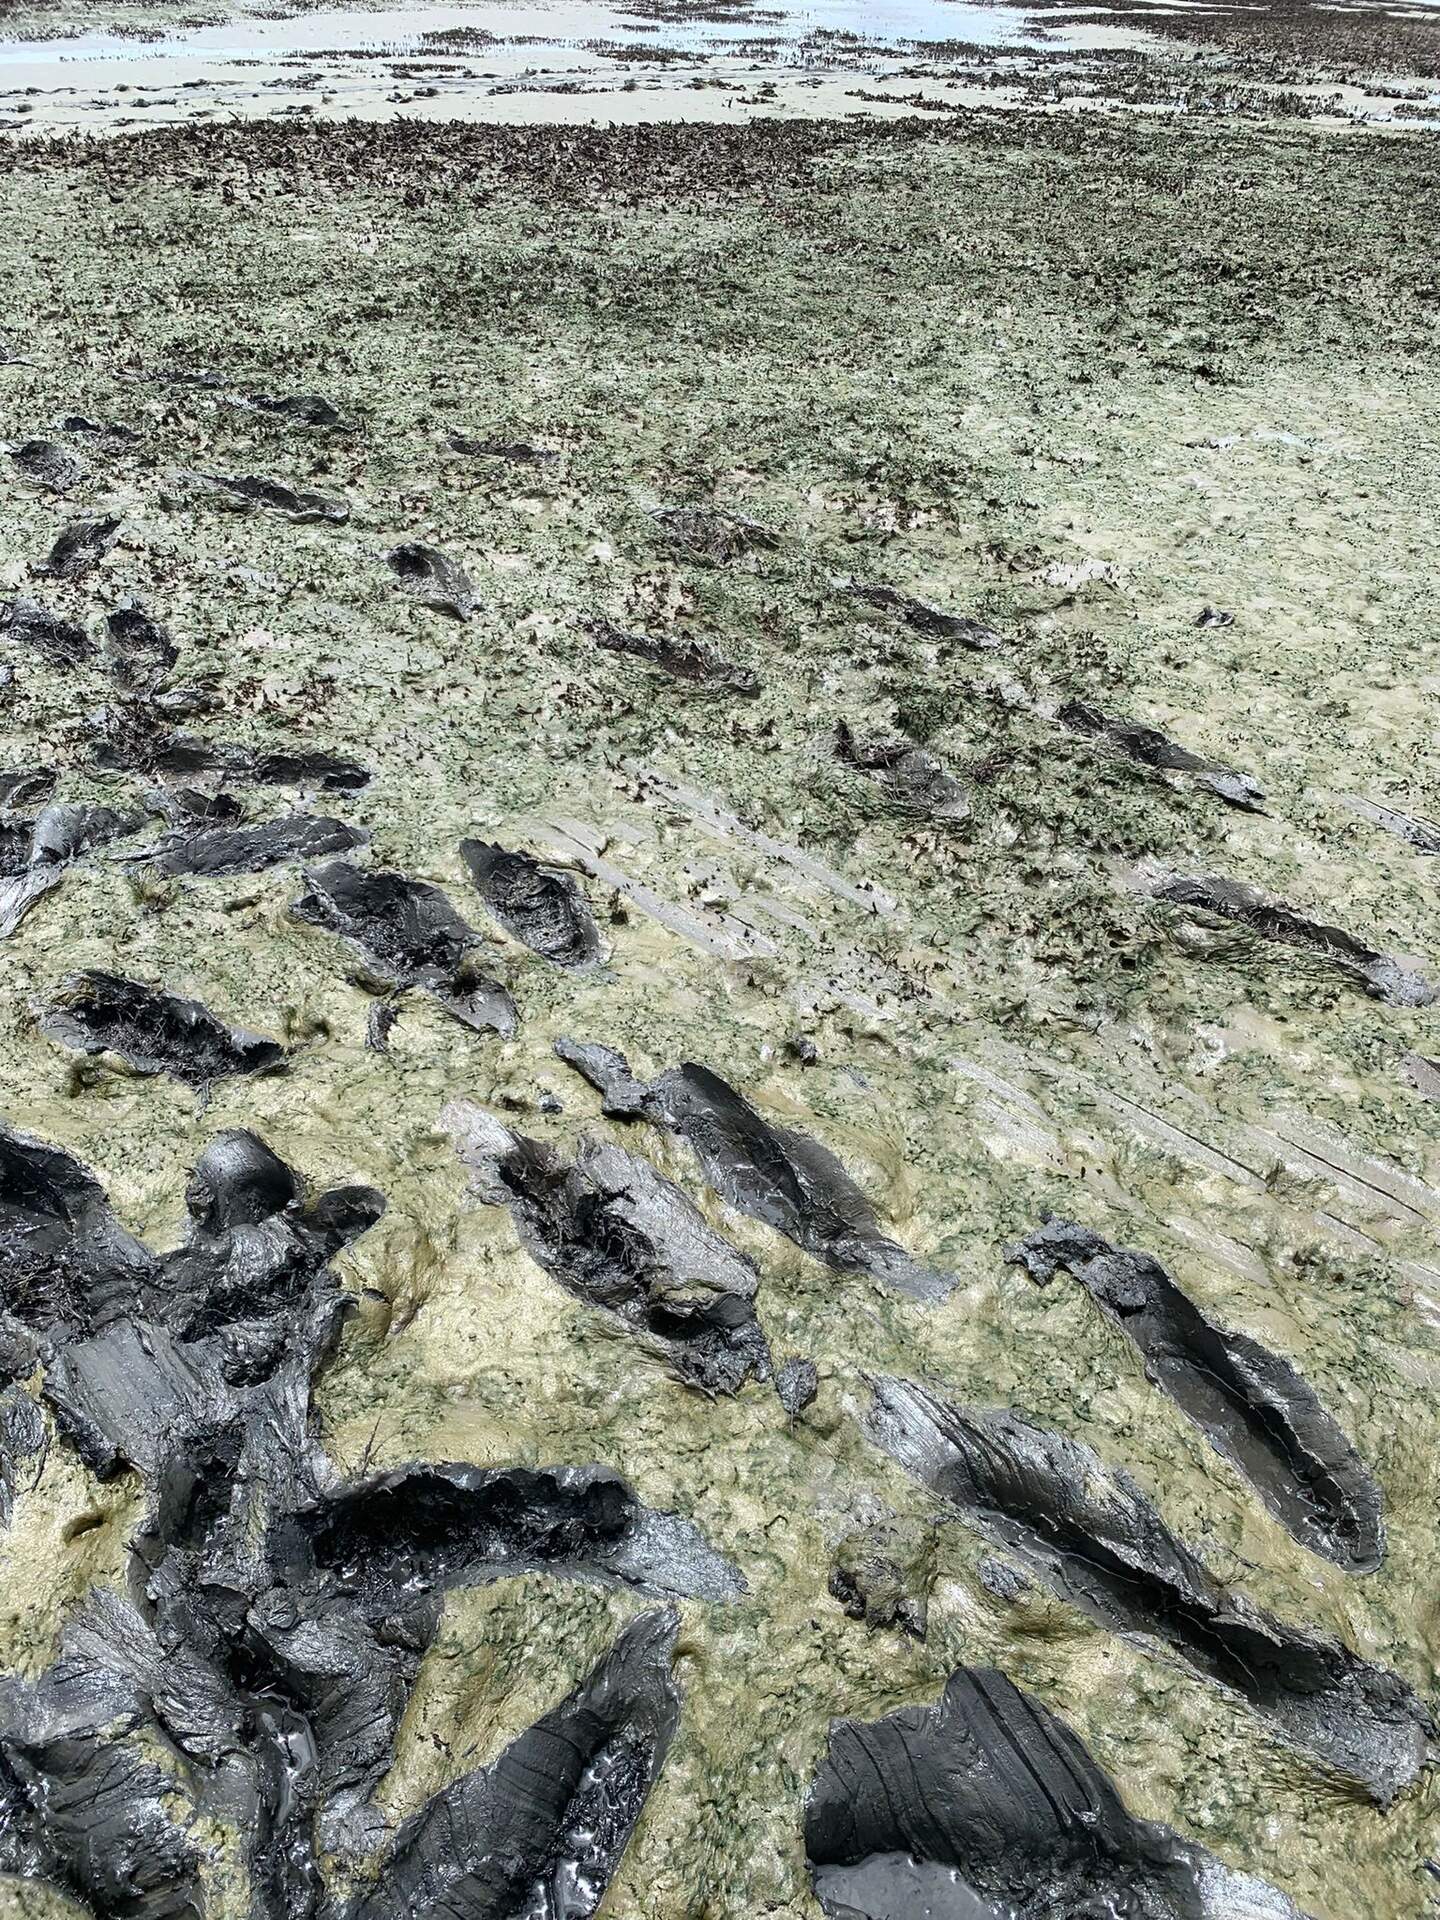
20240626HS_Hsm3Mud.jpg ( 2024-06-25 00:00:00 ) Full size: 1440x1920
Green mud near HSM_3
4 sets found
21 HS_met graphs found
4 HS_flux graphs found
1 HS_cam graphs found
Can't check HS_Processed
2 HS_Processed graphs found