
Field Notes
<--2010-12-02 11:30:00 | 2010-12-21 09:30:00-->Other sites visited today: Tonzi | Vaira | Twitchell Rice | Mayberry
Phenocam link: Searching...
Sherman Island: 2010-12-09 15:00:00 (DOY 343)
Author: Joe Verfaillie
Others: Jaclyn
Summary: Quick check - A okay.
| Sherman
12/9/2010 I arrived with Jaclyn about 3pm. It was overcast but warm with little wind. Cows were near the gate and kind of followed us out to the tower. Jaclyn measured the moisture point probes and I measured the wells. The wells were nearly dry. Everything seemed to be running okay. The radiometers looked clear and the tipping bucket was okay. The fan on the HMP45 was not running. |
3 photos found
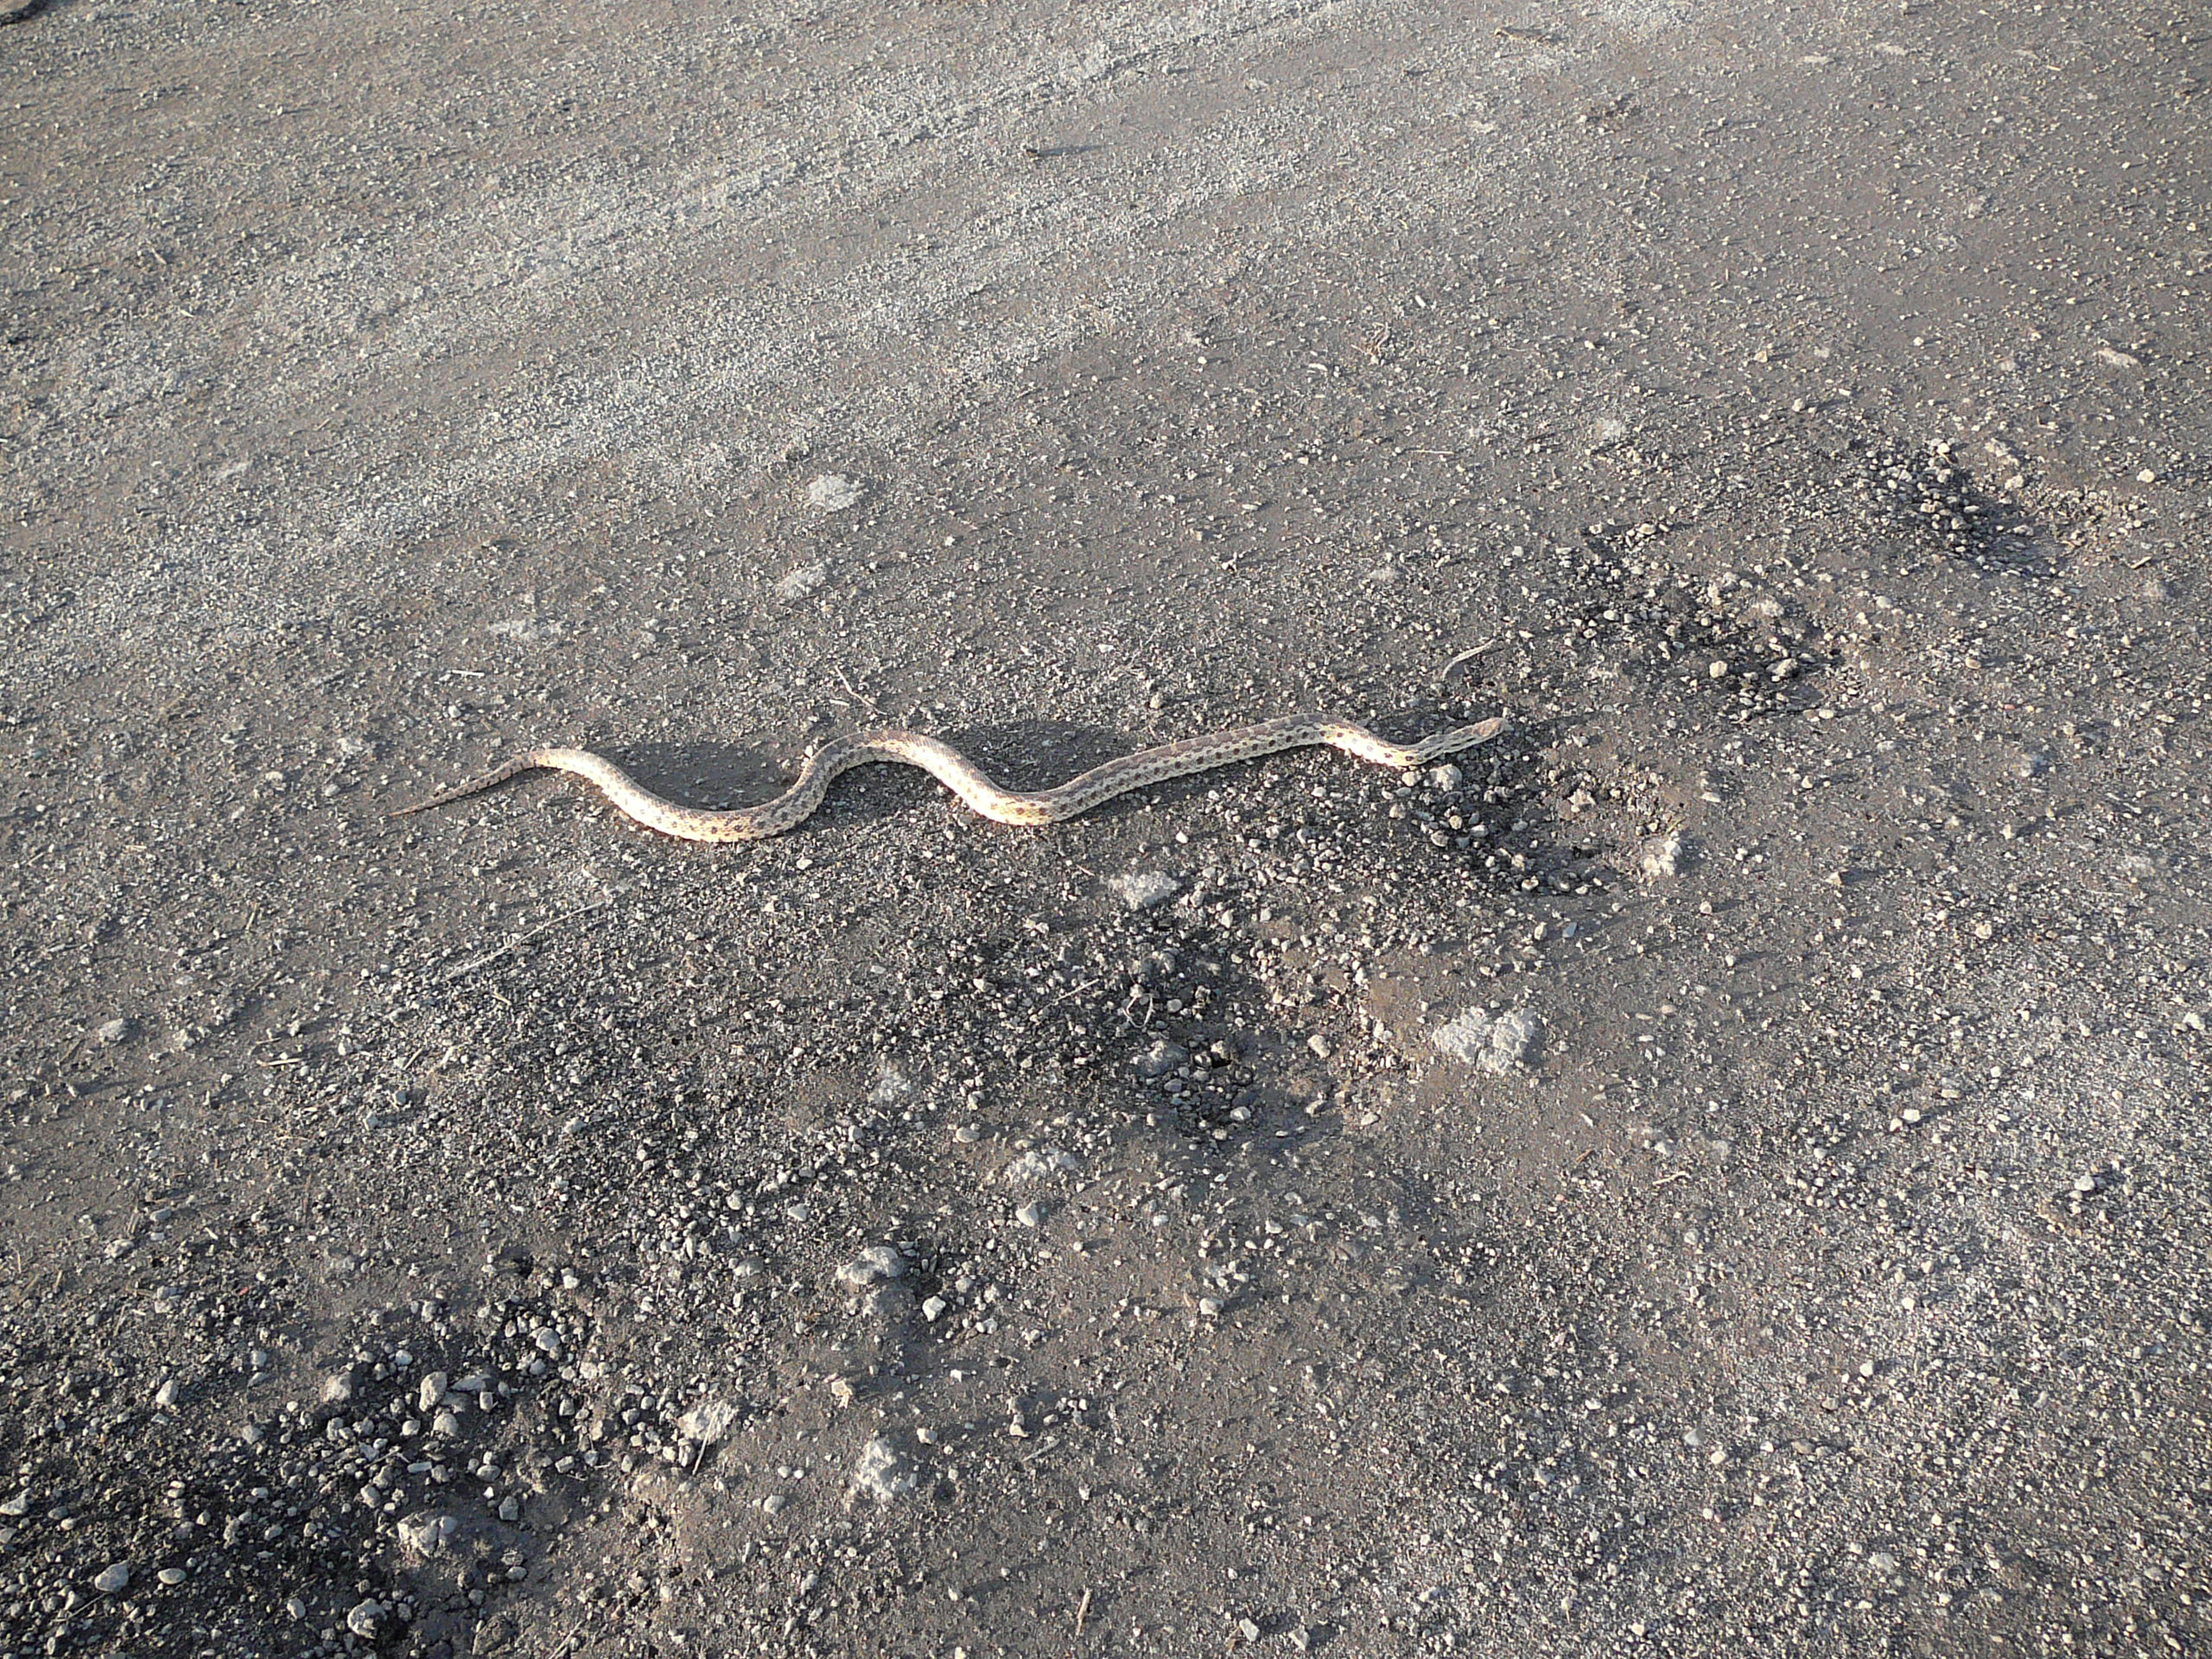
20101209SI_GarderSnake.jpg ( 2010-12-09 15:35:16 ) Full size: 2560x1920
Gopher snake on the road
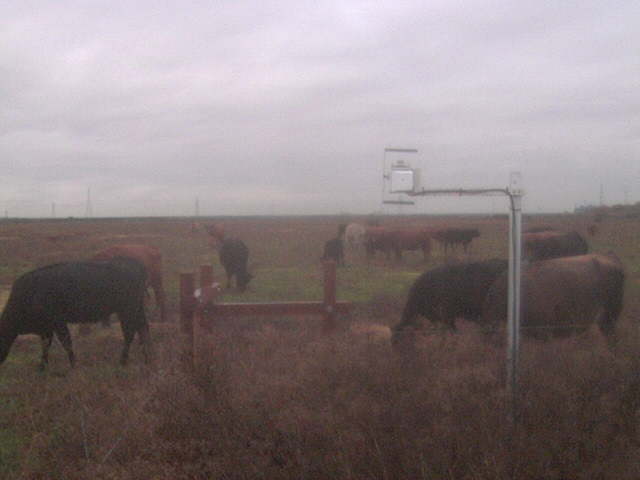
SI_webcam_2010342_1345.jpg ( 2010-12-08 13:45:02 ) Full size: 640x480
Lots of cows close by.
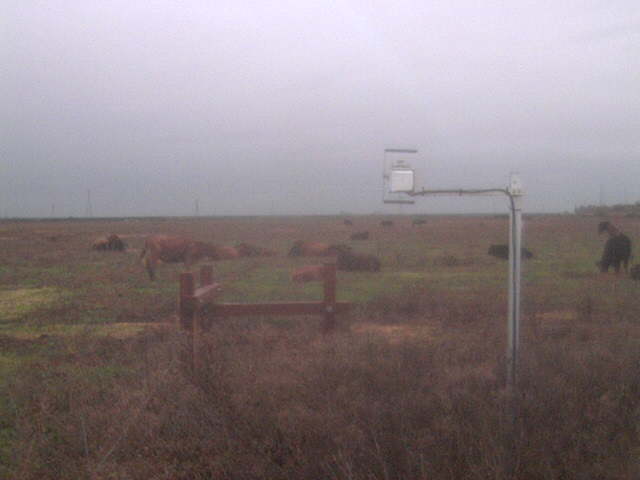
SI_webcam_2010342_1445.jpg ( 2010-12-08 14:45:02 ) Full size: 640x480
Cows resting on the ground.
7 sets found
No data found for SI_mp.
11 SI_met graphs found
Can't check SI_mixed
2 SI_mixed graphs found
5 SI_flx graphs found
2 SI_soilco2 graphs found
Can't check TWSI_mixed
Can't check SIMBTWEE_met