
Field Notes
<--2010-11-12 10:00:00 | 2010-12-30 08:00:00-->Other sites visited today: Vaira | Twitchell Rice | Mayberry | Sherman Island
Phenocam link: Searching...
Tonzi: 2010-12-09 09:00:00 (DOY 343)
Author: Joe Verfaillie
Others: Jaclyn
Summary: tower, floor power out, tram out - fixed, data copied, z-cam cards swapped, IRTs brough in, Floor computer clock reset.
| Tonzi 12/9/2010 I arrived about 9am with Jaclyn. It rained lightly most of the way out to the site, but wasn't raining when we arrived. It was warm with little to no wind. Cows were around near the gat at Irish Hill Rd. Most of the trees have lost their leaves but some are holding on to a lot of brown leaves. The pale lichen and green moss is bright on the branches. Green grass and herbs are everywhere, but don't seem to be growing very fast. The tower batteries were at 11.1V and power was off. I completely disconnected the CO2 profile system that Siyan had disabled last time. Then I forced the power on and battery voltage sank to about 10.8V before shutting off again. I booted the screen and computer from a portable battery and started to copy data. A little later the sun peeked through for a few minutes, the battery voltage shot up to 12.6V and power came on. Without the computer and screen the system was pulling 1.4A. With the computer and screen on, it pulls 4A and without the screen 3.1A. Last time without power, Siyan could not tell but it seems the screen was on when I powered it up. Later the clouds blocked the sun and the system shutdown. At the Floor site, the Solar system was saying the batteries were at 12.3V. At the tower there was only 11.26V. I found a loose screw in the power terminal at the solar panels and tightening this improved the voltage at the tower to 11.63V. However the screen, computer and sonic seemed to have problems running. I used a portable battery to boot the computer and copy the data. The computer clock was about 6 days behind. When the computer clock said Dec 3, 2010 11:39, I reset it to Dec 9, 2010 10:28. When I left the power at the box with no screen was 11.8V and the sonic and computer were running. The soil CO2 charger controller reported 24.7V, 0.5A solar and 0.4A load. This seems okay. The tipping bucket was clear though there was bird poop on the screen. The radiometers look clean. The tram had stopped with a low battery. Its charging base batteries were above 24V. I swapped the cart's battery and it move to parking. I did not see it run before I left. Jaclyn swapped the cards in the z-cams but was unable to test the new cards because there was no power. We brought in the IRT ( sn 1281, sn 1282 ) setup. |
Field Data
No tank data
No TZ Well data found
No TZ Moisture Point data found
No VR Moisture Point data found
No TZ grass heigth found
No VR grass heigth found
No TZ Tree DBH found
No water potential data found
No TZ Grass Biomass data found
No TZ OakLeaves Biomass data found
No TZ PineNeedles Biomass data found
4 photos found
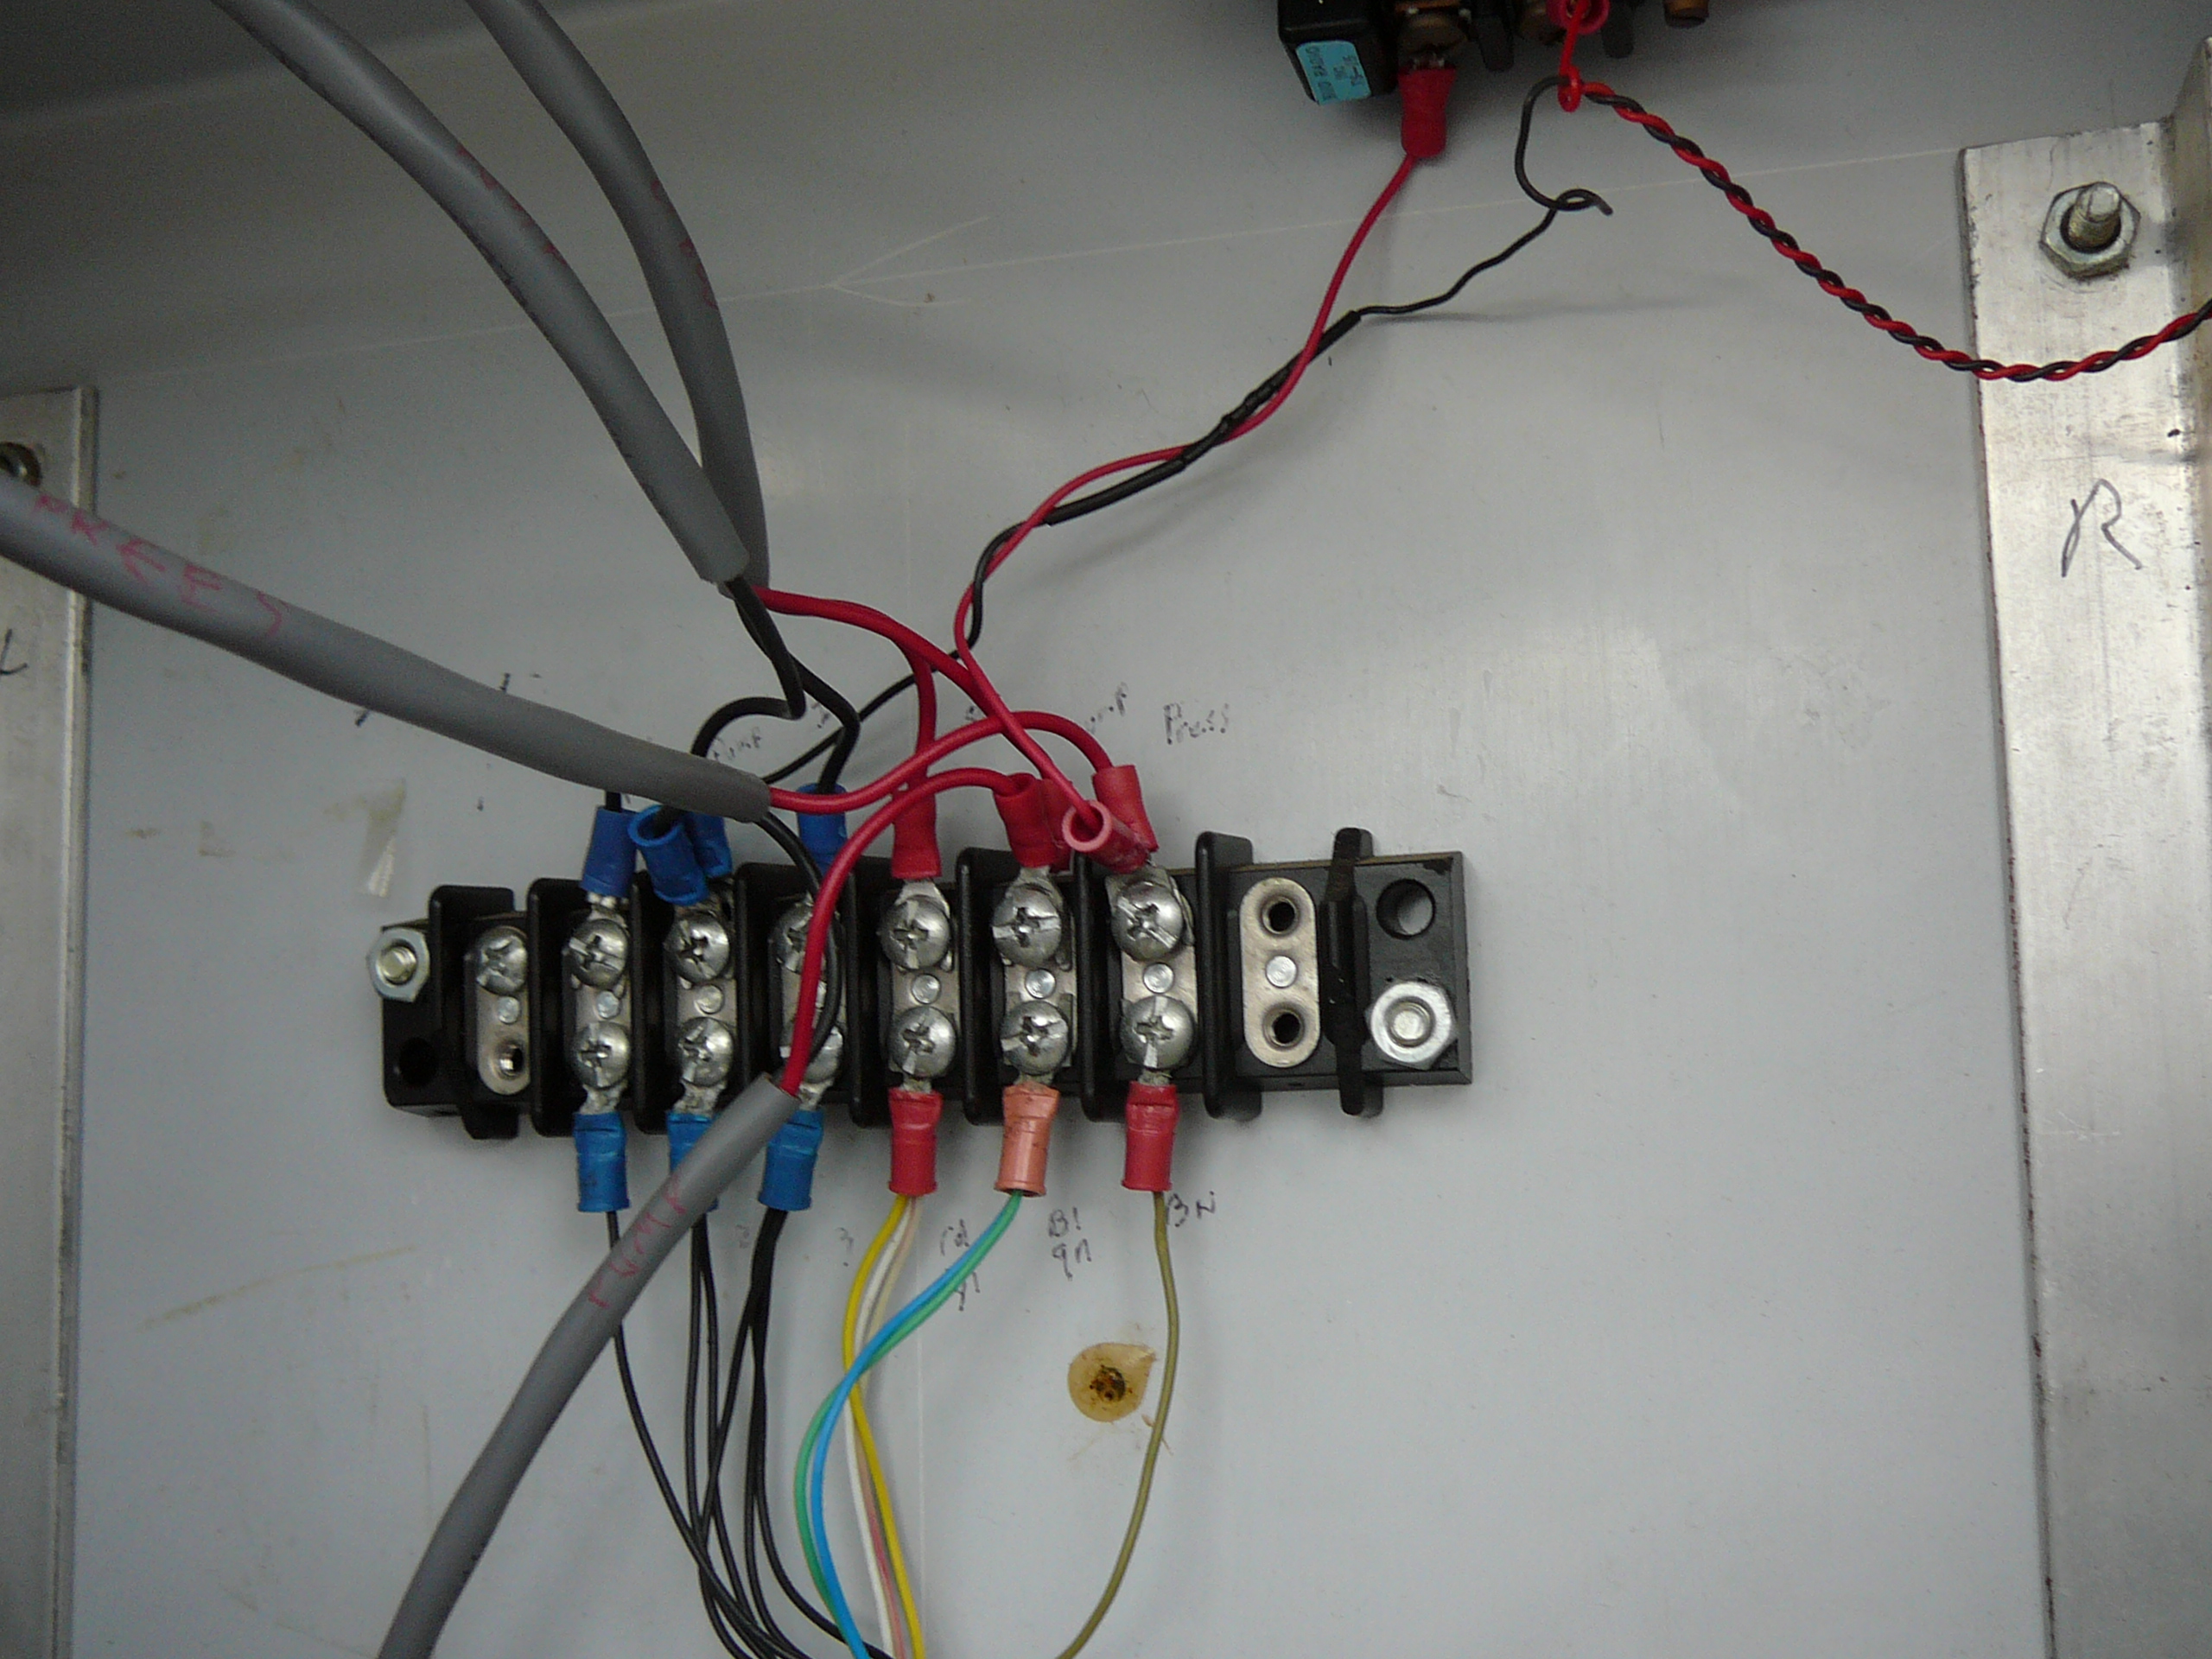
20101209TZ_CO2profilePowerStrip.jpg ( 2010-12-09 09:18:02 ) Full size: 2560x1920
Power distribution strip in data logger box

20101209TZ_CO2ProfilePowerSupply.jpg ( 2010-12-09 09:18:45 ) Full size: 2560x1920
DC power converters in CO2 profile box

20101209TZ_FloorPanelsWiring.jpg ( 2010-12-09 10:21:36 ) Full size: 2560x1920
Wiring of the solar panels at the Floor site
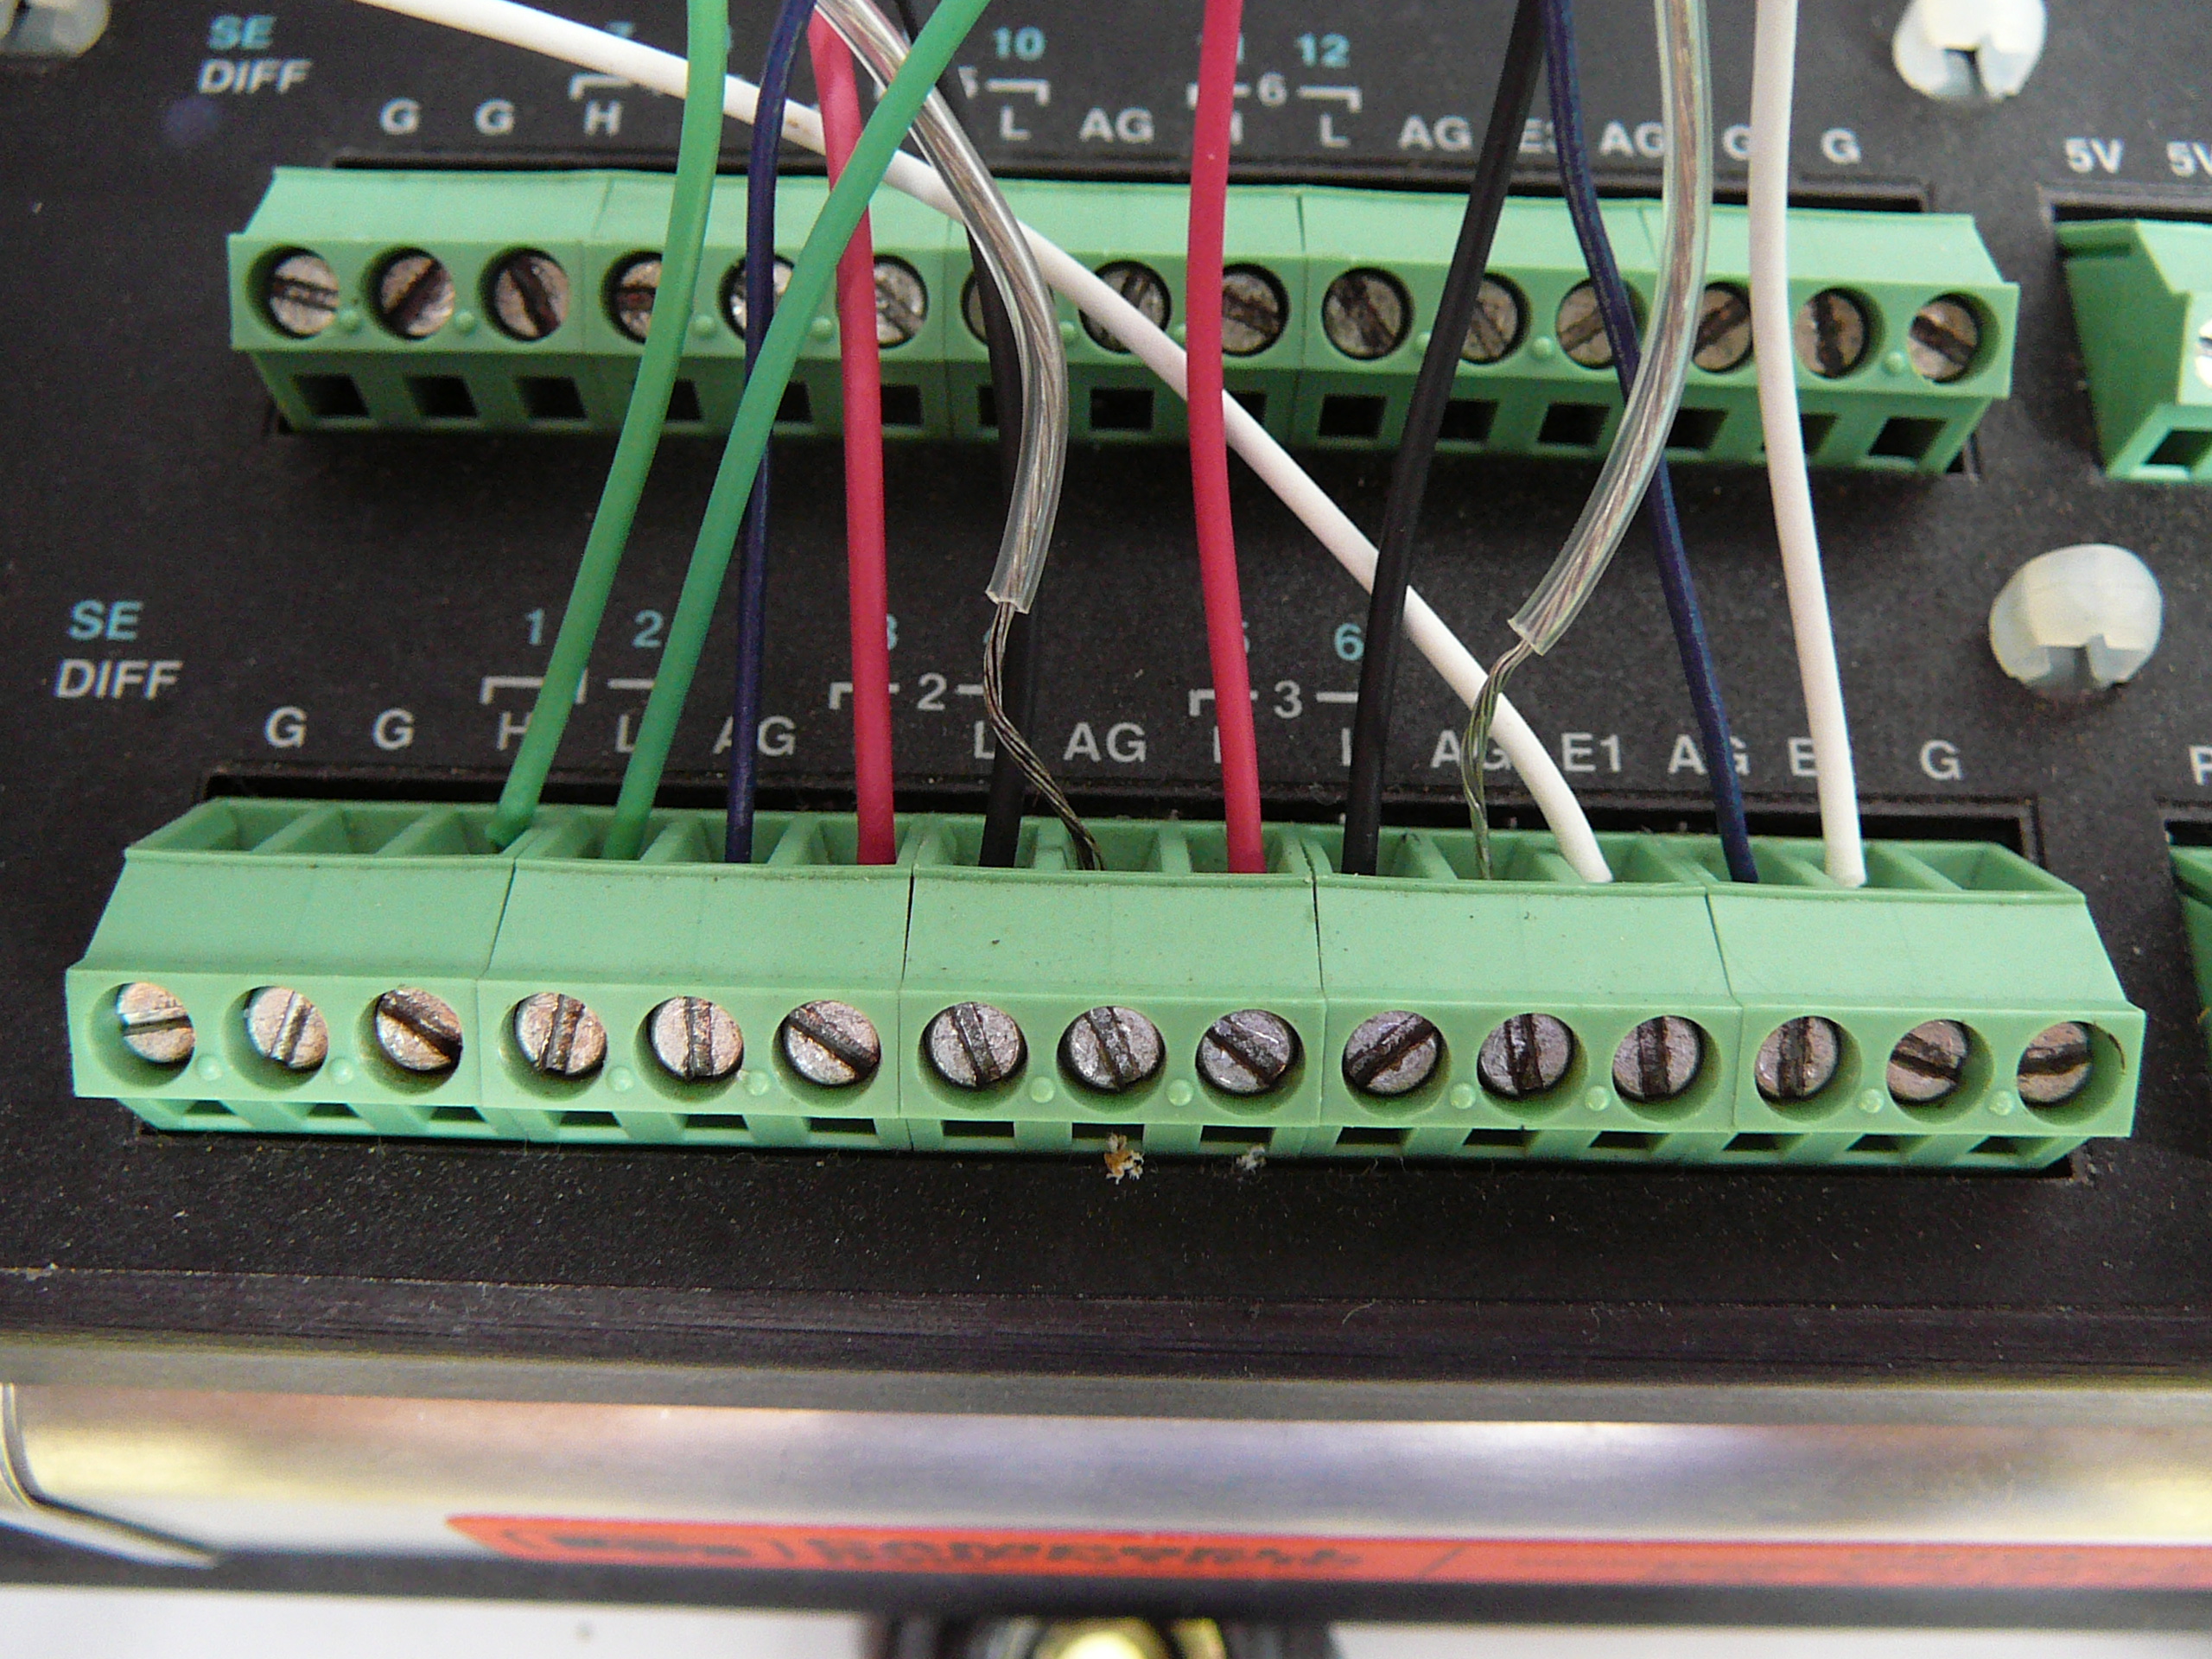
20101209TZ_IRTWiring.jpg ( 2010-12-09 09:33:20 ) Full size: 2560x1920
data logger wiring for IRT sensor
16 sets found
No data found for TZ_Fenergy.
11 TZ_tmet graphs found
11 TZ_soilco2 graphs found
Can't check TZ_mixed
3 TZ_mixed graphs found
1 TZ_fflux graphs found
8 TZ_fmet graphs found
1 TZ_tram graphs found
3 TZ_co2prof graphs found
No data found for TZ_irt.
No data found for TZ_windprof.
1 TZ_tflux graphs found
2 TZ_sm graphs found
Can't check TZ_met
1 TZ_met graphs found
Can't check TZVR_mixed
No data found for TZ_osu.
No data found for TZ_fd.
Tonzi Z-cam data