Field Notes
<--2010-11-18 02:30:00 | 2010-12-09 15:00:00-->Other sites visited today: Twitchell Rice | Mayberry
Phenocam link: Searching...
Sherman Island: 2010-12-02 11:30:00 (DOY 336)
Author: Joe Verfaillie
Others: Cristina
Summary: All's well, restarted computer, collected data.
| Sherman
12/2/2010 I arrived about 11:30 with Cristina. It was cold and overcast with not enough wind for me to notice. The field looks very brown and yellow from the bridge. The pepperweed is all dead probably due to frost. The cows were in the far west end of the field. All systems were running but when I plugged in my USB drive the computer seemed to freeze up and I had to do a hard reset. Otherwise things looked okay. I cleaned blood from the NDVI sensor and some dirt from the rain bucket. Cristina measured the wells with a tape measure. Inside fence: 106cm from water level to top of pipe. Middle: 103cm North: 128cm |
2 photos found

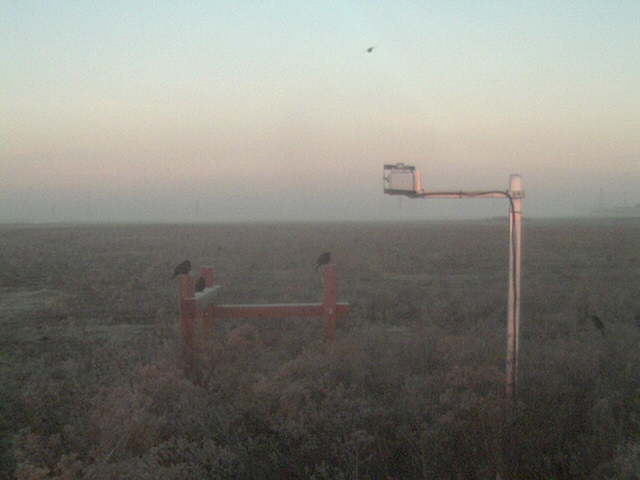
SI_webcam_2010335_0715.jpg ( 2010-12-01 07:15:02 ) Full size: 640x480
Birds on the fence.

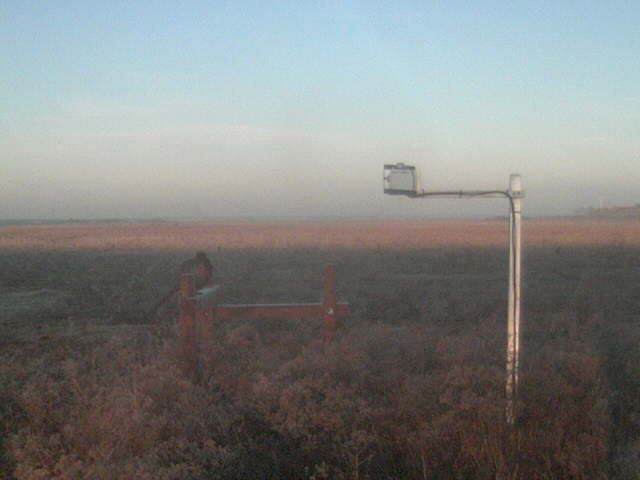
SI_webcam_2010335_0745.jpg ( 2010-12-01 07:45:02 ) Full size: 640x480
Pheasant on the fence.
7 sets found
1 SI_mp graphs found
11 SI_met graphs found
Can't check SI_mixed
2 SI_mixed graphs found
5 SI_flx graphs found
2 SI_soilco2 graphs found
Can't check TWSI_mixed
Can't check SIMBTWEE_met

