
Field Notes
<--2024-05-23 13:35:00 | 2024-06-18 14:35:00-->Other sites visited today: Gilbert Tract | Mayberry | Bouldin Corn | Bouldin Alfalfa | Hill Slough
Phenocam link: Searching...
East End: 2024-06-03 11:35:00 (DOY 155)
Author: Daphne Szutu
Others: Arman
Summary: Regular data collection/cleaning, lots of tule flowers
| 2024-06-03 East End Arman and I arrived at 11:35 PST (12:35 PDT). It was warm and breezy. The staff gauge read 81cm. The tules have tons of flowers, and the two different species of tules on either side of the road had notably different flowers. One species has taller reeds and just a few flowers on top. The other species is shorter and has a much denser cluster of flowers. There were goats or sheep hanging out by the well pad. We had to open up one panel fence to get to the site. The staff gauge read 81cm. I downloaded met, cam, and USB GHG data. Arman cleaned flux and rad sensors and topped off the wash reservoir. We measured the surface water conductivity. Sample, temperature-compensated conductivity, temperature Surface, 190.3 uS, 17.6 C The 7500 read: 415ppm CO2, 806mol/m3 H2O, 25.7C, 101.2kPa, 95SS – 96 after cleaning The 7700 read: forgot to write CH4, 44RSSI – 74 after cleaning We left at 11:55 PST (12:55 PDT). |
2 photos found
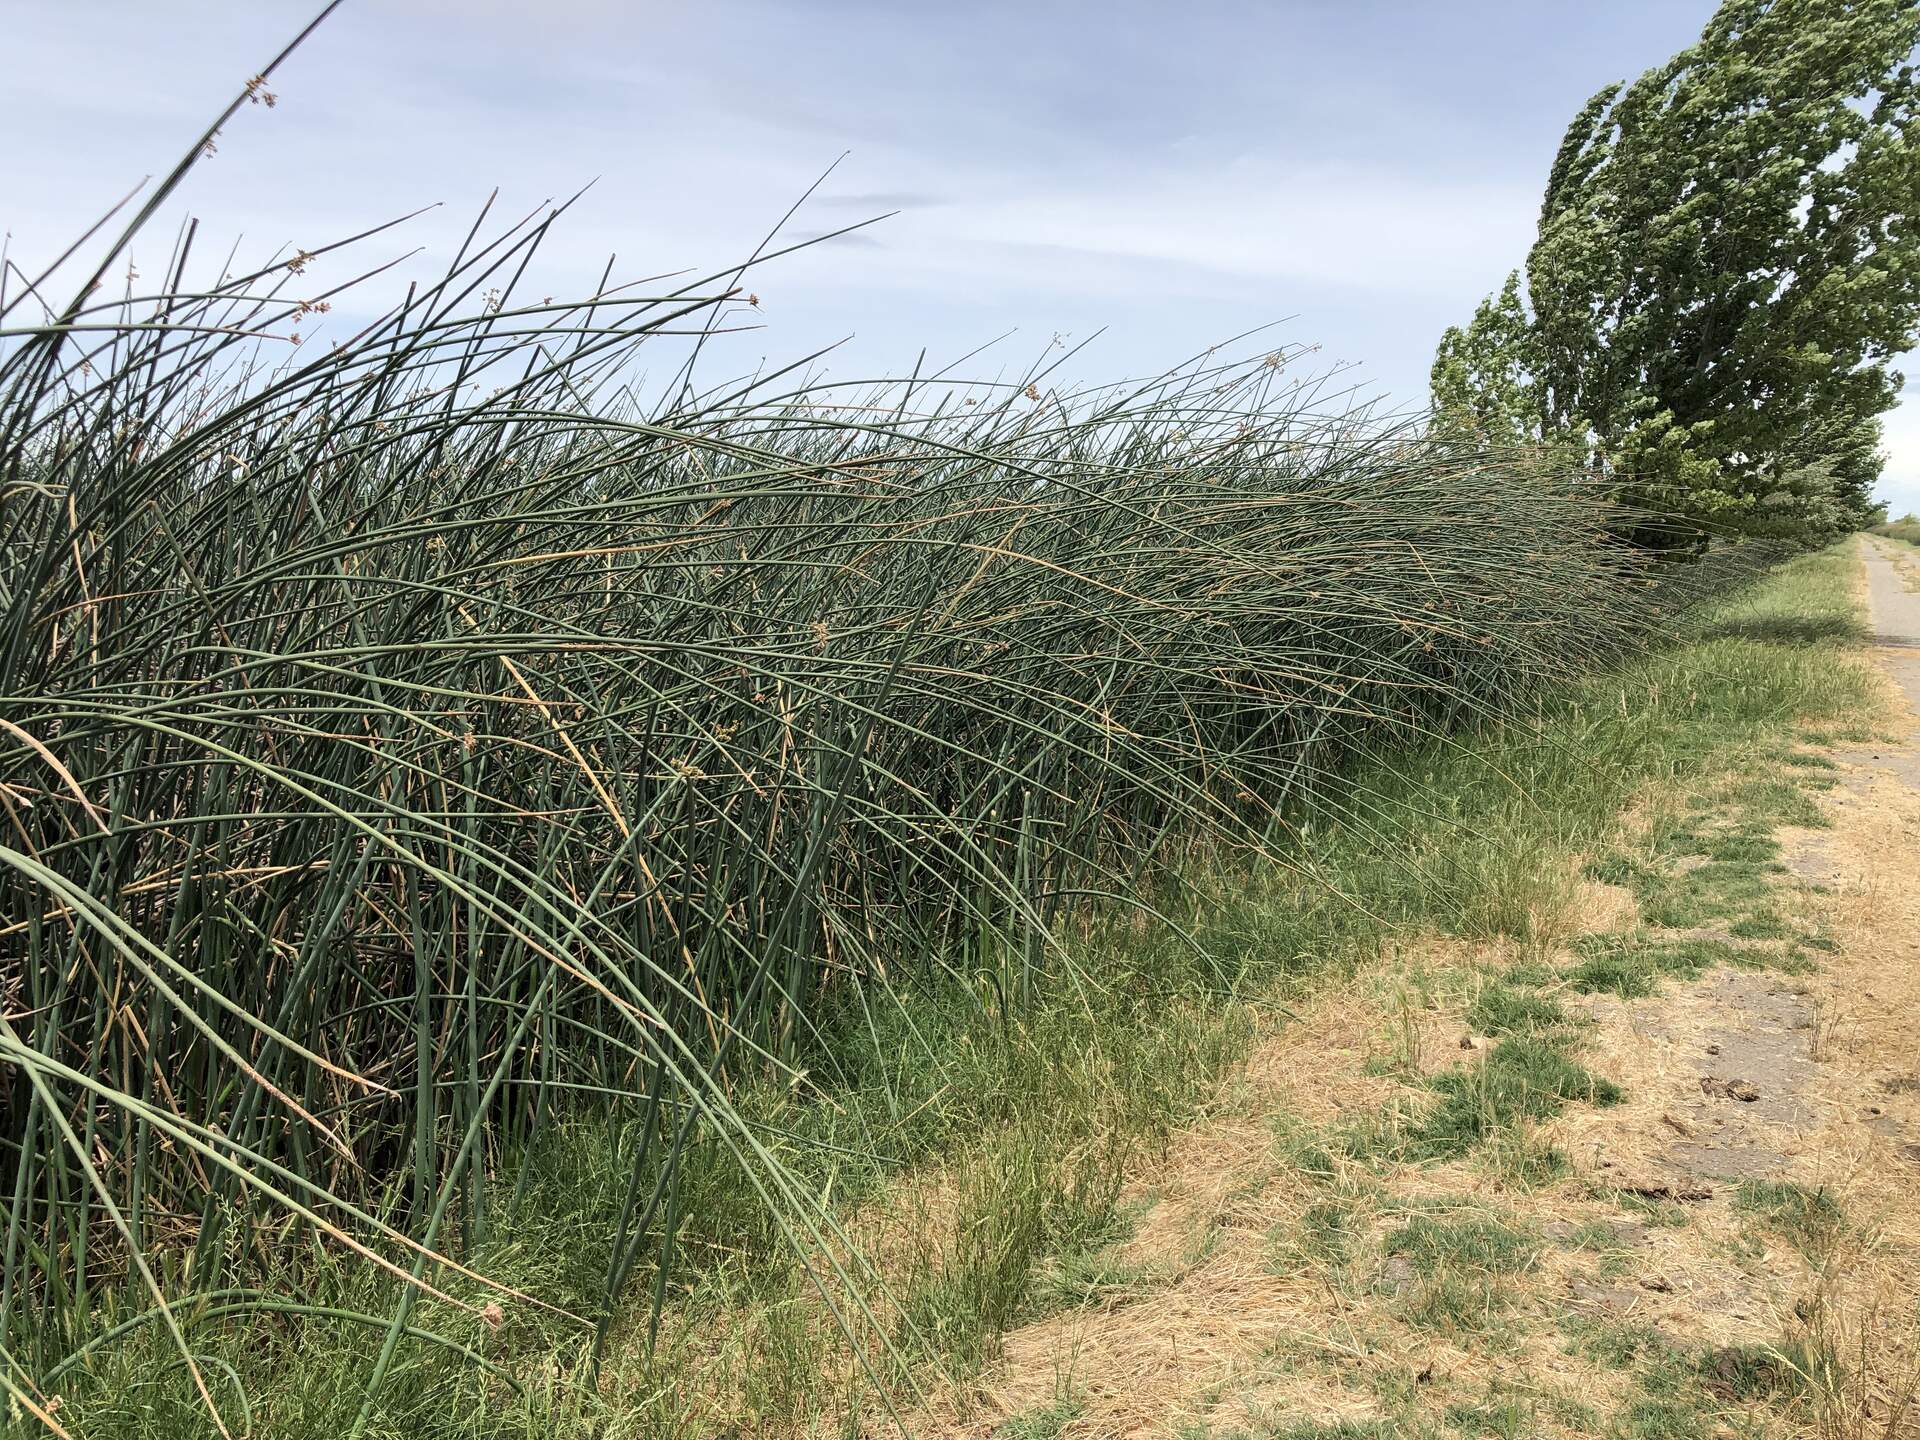
20240603EE_Tules2.jpg ( 2024-06-03 12:55:51 ) Full size: 1920x1440
Tules (Schoenoplectus acutus?) on the western edge of the gravel road leading up to East End tower
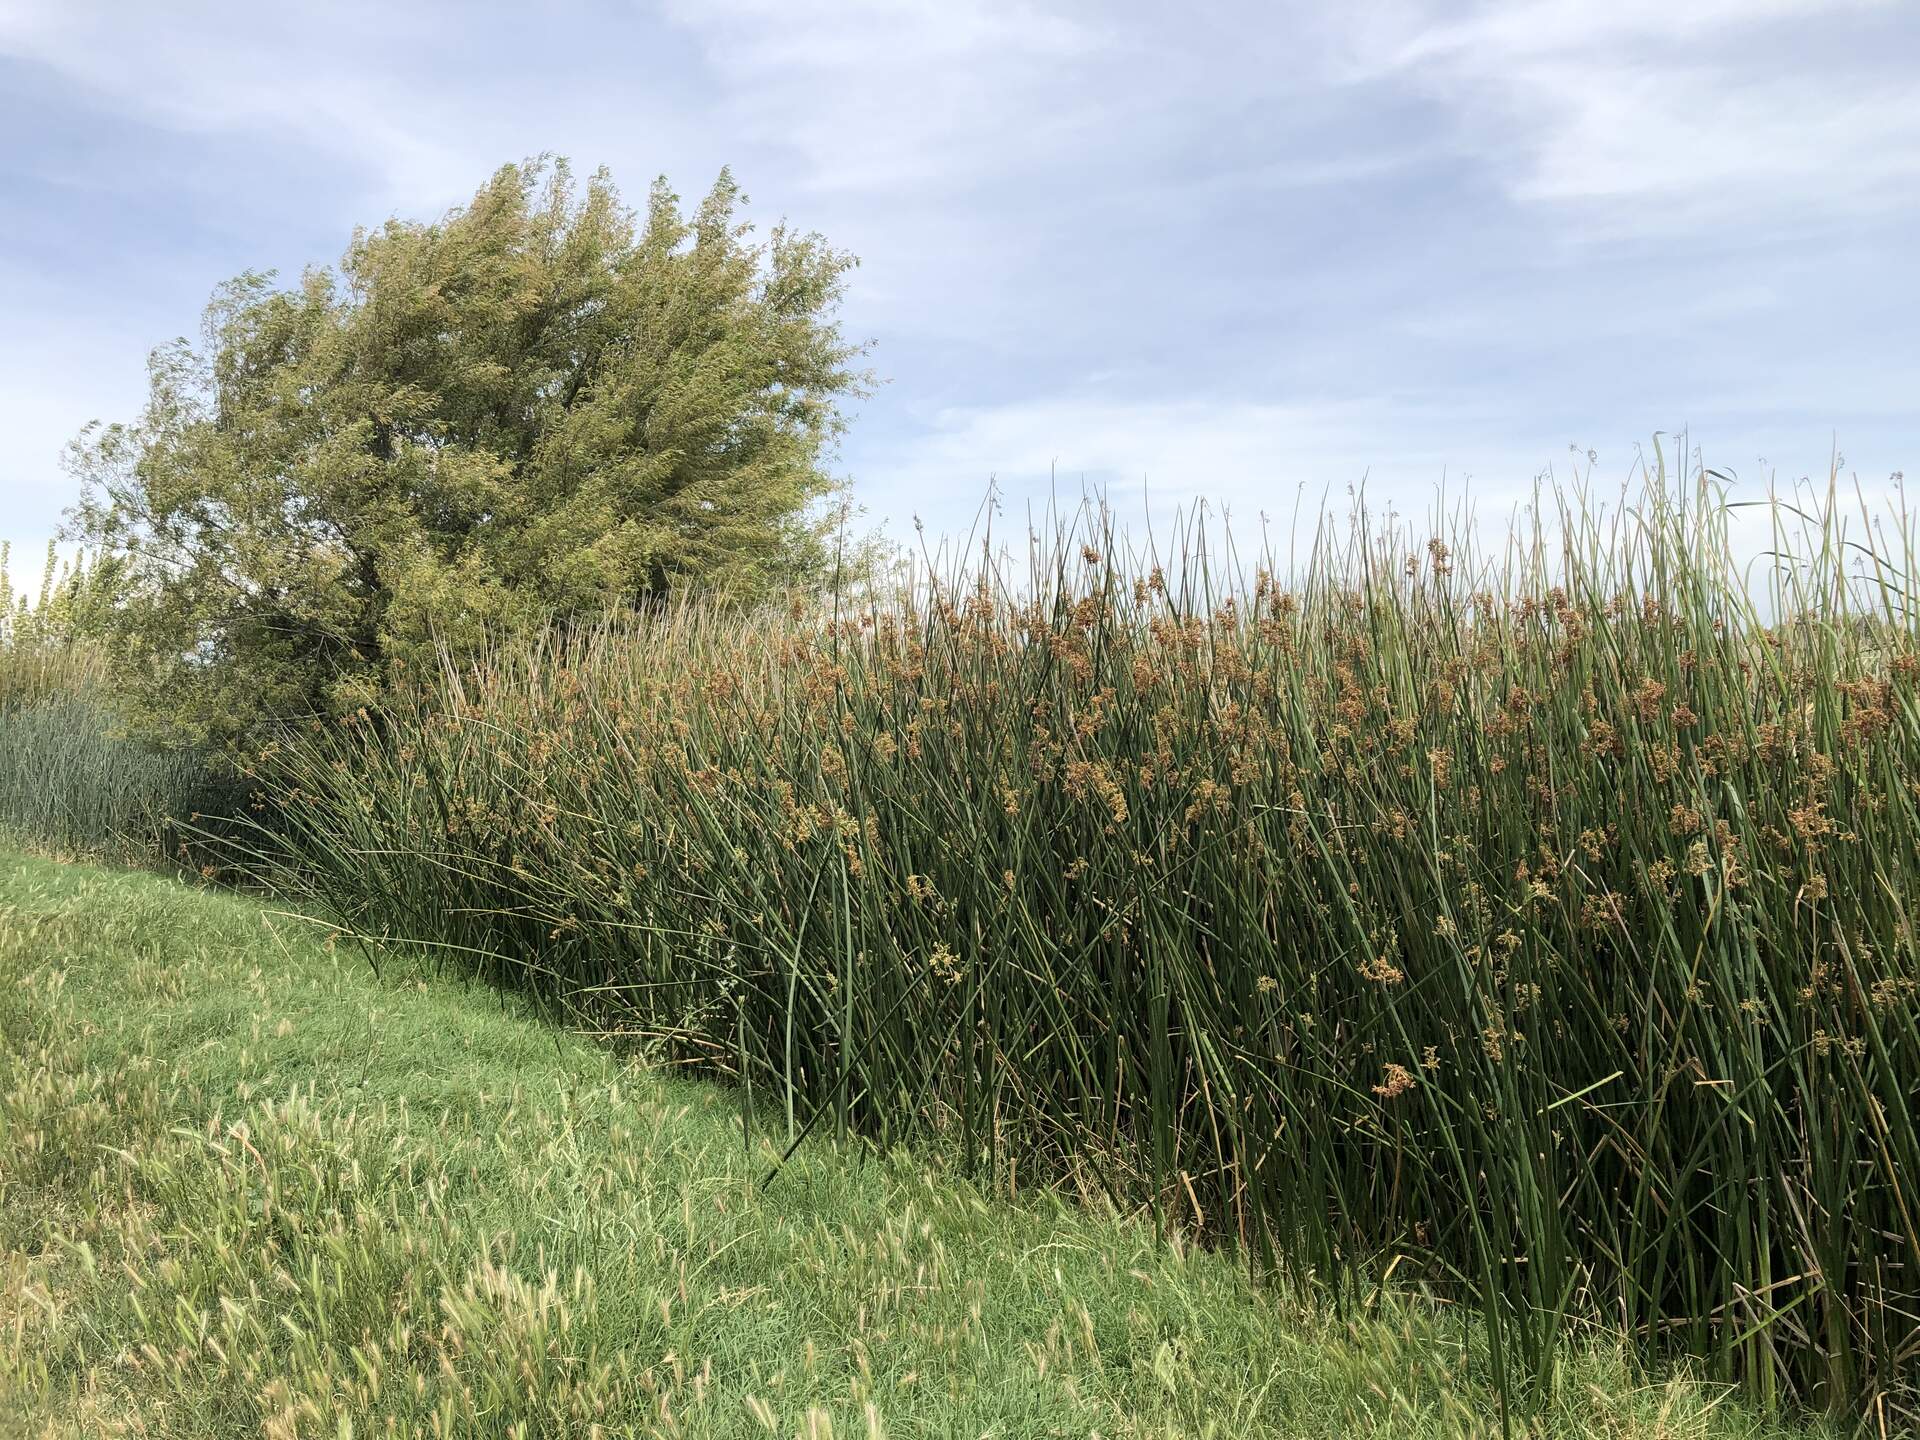
20240603EE_Tules1.jpg ( 2024-06-03 12:55:42 ) Full size: 1920x1440
A different type of tule (Schoenoplectus californicus?) on the eastern edge of the gravel road leading up to East End tower
11 sets found
14 EE_met graphs found
Can't check EE_mixed
1 EE_mixed graphs found
8 EE_flux graphs found
Can't check MBWPEESWGT_mixed
1 EE_cam graphs found
Can't check MBEEWPSWEPGT_cam
Can't check SIMBTWEE_met
Can't check EE_Temp
5 EE_Temp graphs found
Can't check EE_minidot
1 EE_minidot graphs found
Can't check MBSWEEWPBCBA
1 EE_processed graphs found