
Field Notes
<--2024-05-22 13:40:00 | 2024-06-19 10:40:00-->Other sites visited today: Vaira | Hill Slough
Phenocam link: Searching...
Tonzi: 2024-06-04 09:00:00 (DOY 156)
Author: Joe Verfaillie
Others: Daphne
Summary: Reinstalled IRTs, fixed lots of odds and ends, hot breezy day, midday water potential, All seems well
| Tonzi 2024-06-04 Daphne and I arrived at about 9:00 PDT – we are trying to beat the heat today. It was clear sunny and hot but with a nice breeze largely from the west. It is greener here than at Vaira. There are still many flowers. Some of the trees look kind of sparse but I don’t think they will be adding many more leaves. Jess from Davis was out later and had power problems with the SIF trailer. I worked on reinstalling the IRT sensors. I raised the upper sensor mount by about 15cm and extended it farther over the tree by about 15cm. The cables were a little bit shorter so the data logger box had to go higher on the tripod which made wiring it a pain but reachable. I think I got the sensors in the correct ports but need to check. I’m pretty sure the sensors went in the correct places because the bottom one had new cable right up to the back of the sensor. But the serial number from the previous notes don’t match and the serial numbers in the program don’t match the sensors on the tower. It connected and transferred data to the Tower computer though. Installed IRT sn 1964 top, channels 1 and 2 IRT sn 1965 bottom, channels 5 and 6 CR1000 sn 66249 Radio sn 32468 Daphne did the soil moisture, wells and dendrometer readings. She also collected all the point dendrometer data from the HISE and TOMST sensors. She collected the Floor and Tower eddy data. The Tower read: 414.4ppm CO2, 533.5mmol/m3 H2O, 31.9C, 98.5kPa, 101.1SS – 104 after cleaning The Floor read: 428.4ppm CO2, 704.1mmol/m3 H2O, 29.0C, 98.8kPa, 101.3SS She cleaned spider webs off both sets of eddy sensors and cleaned the tower radiometers. Daphne collected the FD chamber data and serviced the zcams. Zcam1 had a full set of images this time. There are chew marks in that cable though. I should probably splice out the chewed section. I tied up a bunch of other loose ends: fastened pluggable power strips in power box, fished the SoilVue cable through the conduit, added two fence post to a couple of long spans in the tower fence, fixed the dendrometer on tree 102, added a lid to the junction box on the Floor well. I did leaf water potential just before midday. We left at about 13:30 PDT |
Field Data
No tank data
Well Depth
| Date | Location | Depth (feet) |
|---|---|---|
| 2024-06-04 | VR_well | 53.32 |
| 2024-06-04 | TZ_floor | 18.56 |
| 2024-06-04 | TZ_tower | 23.01 |
| 2024-06-04 | TZ_road | 28.09 |
| 2024-06-04 | HS | 5.5 |
No TZ Moisture Point data found
No VR Moisture Point data found
No TZ grass heigth found
No VR grass heigth found
Tree DBH
| Date | Tag# | Reading (mm) |
|---|---|---|
| 2024-06-04 | 1 | 23.7 |
| 2024-06-04 | 102 | 5.3 |
| 2024-06-04 | 102 | 84.5 |
| 2024-06-04 | 102 | 5.3 |
| 2024-06-04 | 2 | 17.0 |
| 2024-06-04 | 245 | 11.5 |
| 2024-06-04 | 3 | 9.1 |
| 2024-06-04 | 4 | 11.4 |
| 2024-06-04 | 5 | 20.8 |
| 2024-06-04 | 6 | 8.9 |
| 2024-06-04 | 7 | 16.6 |
| 2024-06-04 | 72 | 10.0 |
| 2024-06-04 | 79 | 8.4 |
Water Potential - mode: raw
| Time | Species | Tree | readings (bar) | ||
|---|---|---|---|---|---|
| 2024-06-04 11:30:00 | OAK | 102 | -25 | -22 | -22 |
| 2024-06-04 11:30:00 | OAK | 92 | -32 | -32 | -30 |
No TZ Grass Biomass data found
No TZ OakLeaves Biomass data found
No TZ PineNeedles Biomass data found
2 photos found
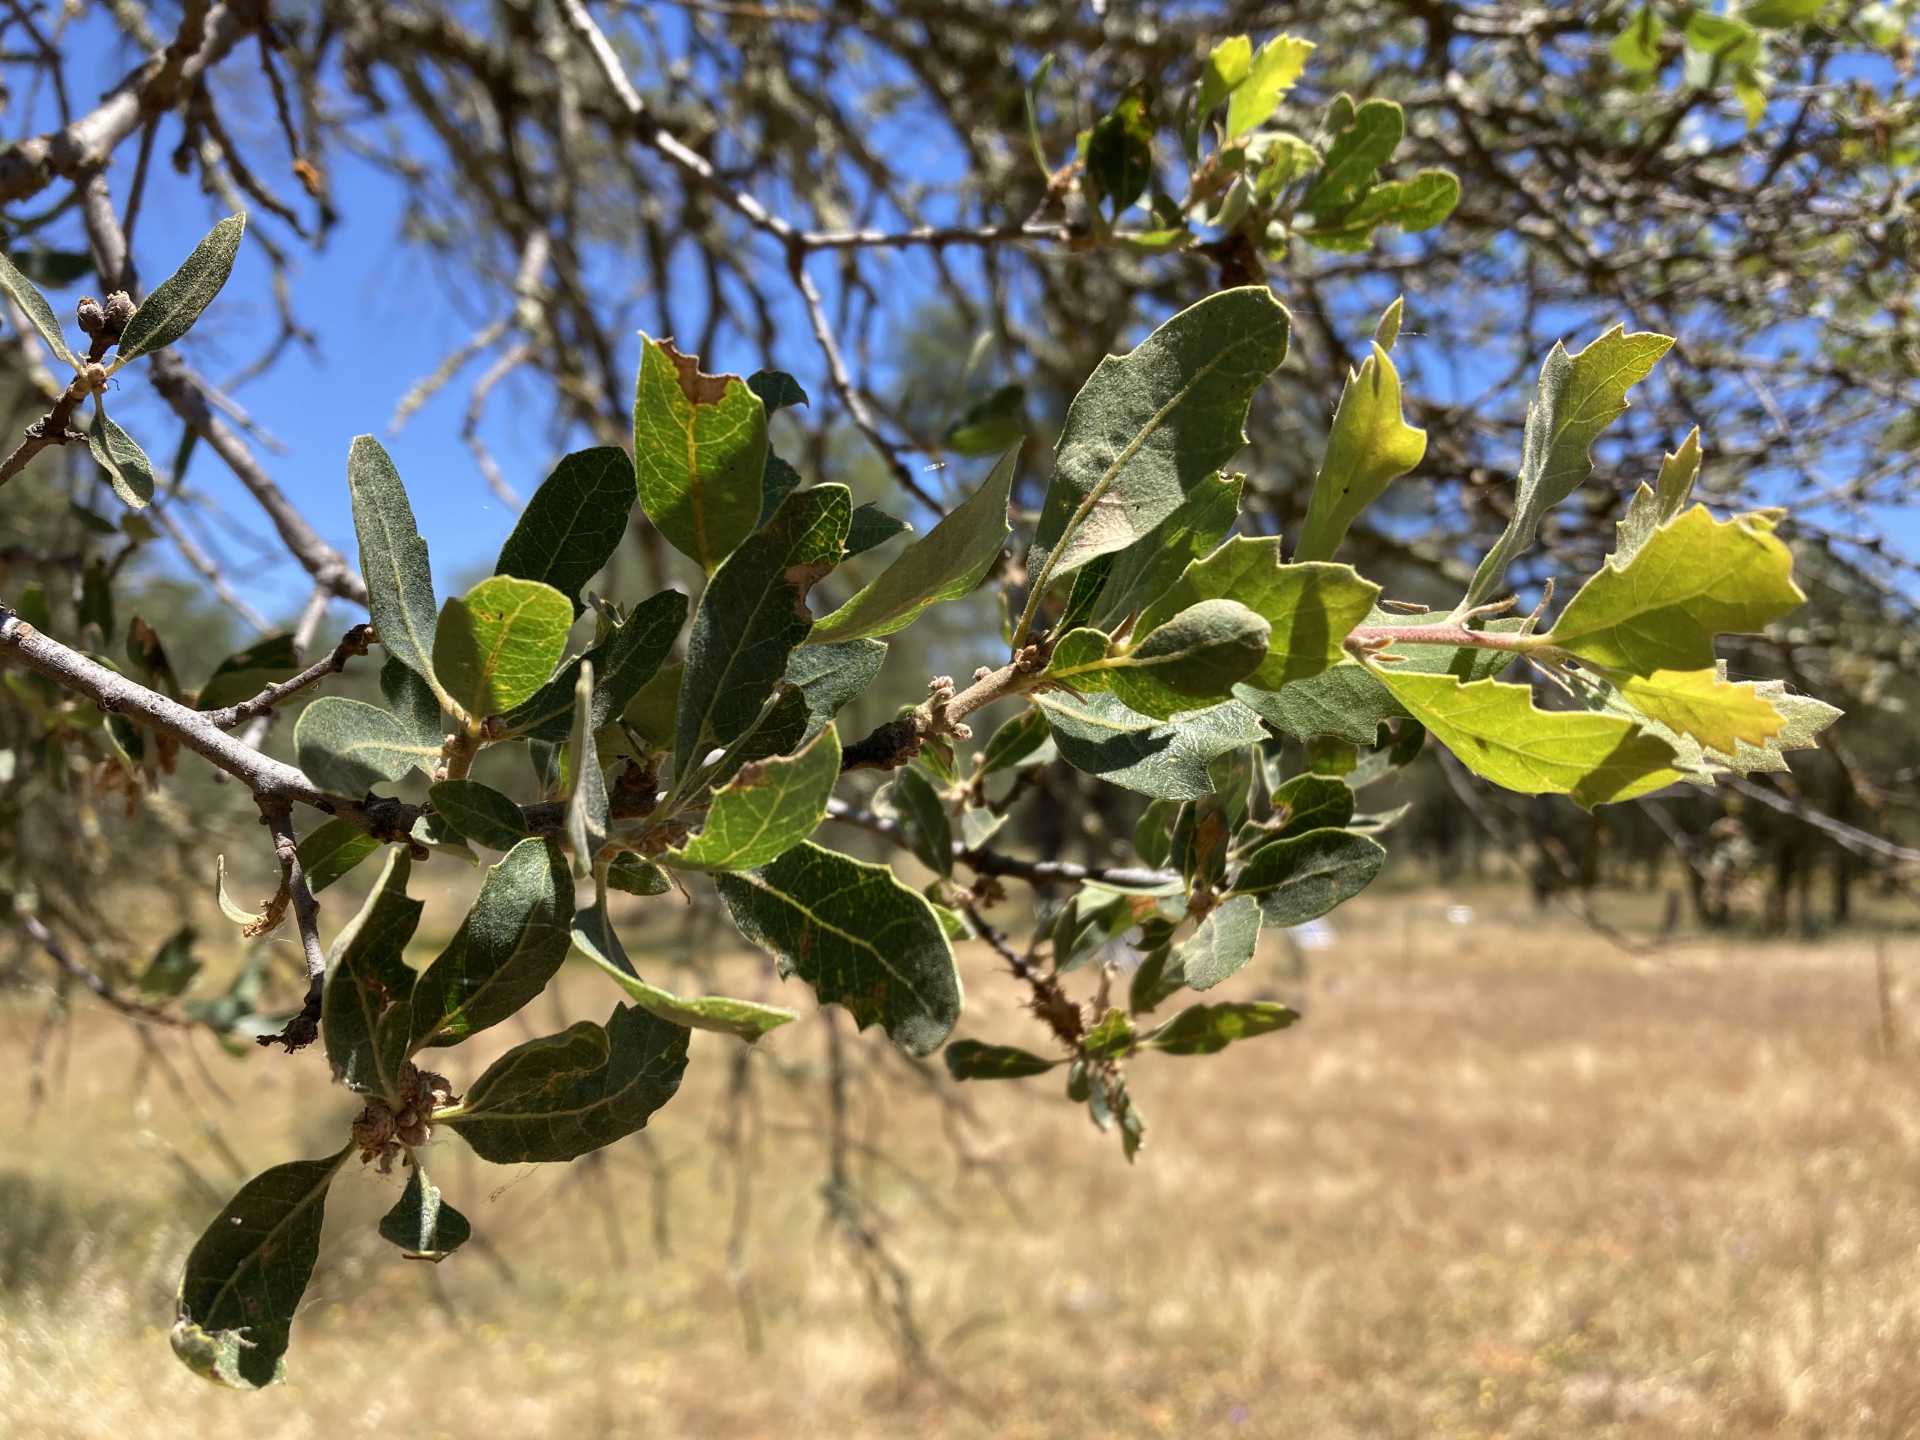
20240604TZ_OldNewOakLeaves.jpg ( 2024-06-04 12:40:31 ) Full size: 4032x3024
Green oak leaves on tree
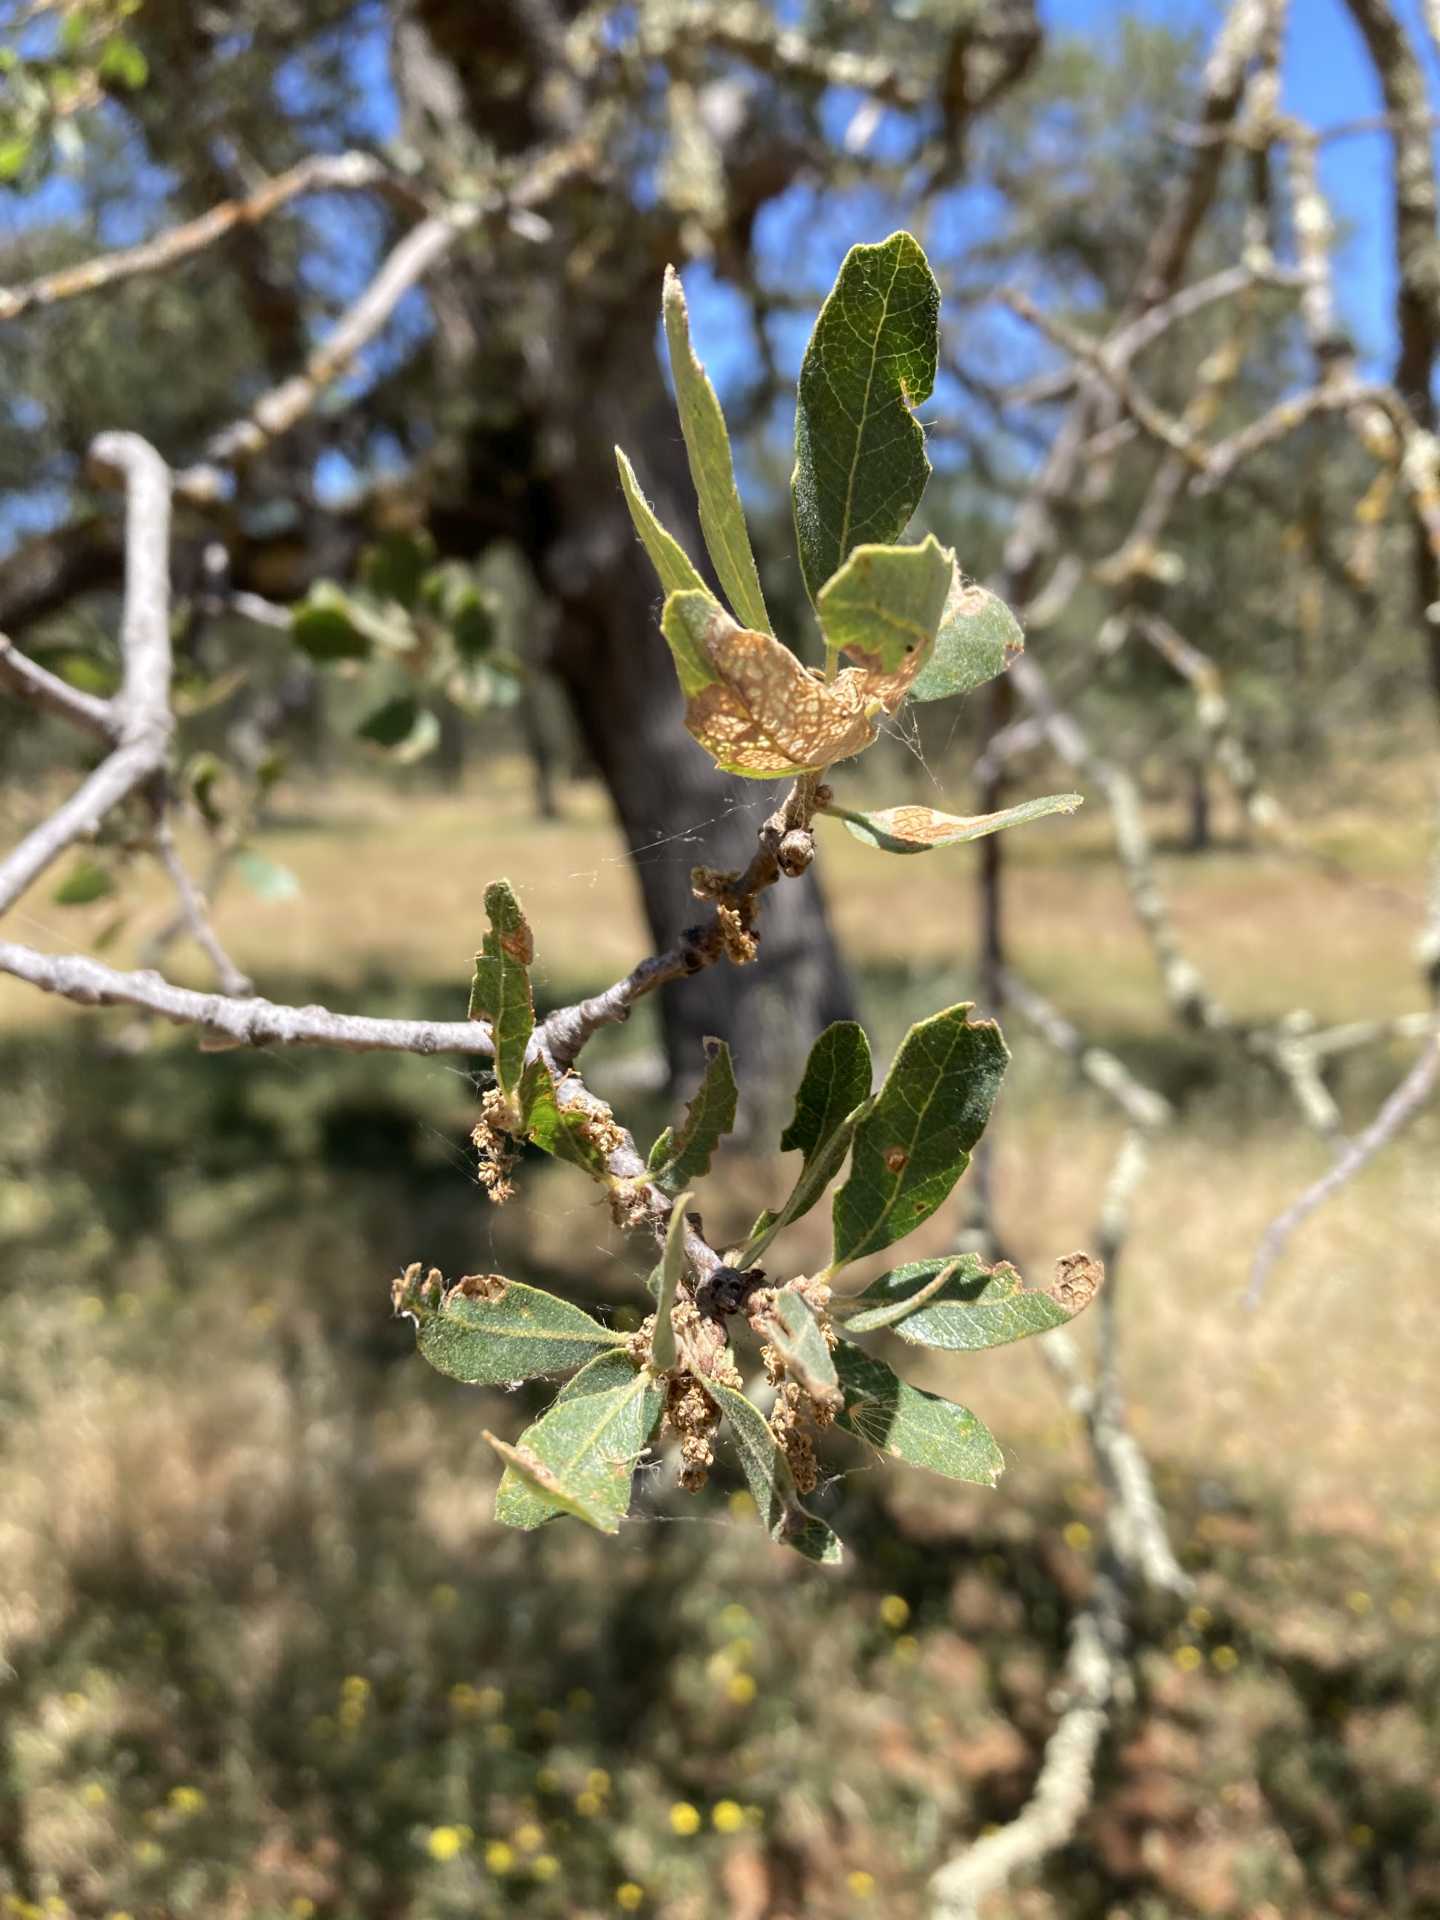
20240604TZ_OldDamagesLeaves.jpg ( 2024-06-04 12:40:40 ) Full size: 4032x3024
Damaged oak leaves on the tree
16 sets found
No data found for TZ_Fenergy.
11 TZ_tmet graphs found
No data found for TZ_soilco2.
Can't check TZ_mixed
3 TZ_mixed graphs found
1 TZ_fflux graphs found
8 TZ_fmet graphs found
No data found for TZ_tram.
3 TZ_co2prof graphs found
No data found for TZ_irt.
No data found for TZ_windprof.
1 TZ_tflux graphs found
8 TZ_sm graphs found
Can't check TZ_met
1 TZ_met graphs found
Can't check TZVR_mixed
8 TZ_osu graphs found
3 TZ_fd graphs found
Tonzi Z-cam data