Field Notes
<--2024-05-01 12:45:00 | 2024-05-22 09:15:00-->Other sites visited today: Hill Slough | Bouldin Alfalfa
Phenocam link: Searching...
Bouldin Corn: 2024-05-16 10:25:00 (DOY 137)
Author: Daphne Szutu
Others: Dennis
Summary: Sprouting corn, prep for moving tower closer to corn, dfPAR motor stopped working--fixed?
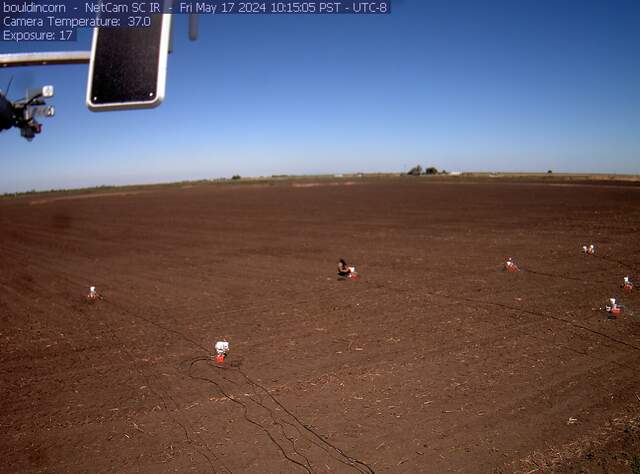
| 2024-05-16 Bouldin Corn Dennis and I arrived at 10:25 PST (11:25 PDT). It was mild and breezy, much more comfortable than the insistent wind at Hill Slough. Charlotte had 18 chambers out in the field. There are tiny corn plants coming up. The closest corn to our tower is at least 1m away. Joe and I will plan to move the tower right up against the corn next week. We'll move the soil sensors and install the zcams then as well. To prep, Dennis cleared the soil around the scaffolding feet. The feet were about 10cm underground--it's been a few years since we moved the tower. Dennis also dug up some thistles on the side of the road. I downloaded met, cam, USB GHG, and PA data. dfPAR has not been working for the past ~10 days and the shadowband was not turning. I got out of the voltmeter and confirmed that the motor was getting 11.95V. The motor started spinning as I was checking its wiring, and I noticed the solder joint between the motor and the red wire is fraying. Maybe I can bring a new motor next time. I changed the 7700 heater to summer hours: previously, the heater turned on from 18:00 to 08:00, now the heater will turn on from 20:00 to 06:00. I topped off the wash reservoir and cleaned flux and rad sensors. The 7500 read: 399ppm CO2, 753mmol/m3 H2O, 20.7C, 101.3kPa, 96SS –100 after cleaning The 7700 read: 2.0ppm CH4, 44RSSI – 79 after cleaning For moving the tower next time: -post pounder for fence post -extra post for Charlotte's box (currently u-bolted to our tower) -pilot rod for thermocouples We left at 10:55 PST (11:55 PDT). |
1 photos found

bouldincorn_2024_05_17_101505.jpg ( 2024-05-17 18:16:58 ) Full size: 1296x960
Charlotte working on chambers in tilled field
6 sets found
17 BC_met graphs found
5 BC_flux graphs found
Can't check TATWBABCSB_cam
Can't check MBSWEEWPBCBA
2 BC_pa graphs found
1 BC_arable graphs found

