Field Notes
<--2024-02-16 10:45:00 | 2024-03-07 13:10:00-->Other sites visited today: Vaira | Hill Slough
Phenocam link: Searching...
Tonzi: 2024-02-27 13:30:00 (DOY 58)
Author: Joe Verfaillie
Others: Daphne
Summary: Reinstalled Tower CO2 profile, reinstalled zcam1, rerouted/repaired cable, Add new HYGROVUE RH/T will compare with old HMP45 at Floor, New Floor met program update of RevBow calculations, fixed ptden clocks.
| Tonzi 2024-02-27 Daphne and I arrived at about 13:30. It was mild and sunny and super clear. I could see Mount Diablo and the costal range from the Tower top. The grass is really green and expansive. The roads are a bit dryer and the pond has come up some but not full yet. There is more rain coming in the next few days. Cows destroyed the fence around the tower, but didn’t seem to mess with anything. We repaired the fence. The battery leads had rotted off again. I repaired those and the fence was working but just barely. It needs a new battery. I worked on putting the CO2 profile system back on the tower. I put all four GMP343 sensors back: Bottom sn N2220007 Low-mid sn N2210010 Hi-mi, sn N2210009 Top sn N2220008 The bottom one got a new cable and I had to reinstall the cable for the top one that I tested in the lab. I drilled larger holes on their plastic shrouds and added a stainless steel washer so the connectors screw on more completely. They all seemed to work without changes to the program. I also fixed a broken wire on their RH/T fan. Daphne added a new HYGROVUE RH/T sensor sn E5736 next to the Floor HMP45 that has depressed high end RH. I updated the Floor program moving the old data to variables called old_1 and old_2, and put the new data in the existing variables. I also tried to update the RevBow stats to fix the problem where RH was included in the q calculation twice. I tried to save q both with and without the extra RH. I collected the Tower top flux and camera data. I added new desiccant to the BF5 diffuse PAR. The 7500 read: 423.6ppm CO2, 204.2mmol/m3 H2O, 15.2C, 99.1kPa, 99.8SS Daphne did all the soil moisture, DBH and well measurements. She also collected the Floor flux, both wells and FD data. The 7500 read: 425.5ppm CO2, 263.6mmol/m3 H2O, 16.9C, 99.2kPa, 99.7SS Daphne put zcam-1 back in its box but notice that the cable was broken and rotted. I pulled the cable out of the trees and ran it across the ground mostly in conduit – there’s a section near the tower that still needs protection (split loom?). I drilled a new hole in the box and wired it directly to the power converter and rely instead of using the RJ45 connector. I was testing the camera when the data logger started taking a photo. It seemed to be working. Daphne fixed the clocks on the point dendrometers (except Tree 1 I did last week) and collected all their data. The clocks have been using Pacific Daylight Time ever since they were install. The clocks were set back one hour. The cows also got in around the Floor solar panels. They knocked over the surface temperature cal panel and broke a corner of it. We tried to put the fence wire back up but it was a half-assed job. We left at about 17:15 |
Field Data
No tank data
Well Depth
| Date | Location | Depth (feet) |
|---|---|---|
| 2024-02-27 | HS | 3.65 |
| 2024-02-27 | VR_well | 55.1 |
| 2024-02-27 | VR_pond | 21.94 |
| 2024-02-27 | TZ_floor | 24.48 |
| 2024-02-27 | TZ_tower | 27.93 |
| 2024-02-27 | TZ_road | 32.55 |
No TZ Moisture Point data found
No VR Moisture Point data found
No TZ grass heigth found
No VR grass heigth found
Tree DBH
| Date | Tag# | Reading (mm) |
|---|---|---|
| 2024-02-27 | 1 | 20.5 |
| 2024-02-27 | 102 | 9.6 |
| 2024-02-27 | 2 | 16.1 |
| 2024-02-27 | 245 | 9.7 |
| 2024-02-27 | 3 | 3.2 |
| 2024-02-27 | 4 | 9.0 |
| 2024-02-27 | 5 | 17.7 |
| 2024-02-27 | 6 | 7.9 |
| 2024-02-27 | 7 | 15.5 |
| 2024-02-27 | 72 | 6.4 |
| 2024-02-27 | 79 | 7.0 |
No water potential data found
No TZ Grass Biomass data found
No TZ OakLeaves Biomass data found
No TZ PineNeedles Biomass data found
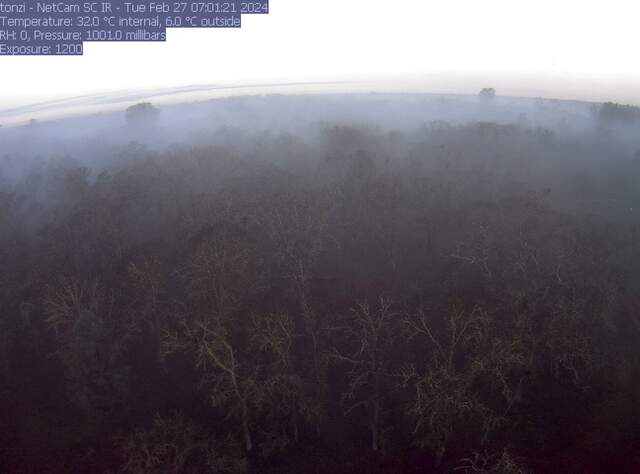
1 photos found

tonzi_2024_02_27_070116.jpg ( 2024-02-27 14:59:36 ) Full size: 1296x960
Fog in the tree tops
16 sets found
No data found for TZ_Fenergy.
11 TZ_tmet graphs found
No data found for TZ_soilco2.
Can't check TZ_mixed
3 TZ_mixed graphs found
1 TZ_fflux graphs found
8 TZ_fmet graphs found
No data found for TZ_tram.
3 TZ_co2prof graphs found
1 TZ_irt graphs found
No data found for TZ_windprof.
1 TZ_tflux graphs found
8 TZ_sm graphs found
Can't check TZ_met
1 TZ_met graphs found
Can't check TZVR_mixed
8 TZ_osu graphs found
3 TZ_fd graphs found
Tonzi Z-cam data

