
Field Notes
<--2024-02-27 13:30:00 | 2024-03-26 12:35:00-->Other sites visited today: Gilbert Tract | Vaira
Phenocam link: Searching...
Tonzi: 2024-03-07 13:10:00 (DOY 67)
Author: Joe Verfaillie
Others: Daphne, Ngoc
Summary: Added solar panels to Hise ptden, added for new TOMST ptden, Fixed cable on SHF plate, did regular data collection
| Tonzi 2024-03-07 Daphne, Ngoc and I arrived at about 13:10. This is mostly a maintenance trip but we are also collecting all the data to reduce the work load next week. It was mostly sunny and cool with just a few clouds fleeing to the east. The ground is still very wet. I saw a few wild flowers but no signs of the trees beginning to put on leaves. Daphne did most of the regular data collection and Ngoc helped with the soil moisture and wells. Zcam1 was tilted (but I didn’t notice the images being tilted) and its clock reset. Needs a new clock battery next time. The Tower read: 427.2ppm CO2, 456.5mmol/m3 H2O, 16.7C, 98.9kPa, 99.7SS The Floor read: 434.0ppm CO2, 471.4mmol/m3 H2O, 16.6C, 99.1kPa, 99.5SS I added old Arable solar panels to the Hise point dendrometers 2-5. They all had charging LEDs lit. Then I worked on adding new TOMST dendrometers to other trees. It was hard to figure out how much bark to shave off. A big pine had really thick bark and I think I went too deep on oak 102. I put on four of the seven TOMST dendrometers. I’ll see how these go and decide what to do with the rest. I put up Cluster tree 5: TOMST sn 92243045, DBH = 13.75cm Water Potential Tree 102: TOMST sn 92243043, DBH = 27.36cm Mature Pine 11833 near Cluster Tree 7: TOMST sn 92243042, DBH = 59.91cm – This tree is at an angle, the DBH I measured was horizontal so more of an ellipse. Liukang’s Tree – ancient Oak water potential Tree 92: TOMST sn 92243044, DBH = 74.96cm I also measured a couple of pines that show up in the leaf water potential data: Yng Pine = 9.87cm Old Pine = 70.35cm – this pine has a huge indented scar on its south side Tree to the NW of 245 is tree 129 The cow fence around the main tower was working so I did not swap its battery. I should still probably redo the connections and seal them. The cow fence around the soil co2 site was broken and the Tree1 FD was on its side. Daphne fixed the FD chamber and I fixed the fence. I added a strand of barbed wire to the fence around the Floor solar panels. Daphne worked on replacing the cable of SHF plate 1 sn 000138. The insulation was all rotten. The plate was 2-5cm below the surface – it was tilted and ground surface was not very flat. We put it back at 3cm and the new cable in conduit. I move SHF plate 4 sn 00068 back to -10cm like I found it a couple weeks ago. We left at around 16:30 |
Field Data
No tank data
Well Depth
| Date | Location | Depth (feet) |
|---|---|---|
| 2024-03-07 | VR_well | 53.6 |
| 2024-03-07 | TZ_floor | 22.8 |
| 2024-03-07 | TZ_road | 30.67 |
| 2024-03-07 | TZ_tower | 26 |
No TZ Moisture Point data found
No VR Moisture Point data found
No TZ grass heigth found
No VR grass heigth found
Tree DBH
| Date | Tag# | Reading (mm) |
|---|---|---|
| 2024-03-07 | 1 | 20.6 |
| 2024-03-07 | 102 | 10.8 |
| 2024-03-07 | 2 | 16.2 |
| 2024-03-07 | 245 | 10.5 |
| 2024-03-07 | 3 | 7.4 |
| 2024-03-07 | 4 | 9.3 |
| 2024-03-07 | 5 | 18.0 |
| 2024-03-07 | 6 | 7.9 |
| 2024-03-07 | 7 | 15.8 |
| 2024-03-07 | 72 | 6.8 |
| 2024-03-07 | 79 | 7.1 |
No water potential data found
No TZ Grass Biomass data found
No TZ OakLeaves Biomass data found
No TZ PineNeedles Biomass data found
1 photos found
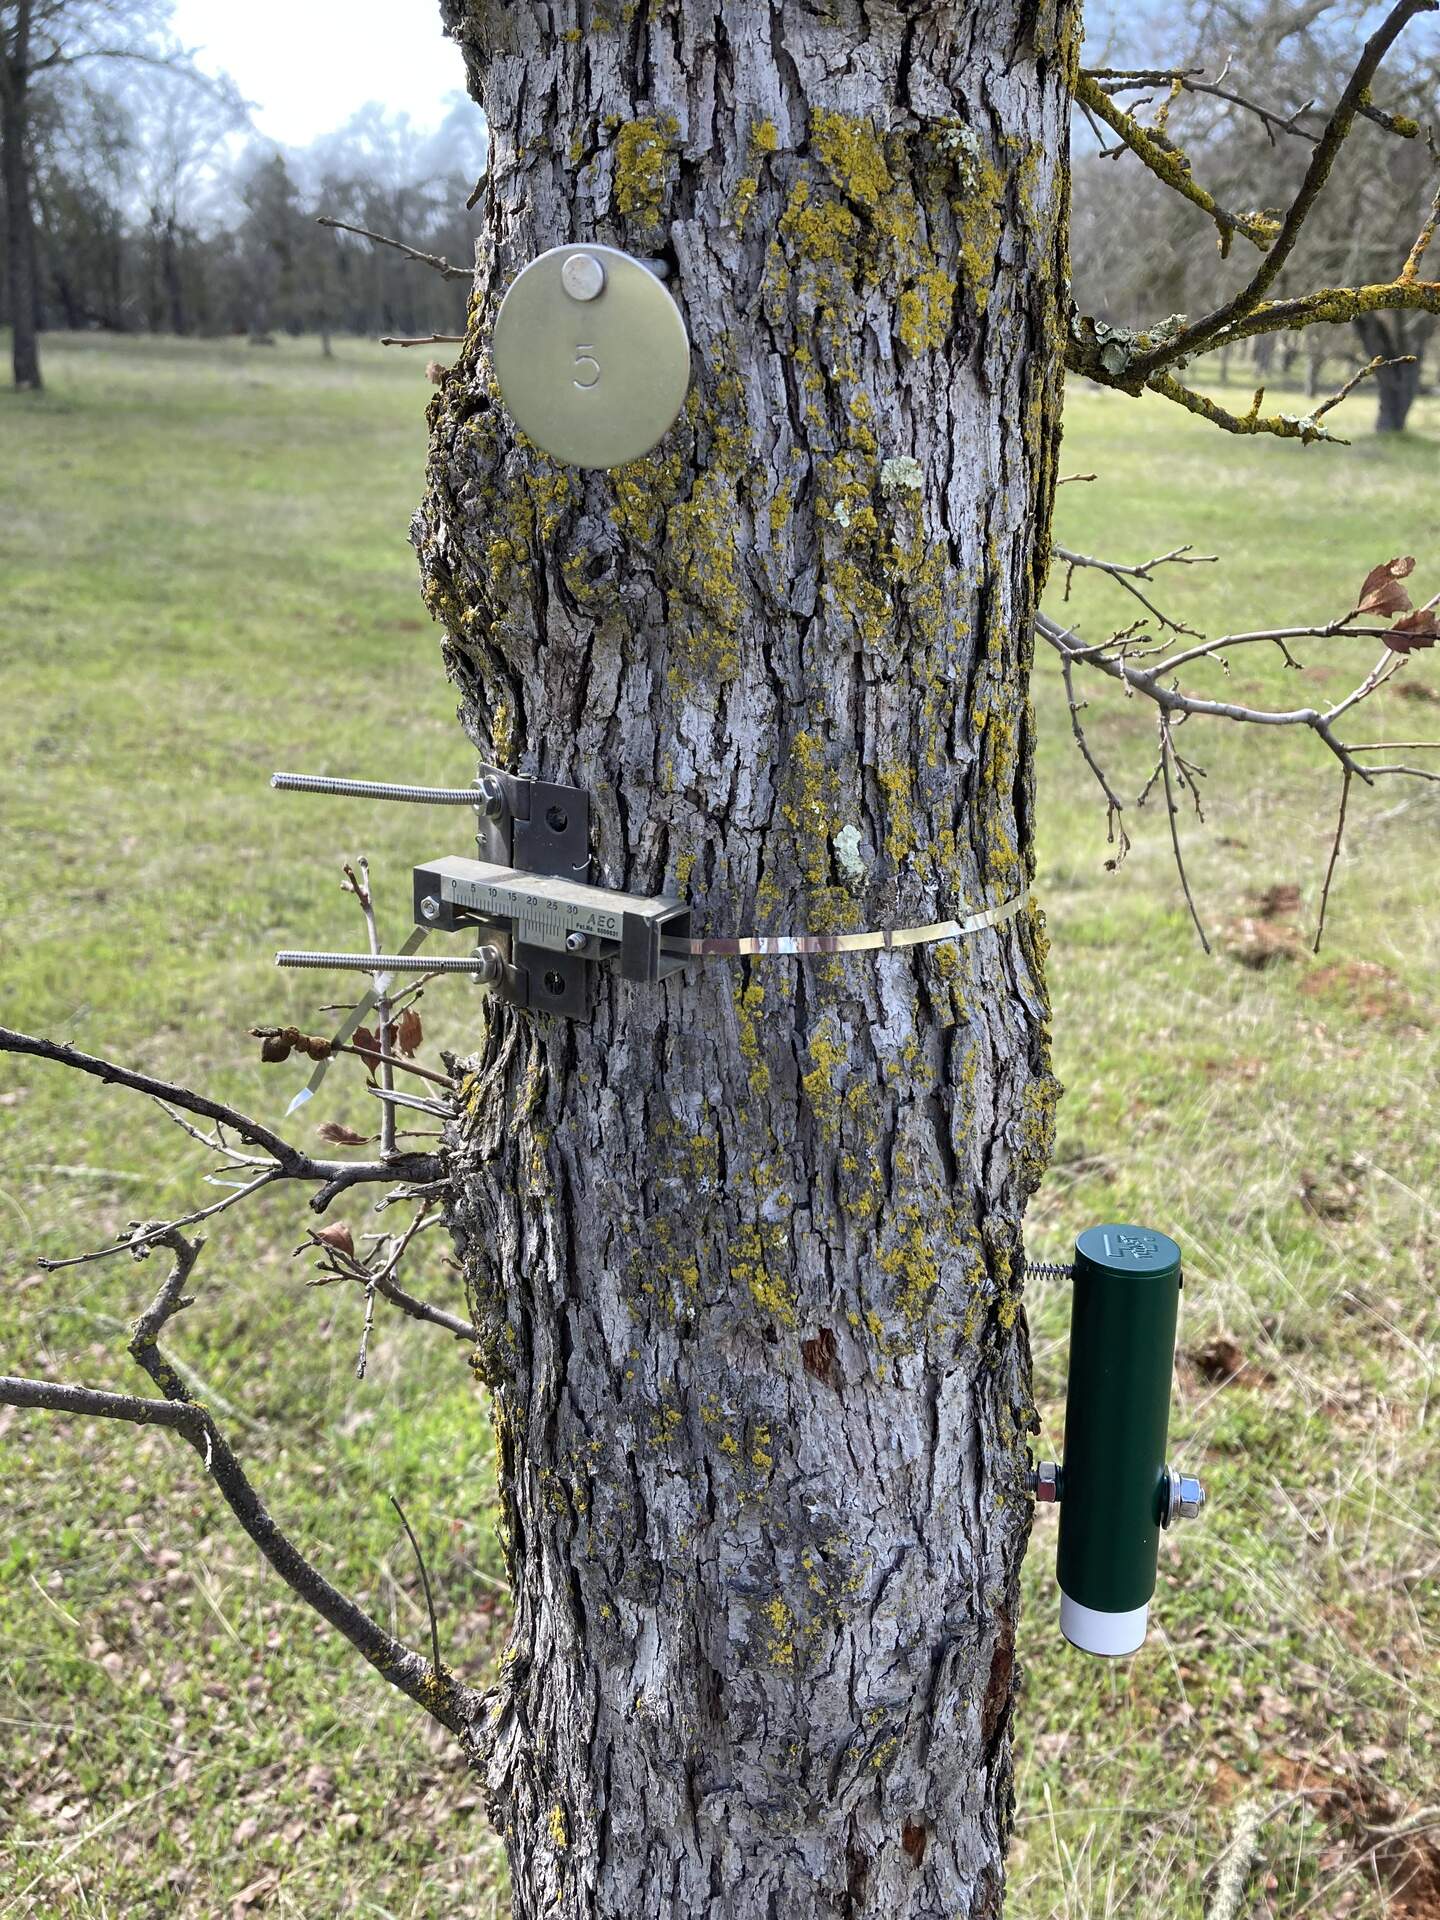
20240307TZ_TomstPointDendrometer.jpg ( 2024-03-07 13:52:17 ) Full size: 1440x1920
One of four new TOMST point dendrometers installed at Tonzi
16 sets found
No data found for TZ_Fenergy.
11 TZ_tmet graphs found
No data found for TZ_soilco2.
Can't check TZ_mixed
3 TZ_mixed graphs found
1 TZ_fflux graphs found
8 TZ_fmet graphs found
No data found for TZ_tram.
3 TZ_co2prof graphs found
1 TZ_irt graphs found
No data found for TZ_windprof.
1 TZ_tflux graphs found
8 TZ_sm graphs found
Can't check TZ_met
1 TZ_met graphs found
Can't check TZVR_mixed
8 TZ_osu graphs found
3 TZ_fd graphs found
Tonzi Z-cam data