Field Notes
<--2010-11-12 10:00:00 |
2010-12-09 09:00:00-->
Other sites visited today:
Twitchell Rice |
Vaira |
Tonzi |
Tonzi
Phenocam link:
Searching...Tonzi: 2010-11-12 10:00:00 (DOY 316)
Author: Siyan Ma
Others: Joe
Summary: regular check; new soil moisture probes installed at Vaira
When:
Date and Time
When: Date: 11/12/2010 , Day: 316
, Watch Time: 10:00 am .
Where: Tonzi/Vaira Ranch
Who: Siyan and Joe
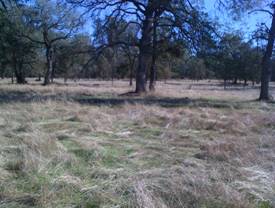
Weather: nice, clear day
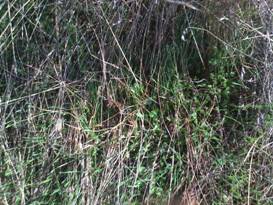
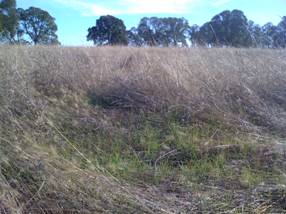
Phenology: green grass, some oak leaves still green
Summary
- check and download data at Tower, Floor, and Vaira
- Joe swapped a new pump for the CO2 profile system and calibrated
Li-800 in the field.
- Joe installed three new soil moisture probes at Vaira,
but one of them was taken back because the forth channel always showed
41.4.
- collected grass samples for LAI.
- dendrometers
- soil moisture
- groundwater well:
Date
|
DOY
|
Location
|
Depth from the black thing (feet)
|
11/12/2009
|
316
|
Floor
|
29.24
|
|
|
Tower
|
34.00
|
|
|
roadside
|
36.92
|
Vaira_Grass Site
- Fence and gate power: 12 v.
- Panel and Batteries: -
v; - amps; - amps.
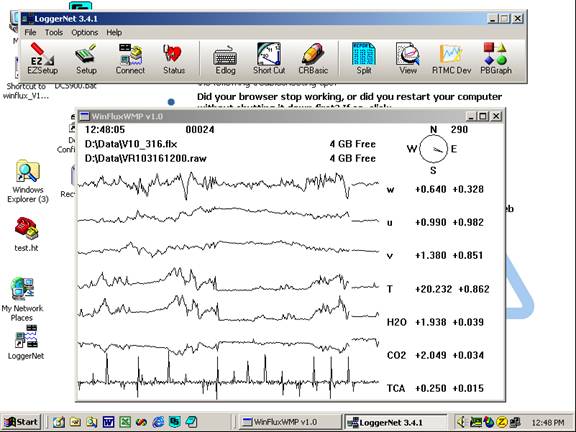
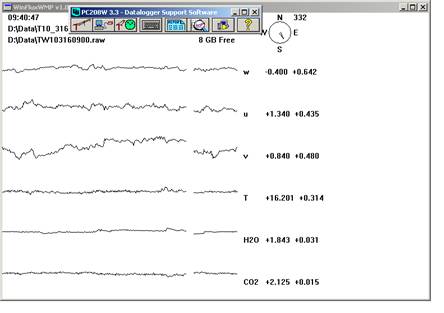
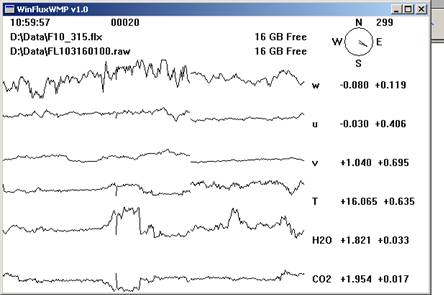
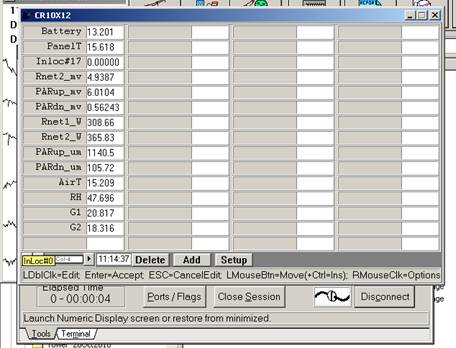
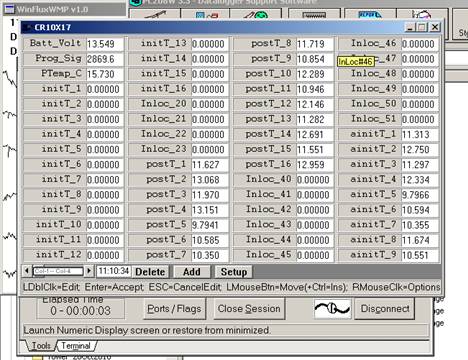
- Reading from Gillsonic screen before downloading data.
(The value of H2O and CO2 should be in the range of
0 – 5 v.)
- downloading data YES!
- Check the fans of air temp. and relative humidity sensors
at Vaira. YES!
- Check MD-9 system connections YES!
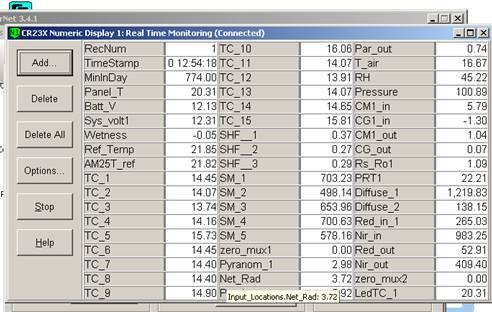
- Check CR23X with two multiplexers
- Check levels of Radiation sensors, clear up surfaces.YES!
- Check rain gage, make sure not clogged. YES!
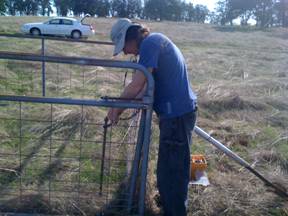
- Closed gate and set up fence. YES!
Tonzi_Tower Site
- Fence and gate power: 12 v.
- Panel and Batteries: 14.0
v; 0.0 amps; 3.6 amps.
- Reading from Gillsonic screen before downloading data.
(The value of H2O and CO2 should be in the range of
0 – 5 v.)
- downloading data YES!
- check the fans of air temp. and relative humidity sensors
on the tower and the floor. YES!
- Check rain gage, make sure not clogged. YES!
- Check calibration cylinders;
CO 2 1750 psig; flow 20 psi; 384.08
ppm.
N 2 1000 psig; flow 20 psi.
Manually calibrate Li-800. Following Ted’s
instruction: H:\IoneSavanna_2004\Tower_2004\CO2Profile\LI800_Calibration_Procedure_2Nov04.txt
Is the pump running Joe installed a new pump and calibrated Li-800 in the field.
- close gate and set up fence. YES!
Toniz_Floor Site
- Fence and gate power: 12
v.
- Panel and Batteries: 13.3
v; 15.4 amps;
2.0 amps. (about 7:00 am local
time)
- Reading from Gillsonic screen before downloading data.
(The value of H2O and CO2 should be in the range of
0 – 5 v.)
- downloading data YES!
- Check MD-9 system connections YES!
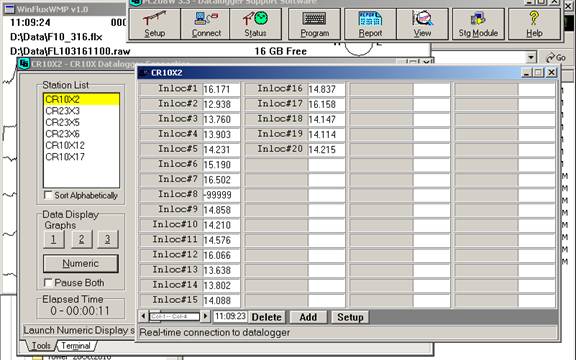
CR10X2 – floor-Met
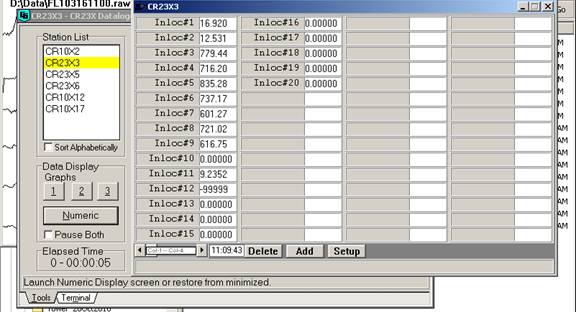
CR23X3 – floor-Met
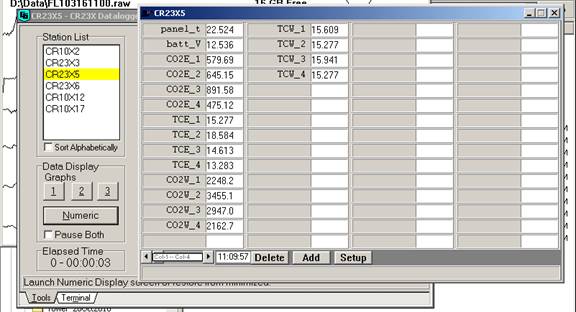
CR23X5 – soil CO 2
profile
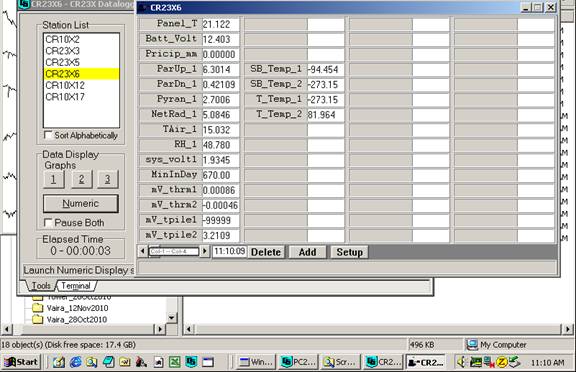
CR23X6 – tower-Met
- Soil CO2 profile: no power when I got there. I
unplug and re-plug fuses, then the system back to work.
Reading from panels of analyzers
depth
|
Open
|
order
|
depth
|
Tree
|
order
|
2cm (1%)
|
1080
|
1
|
2cm (1%)
|
4580
|
1
|
4cm
|
1280
|
2
|
4cm
|
6880
|
4
|
8cm
|
1790
|
3
|
8cm
|
5770
|
2
|
16cm
|
1940
|
4
|
16cm
|
8600
|
3
|
- Close gate and set up fence. YES!
tonzi
|
7931AFE
|
402165
|
574B4B
|
402FF3
|
574632
|
7A432E
|
7A3C6E
|
7A3B40
|
7A4AAA
|
11/12/2010
|
316
|
|
|
|
|
|
|
|
|
|
sm
|
|
|
|
|
|
|
|
|
0-15
|
24.4
|
13.5
|
31.2
|
232.0
|
22.9
|
23.2
|
30.5
|
39.9
|
12.7
|
15-30
|
29.8
|
26.8
|
40.8
|
30.1
|
30.9
|
21.0
|
31.9
|
29.4
|
11.5
|
30-45
|
22.6
|
12.9
|
38.3
|
35.7
|
22.1
|
17.9
|
19.8
|
24.3
|
15.6
|
45-60
|
13.3
|
5.0
|
10.3
|
19.9
|
13.0
|
14.5
|
17.3
|
22.7
|
10.7
|
|
|
|
|
|
|
|
|
|
|
|
A6D882B
|
A3D04E8
|
A6D72F5
|
|
|
|
|
|
|
|
|
|
|
|
|
|
|
|
|
0-15
|
22.6
|
17.1
|
14.0
|
|
|
|
|
|
|
15-30
|
24.6
|
14.2
|
31.7
|
|
|
|
|
|
|
30-45
|
32.9
|
29.9
|
31.7
|
|
|
|
|
|
|
45-60
|
16.2
|
19.9
|
7.3
|
|
|
|
|
|
|
|
|
|
|
|
|
|
|
|
|
vaira
|
57318a
|
7933dee
|
00000128B97F3
|
00000128B8072
|
00000128BDDE8
|
|
|
|
0-15
|
broken
|
21.5
|
18.7
|
8.3
|
2.3
|
|
|
|
|
15-30
|
broken
|
29.8
|
23.6
|
17.8
|
6.1
|
|
|
|
|
30-45
|
broken
|
35.6
|
9.23333333
|
16.7
|
16.6
|
|
|
|
|
45-60
|
broken
|
34.8
|
16.3
|
41.4
|
16.3
|
|
|
|
|
Tonzi
|
|
|
|
|
|
Dendrometer
|
|
|
|
|
|
|
|
|
|
|
Date
|
Day
|
Tag #
|
Reading (mm)
|
reset
|
notes
|
|
11/12/2010
|
316
|
72
|
14.0
|
|
|
|
|
|
79
|
18.4
|
|
|
|
|
|
102
|
X
|
|
|
|
|
|
245
|
X
|
|
|
|
|
|
250
|
22.0
|
5.5
|
(reset to 5.5 today)
|
|
|
|
1
|
22.5
|
6.5
|
|
|
|
|
2
|
12.0
|
|
|
|
|
|
3
|
21.5
|
6.0
|
|
|
|
|
4
|
10.9
|
|
|
|
|
|
5
|
16.1
|
|
|
|
|
|
7
|
18.2
|
8.9
|
133
|
|
|
|
8
|
17.1
|
4.3
|
11828
|
|
|
|
71
|
X
|
|
|
|
|
|
77
|
X
|
|
|
|
|
|
78
|
X
|
|
|
|
|
|
248
|
X
|
|
broken
|
|
|
|
255
|
X
|
|
|
|
|
|
252
|
X
|
|
|
|
|
|
6
|
X
|
|
|
|
Notes: “X” means not working any more.
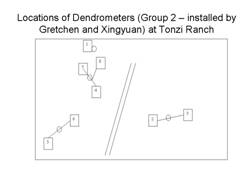
Dendrometers installed by Gretchen group
|