
Field Notes
<--2023-07-25 09:30:00 | 2023-08-29 12:00:00-->Other sites visited today: Vaira | Hill Slough
Phenocam link: Searching...
Tonzi: 2023-08-15 12:20:00 (DOY 227)
Author: Joe Verfaillie
Others: Daphne
Summary: Standard data collection, HOT, fixed IRT power problem maybe, copied stardot files for update, need to update Floor 23x
| Tonzi 2023-08-15 Daphne and I arrived at about 12:20pm PDT. It was clear sunny and HOT. The trees look good and there is still water in the pond. About the only green on the ground is some tar weed (Madia) which I have no idea how it keeps going at this time of year. There were some burn scars along the road from Sacramento and some smoke plumes in the phenocam images. I checked on the IRT solar and power pack. I think the DC-DC converter is dead. It was warm (hot) to the touch and pulled the voltage down when connected to the solar panels. The panels were wired in series and might have been above the 40V max of the DC-DC converter. I rewired the panels in parallel with a max voltage of about 20V and a new converter gave us a voltage of about 9.5 volts but seemed to be charging the power pack. I left it to charge while I did other things. Later the voltage was about 11V and another power status light on the power pack was lit. I plugged in the data logger and it was reporting data to the Tower computer. At 13:00 PDT I did midday water potential. Lower and more variable than I expected: 19-30bar I climbed the tower and collected the Tower fluxes and camera images. The radiometers were clean and the HMP fan was running. I transferred the stardot config files to the CR1000 and copied them to compare with the most recent PIT setup. Hopefully I can just upload the newest files without running the full PIT software to get the Tonzi and Vaira cameras up to date and included in the NIR/NDVI processing that the Phenocam project does. The Tower read: 423.5ppm CO2, 633.8mmol/m3 H2O, 35.8C, 98.8kPa, 100.2SS Daphne did the Moisture Point measurements, the wells, the zcams and the DBH readings. She also collected the FD chamber data on the Delta laptop. She collected the Road Well data on the old laptop. I collected the Floor flux and well data, but didn’t get a copy of the 7550 screen. I need to update the Floor met 23x program to do away with two columns of data that we are not using. These are some of the calculations for the reverse Bowen Ratio calculations. I have also been thinking about taking the CR1000 from the IRT system to run the Floor met. Shortly before we left a helicopter buzzed low overhead and circled to the southeast for a bit before departing to the southwest. We left about 2:30pm PDT |
Field Data
No tank data
Well Depth
| Date | Location | Depth (feet) |
|---|---|---|
| 2023-08-15 | VR_well | 57.36 |
| 2023-08-15 | TZ_floor | 23.3 |
| 2023-08-15 | TZ_tower | 27.97 |
| 2023-08-15 | TZ_road | 32.59 |
| 2023-08-15 | HS | 3.68 |
No TZ Moisture Point data found
No VR Moisture Point data found
No TZ grass heigth found
No VR grass heigth found
Tree DBH
| Date | Tag# | Reading (mm) |
|---|---|---|
| 2023-08-15 | 1 | 15.7 |
| 2023-08-15 | 102 | 3.5 |
| 2023-08-15 | 2 | 12.1 |
| 2023-08-15 | 245 | 7.5 |
| 2023-08-15 | 3 | 3.9 |
| 2023-08-15 | 4 | 5.9 |
| 2023-08-15 | 5 | 16.4 |
| 2023-08-15 | 6 | 5.9 |
| 2023-08-15 | 7 | 8.7 |
| 2023-08-15 | 72 | 19.6 |
| 2023-08-15 | 79 | 20.2 |
Water Potential - mode: raw
| Time | Species | Tree | readings (bar) | ||
|---|---|---|---|---|---|
| 2023-08-15 13:10:00 | OAK | 102 | -25 | -34 | -19 |
| 2023-08-15 13:10:00 | OAK | 92 | -22 | -14 | -34 |
No TZ Grass Biomass data found
No TZ OakLeaves Biomass data found
No TZ PineNeedles Biomass data found
1 photos found
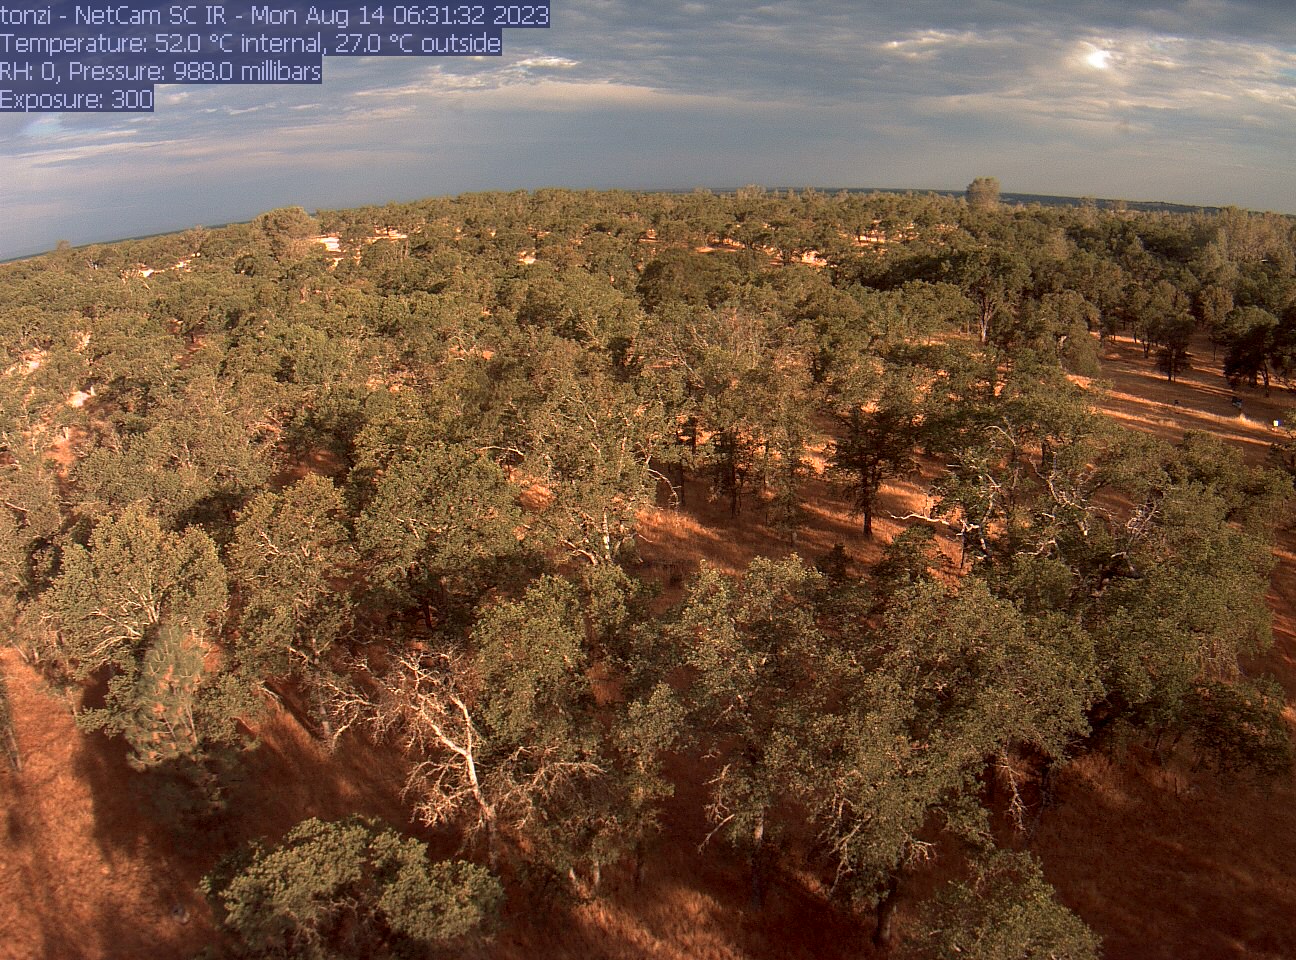
tonzi_2023_08_14_063125.jpg ( 2023-08-14 14:31:06 ) Full size: 1296x960
Nice light with clouds
16 sets found
No data found for TZ_Fenergy.
11 TZ_tmet graphs found
No data found for TZ_soilco2.
Can't check TZ_mixed
3 TZ_mixed graphs found
1 TZ_fflux graphs found
8 TZ_fmet graphs found
No data found for TZ_tram.
3 TZ_co2prof graphs found
1 TZ_irt graphs found
No data found for TZ_windprof.
1 TZ_tflux graphs found
8 TZ_sm graphs found
Can't check TZ_met
1 TZ_met graphs found
Can't check TZVR_mixed
8 TZ_osu graphs found
3 TZ_fd graphs found
Tonzi Z-cam data