Field Notes
<--2023-04-14 11:50:00 | 2023-05-16 10:50:00-->Other sites visited today: Tonzi | Bouldin Corn
Phenocam link: Searching...
Vaira: 2023-04-26 14:30:00 (DOY 116)
Author: Joe Verfaillie
Others:
Summary: Things drying out, standard fieldwork, new hat for west FD chamber, went to the pond
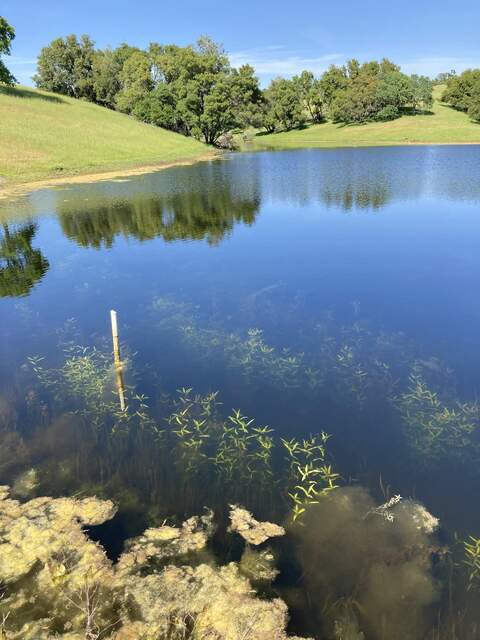
| Vaira 2023-04-26 I arrived at about 14:30 PST. It was clear sunny and warm with a breeze from the southwest. The trees are fully leafed out. The road and ground surface is dry – some small patches of grass are turning brown. I went to the pond and the spillway is dry but the stream still has some water. I measured the well and then collected the met, flux, camera and FD data. The 7500 read: 421.3ppm CO2, 610.5mmol/m3 H2O, 34.8C, 99.4kPa, 101.6SS Humidity was much lower earlier at Tonzi (430-490). There were spider webs on the eddy sensors that I cleaned off. I added a new plastic and Mylar hat the west FD chamber. I did spectra and veg height measurements and went to the Pond. The water was very clear and I could see numerous large fish. I left at about 16:00 to go back to Tonzi where Sophie and Megan were finishing up a tree survey. |
Field Data
No tank data
Well Depth
| Date | Location | Depth (feet) |
|---|---|---|
| 2023-04-26 | TZ_floor | 15 |
| 2023-04-26 | TZ_road | 23.88 |
| 2023-04-26 | TZ_tower | 18.4 |
| 2023-04-26 | VR_well | 47.1 |
| 2023-04-26 | VR_pond | 21.08 |
No TZ Moisture Point data found
No VR Moisture Point data found
No TZ grass heigth found
Grass Height VR 10
| Date | Height reps (cm) | Location | Average | Samp | STDEV | |||||||||
|---|---|---|---|---|---|---|---|---|---|---|---|---|---|---|
| 2023-04-26 | 51 | 28 | 36 | 25 | 15 | 23 | 23 | 20 33 | 25 | 33 | GH_ALL | 27.9 | 10 | 9.59 |
No VR Tree DBH found
No water potential data found
No VR Grass Biomass data found
No VR OakLeaves Biomass data found
No VR PineNeedles Biomass data found
1 photos found

20230426VR_Pond.jpg ( 2023-04-26 15:40:15 ) Full size: 1440x1920
The pond has very clear water. Trees and grass super green
9 sets found
16 VR_met graphs found
2 VR_flux graphs found
No data found for VR_soilco2.
2 VR_pond graphs found
Can't check TZVR_mixed
3 VR_fd graphs found
4 VR_processed graphs found
4 VR_arable graphs found
6 VR_soilvue graphs found

