
Field Notes
<--2023-03-30 10:40:00 | 2023-04-26 14:30:00-->Other sites visited today: Tonzi | Bouldin Corn
Phenocam link: Searching...
Vaira: 2023-04-14 11:50:00 (DOY 104)
Author: Joe Verfaillie
Others: Daphne
Summary: The trees have leaves, soil cores for Ameriflux, Standard data collection, all seems well.
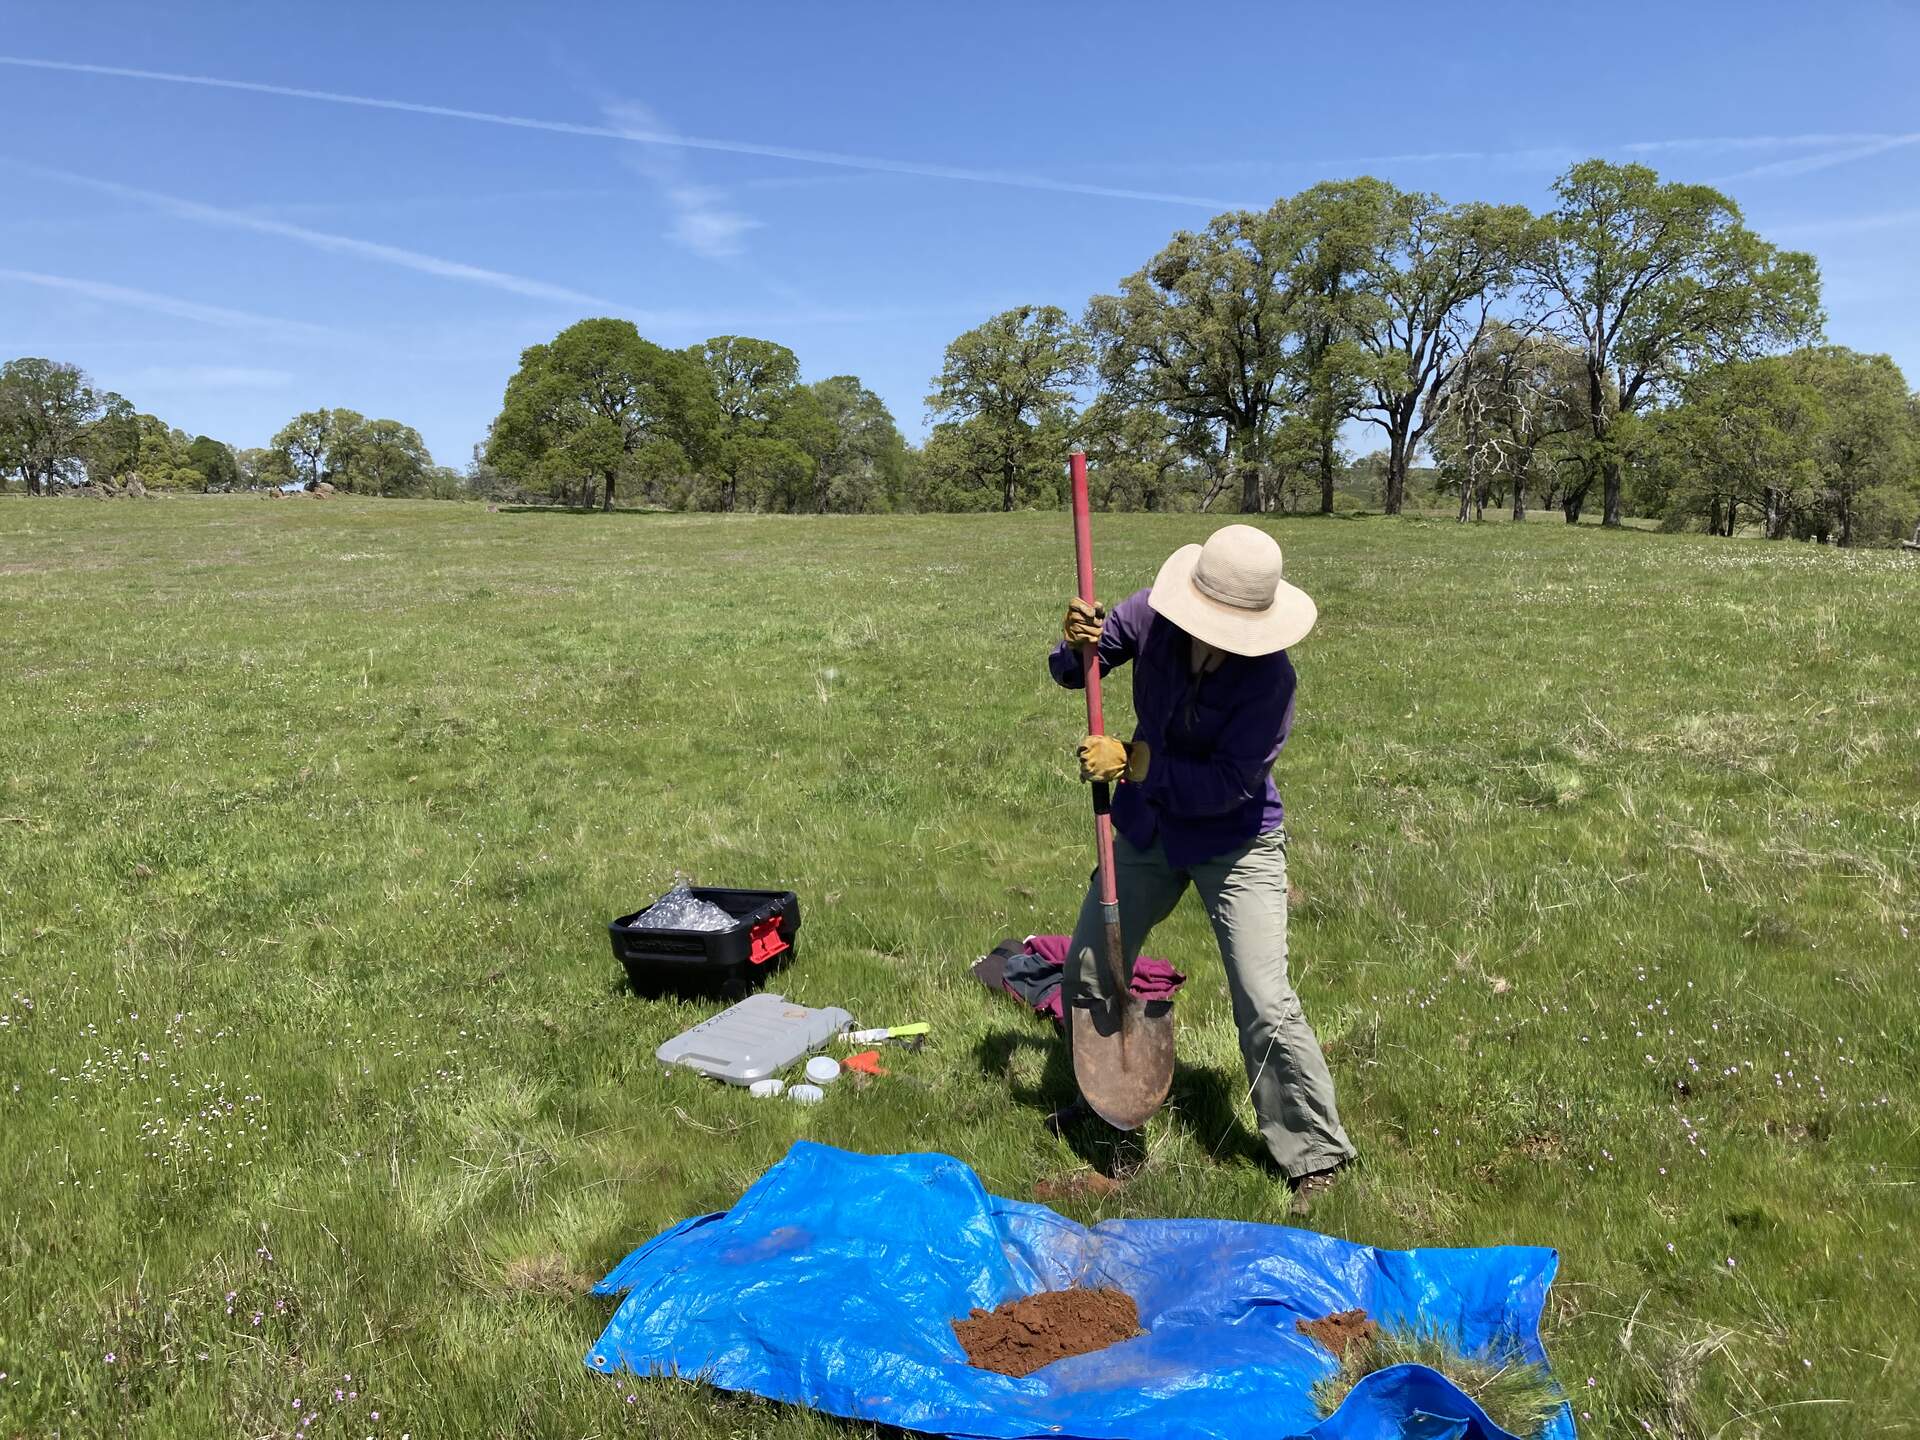
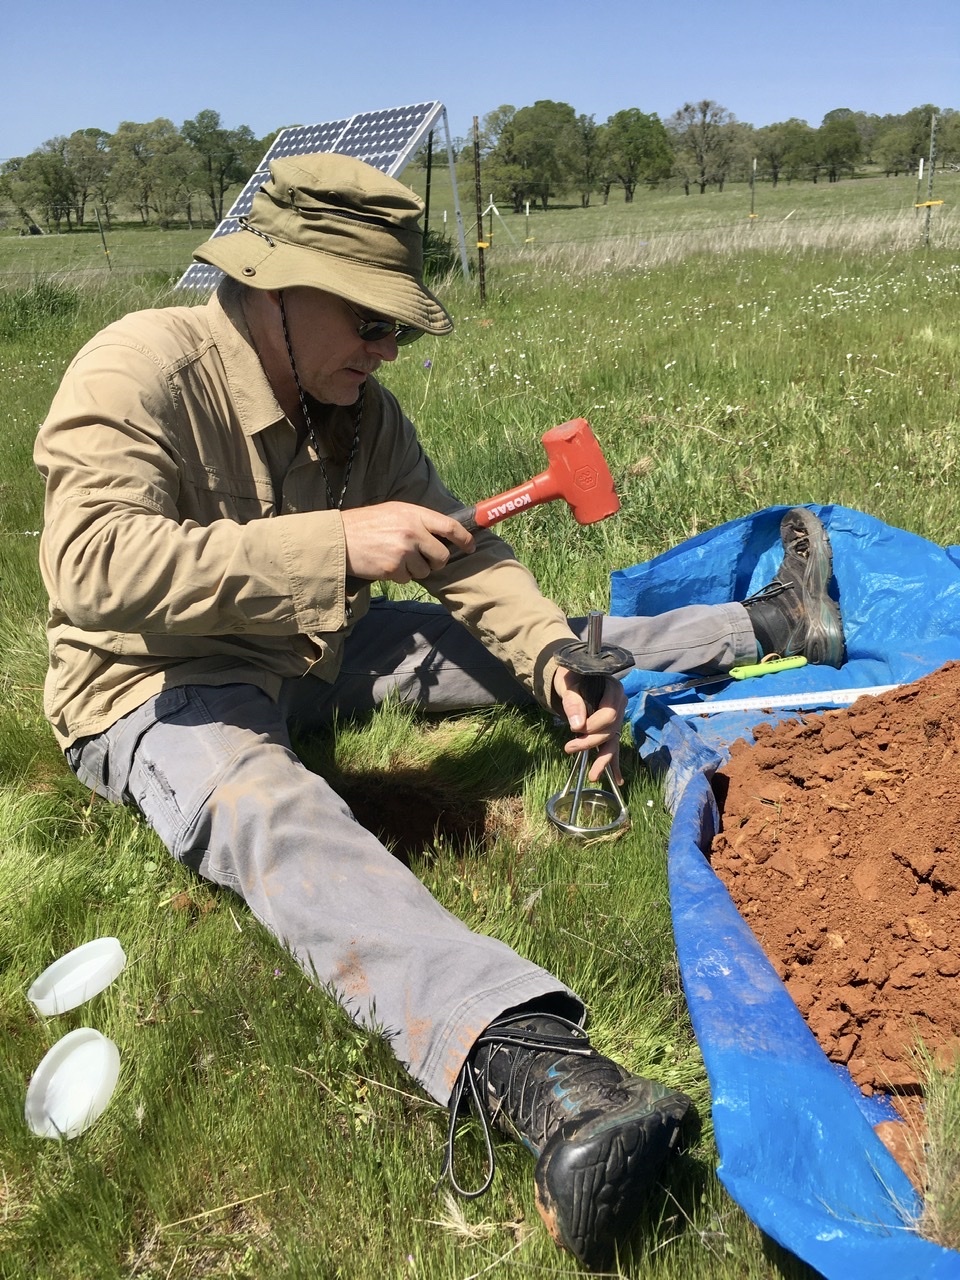
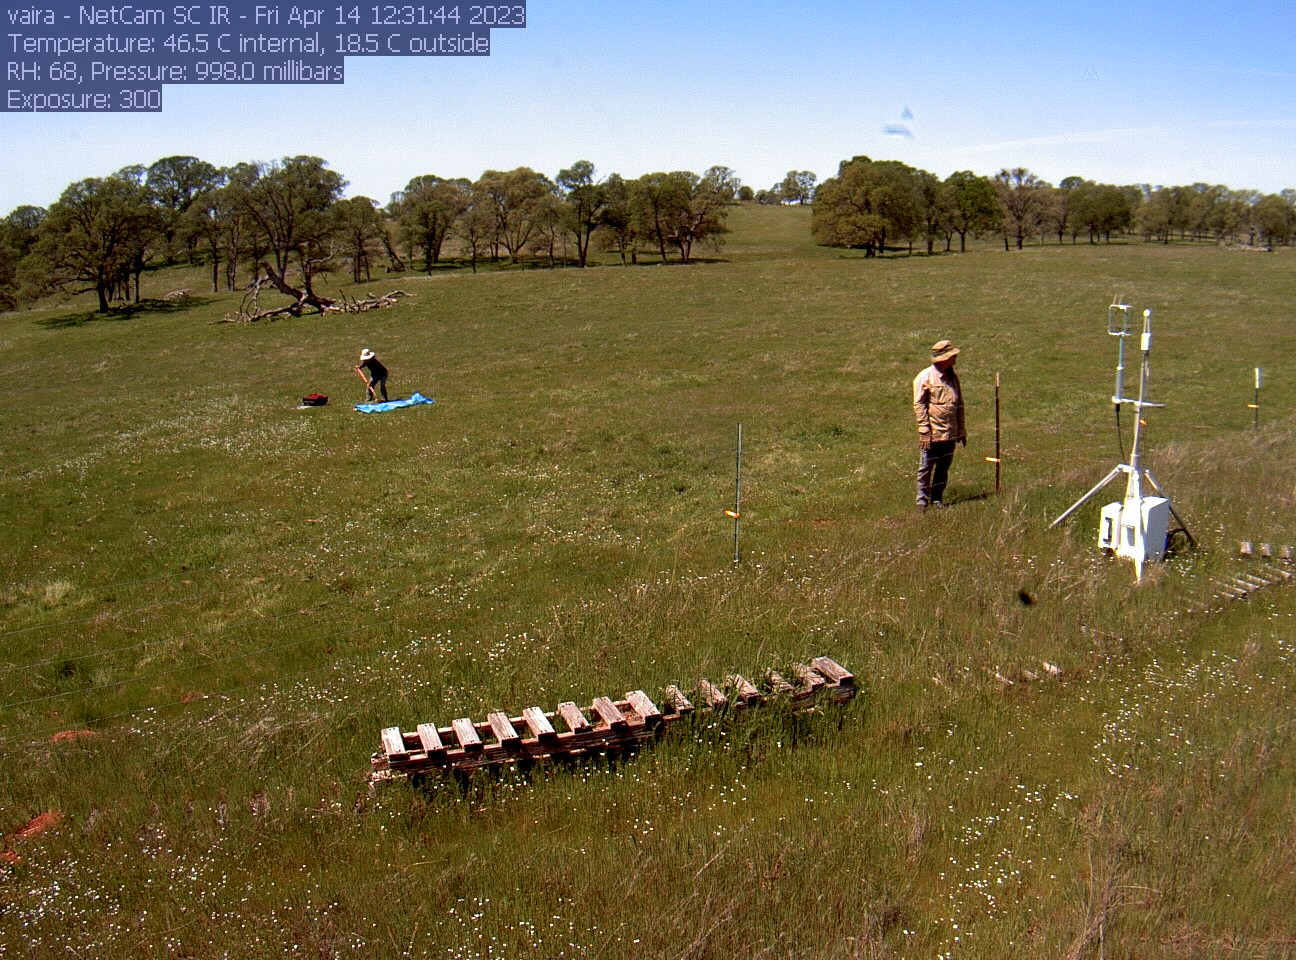
| Vaira 2023-04-14 Daphne and I arrived at about 11:50 leaving Berkeley after the lab meeting. It was sunny, warm and green – the trees have leaves but some are only maybe half-way to full. Much dryer than I expected – the puddles on the road are gone and most of the road surface is dry soil. The grass and flowers have begun to grow and I should start veg height next time. We took soil cores for the Ameriflux soil project today. We dug four pits south, east, north and west of the tower enclosure. It was tough digging even though the soil was still damp. The required 0 and 10cm samples were easy but the deepest sample that was supposed to be at >50cm ended up 20 to 40cm deep and then tended to have a lot of decomposing rock in it. Around 13:40 Daphne collected the met, flux, FD and camera data. No problems reported. She reset the eddy clock +1min and synced the FD clocks. The 7500 read: 427.0ppm CO2, 368.0mmol/m3 H2O, 21.5C, 99.3kPa, 100.9SS I measured the well depth against the wishes of some ants. We left at about 14:00. We stopped by around 17:45 to take a photo of the 7550 for AMP inventory purposes. |
Field Data
No tank data
Well Depth
| Date | Location | Depth (feet) |
|---|---|---|
| 2023-04-14 | VR_well | 46.7 |
| 2023-04-14 | TZ_floor | 15.4 |
| 2023-04-14 | TZ_tower | 18.15 |
| 2023-04-14 | TZ_road | 23.87 |
No TZ Moisture Point data found
No VR Moisture Point data found
No TZ grass heigth found
No VR grass heigth found
No VR Tree DBH found
No water potential data found
No VR Grass Biomass data found
No VR OakLeaves Biomass data found
No VR PineNeedles Biomass data found
5 photos found
20230414VR_DaphneSoilCoring.jpg ( 2023-04-14 12:57:49 ) Full size: 1920x1440
Daphne helping take soil cores for Ameriflux project.

20230414VR_AntsOnWellCap.jpg ( 2023-04-14 14:04:57 ) Full size: 1920x1440
Ants stormed the well cap on the ground next to the well.

20230414VR_JoeSoilPit2.jpg ( 2023-04-14 00:00:00 ) Full size: 960x1280
Joe excavating soil pit 2 from AMP soil cores
20230414VR_JoeTakingSoilCore.jpg ( 2023-04-14 00:00:00 ) Full size: 960x1280
Joe taking surface soil core at pit 2 from AMP soil samples
vaira_2023_04_14_123138.jpg ( 2023-04-14 20:25:46 ) Full size: 1296x960
Joe and Daphne taking soil cores
9 sets found
16 VR_met graphs found
2 VR_flux graphs found
No data found for VR_soilco2.
2 VR_pond graphs found
Can't check TZVR_mixed
3 VR_fd graphs found
4 VR_processed graphs found
4 VR_arable graphs found
6 VR_soilvue graphs found