
Field Notes
<--2023-03-30 12:00:00 | 2023-04-26 11:20:00-->Other sites visited today: Vaira | Bouldin Corn
Phenocam link: Searching...
Tonzi: 2023-04-14 14:00:00 (DOY 104)
Author: Joe Verfaillie
Others: Daphne
Summary: The trees are about half way through leaf on, soil cores for Ameriflux, Tower IRGA had problems - swapped, connection problems with Floor 23x but got data, Steers on the land this spring.
| Tonzi 2023-04-14 Daphne and I arrived at about 14:00 PDT. It was clear, sunny and green – the trees have put on leaves but still some are not fully leafed out – maybe about half way. I noticed a few dead trees and more seem to have a lot of dead branches and few leaves. Maybe they will still fill in more. The ground has dried up very fast. Last time there was standing water everywhere and today the road was dry and the puddles were all but gone. We met Rob on his 4-wheeler. He remarked on how fast it dried out too. He also said that many trees had fallen on his fence line and that the price for fencing has doubled. The cows on the land this spring are all steers. A little research: steers are male cows castrated very young – they are heavier (more profitable) than female cows (heifers) and apparently than bulls that may be castrated later. I dug four pits for soil cores for the Ameriflux project. The pits were near the Tower soil sensors, the Floor Moisture Point sensor, the soil co2 soil sensors and to the west of the Tower. The two pits near the Tower had heavy wet clay in the bottoms. The other two pit may have heavy clay in the bottoms too but it was already dryer and hard to dig in. The required 0 and 10cm samples were easy but the deepest sample that was supposed to be at >50cm ended up 30 to 40cm deep. Daphne did the soil moisture, DBH, well measurements and serviced the z-cams. She also collected the Floor data and FD data. She set the Floor eddy clock +45sec The Floor read: 419.3ppm CO2, 345.0mmol/m3 H2O, 18.7C, 99.0kPa, 98.9SS The tower IRGA has had zero signal strength. I saw this last time but though it might have been water on the windows and had good numbers after cleaning and inspecting it. This time I swapped out the IRGA: sn 1594 came off and sn 75H-2667 went on. I updated the pressure coefficients and reset the box. 2667 read: 419.4ppm CO2, 333.6mmol/m3 H2O, 18.3C, 98.9kPa, 102.9SS We couldn’t connect to the fmet 23x from the tower. I’m not sure why. The 23x was running and I collected all its data directly with the lap top. We left at about 17:30 PDT |
Field Data
No tank data
Well Depth
| Date | Location | Depth (feet) |
|---|---|---|
| 2023-04-14 | VR_well | 46.7 |
| 2023-04-14 | TZ_floor | 15.4 |
| 2023-04-14 | TZ_tower | 18.15 |
| 2023-04-14 | TZ_road | 23.87 |
No TZ Moisture Point data found
No VR Moisture Point data found
No TZ grass heigth found
No VR grass heigth found
Tree DBH
| Date | Tag# | Reading (mm) |
|---|---|---|
| 2023-04-14 | 1 | 12.3 |
| 2023-04-14 | 102 | 4.3 |
| 2023-04-14 | 2 | 4.6 |
| 2023-04-14 | 245 | 6.5 |
| 2023-04-14 | 3 | 4.8 |
| 2023-04-14 | 4 | 7.0 |
| 2023-04-14 | 5 | 12.5 |
| 2023-04-14 | 6 | 5.6 |
| 2023-04-14 | 7 | 13.5 |
| 2023-04-14 | 72 | 17.1 |
| 2023-04-14 | 79 | 19.4 |
No water potential data found
No TZ Grass Biomass data found
No TZ OakLeaves Biomass data found
No TZ PineNeedles Biomass data found
1 photos found
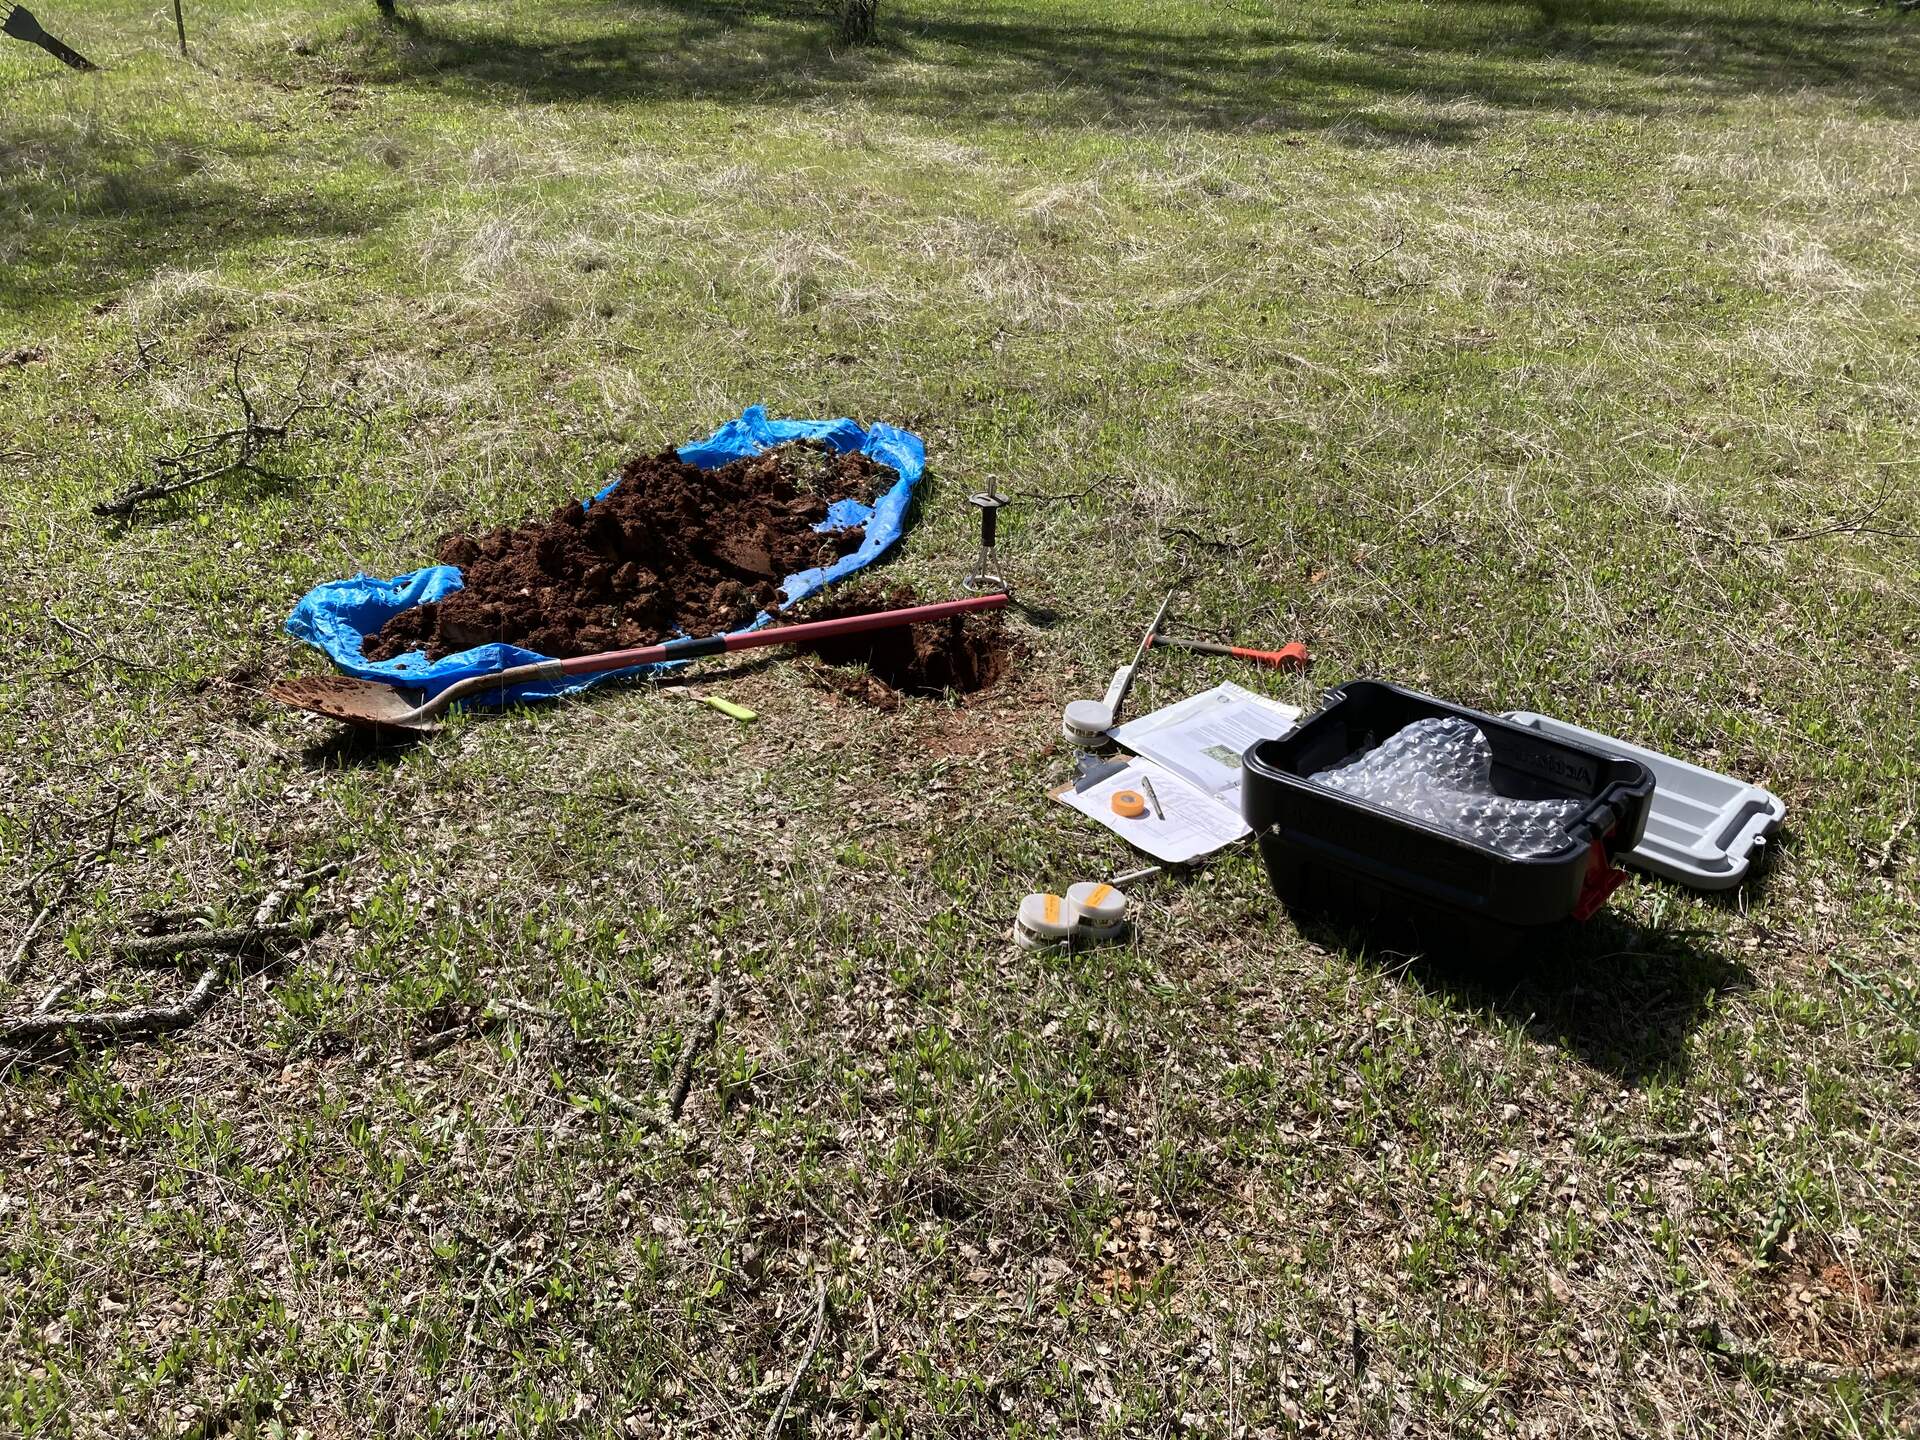
20230414TZ_AmerifluxSoilCore.jpg ( 2023-04-14 14:56:31 ) Full size: 1920x1440
Taking soil cores for Ameriflux project
16 sets found
No data found for TZ_Fenergy.
11 TZ_tmet graphs found
No data found for TZ_soilco2.
Can't check TZ_mixed
3 TZ_mixed graphs found
1 TZ_fflux graphs found
8 TZ_fmet graphs found
No data found for TZ_tram.
3 TZ_co2prof graphs found
1 TZ_irt graphs found
No data found for TZ_windprof.
1 TZ_tflux graphs found
8 TZ_sm graphs found
Can't check TZ_met
1 TZ_met graphs found
Can't check TZVR_mixed
8 TZ_osu graphs found
3 TZ_fd graphs found
Tonzi Z-cam data