Field Notes
<--2023-03-16 10:40:00 | 2023-04-14 11:50:00-->Other sites visited today: Tonzi
Phenocam link: Searching...
Vaira: 2023-03-30 10:40:00 (DOY 89)
Author: Joe Verfaillie
Others:
Summary: Still rainy and not many leaves on the trees, grass looks like it's starting to grow and some flowers, Went to the pond, collected old met and soilvue data.
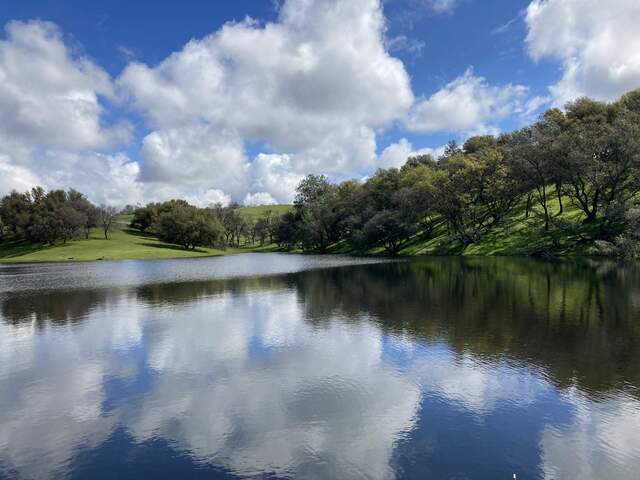
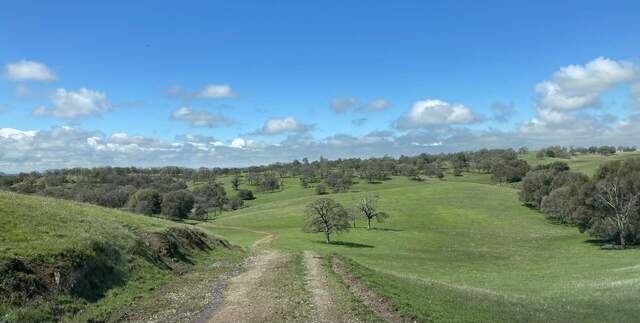
| Vaira 2023-03-30 I arrived at about 10:40 PDT. It was cold and overcast but breaking up in to partly cloudy skies. The trees still only have a smattering of leaves – maybe 10-15%. It has rained again for the last couple of days but not much more rain in the current forecast. Some of the white popcorn flowers have bloomed. Water is still puddled and running everywhere. I saw the cow rancher drive past while I was at the Tower. I measured the well and collected the met, flux, FD and camera data. All seemed well. The met and soilvue data I collected was for the same time period as last time since I forgot to change the collect by date to collect all since last collection. The 7500 read: 422.2ppm CO2, 474.0mmol/m3 H2O, 11.3C, 99.5kPa, 101.6SS The sensors were clean. The fence charger battery box lid had blown off and the box was full of water and a drowned mouse. I dumped it out and put a couple holes in the bottom of the box. The fence seemed in functional shape. I did spectra before I left for the pond – got lucky with a gap in the clouds providing steady light. The grass is very green and thick and starting to finally get a bit taller. Most of the field is still only about 5cm tall. But under the solar panels and in a spot where some battery acid had been spilled the grass was maybe 40cm tall but mostly bent over. I had a small SUV and was able to drive to the pond getting out twice to inspect the road before proceeding. The pond is still heartily spilling over. I left at about 11:45 PDT |
Field Data
No tank data
Well Depth
| Date | Location | Depth (feet) |
|---|---|---|
| 2023-03-30 | VR_well | 46.8 |
| 2023-03-30 | VR_pond | 22.34 |
| 2023-03-30 | TZ_floor | 16.75 |
| 2023-03-30 | TZ_road | 24.7 |
| 2023-03-30 | TZ_tower | 19.15 |
No TZ Moisture Point data found
No VR Moisture Point data found
No TZ grass heigth found
No VR grass heigth found
No VR Tree DBH found
No water potential data found
No VR Grass Biomass data found
No VR OakLeaves Biomass data found
No VR PineNeedles Biomass data found
2 photos found

20230330VR_PondClouds.jpg ( 2023-03-30 11:32:02 ) Full size: 1920x1440
The pond is full, green hills, white clouds, blue sky

20230330VR_GreenGrass.jpg ( 2023-03-30 11:36:48 ) Full size: 1920x968
Green grass but few leaves on the trees yet
9 sets found
16 VR_met graphs found
2 VR_flux graphs found
No data found for VR_soilco2.
2 VR_pond graphs found
Can't check TZVR_mixed
3 VR_fd graphs found
4 VR_processed graphs found
4 VR_arable graphs found
6 VR_soilvue graphs found

