Field Notes
<--2023-04-03 17:15:00 | 2023-04-25 16:20:00-->Other sites visited today: Gilbert Tract | Bouldin Corn | Bouldin Alfalfa
Phenocam link: Searching...
Hill Slough: 2023-04-11 16:45:00 (DOY 101)
Author: Daphne Szutu
Others:
Summary: Regular data collection/cleaning, very windy
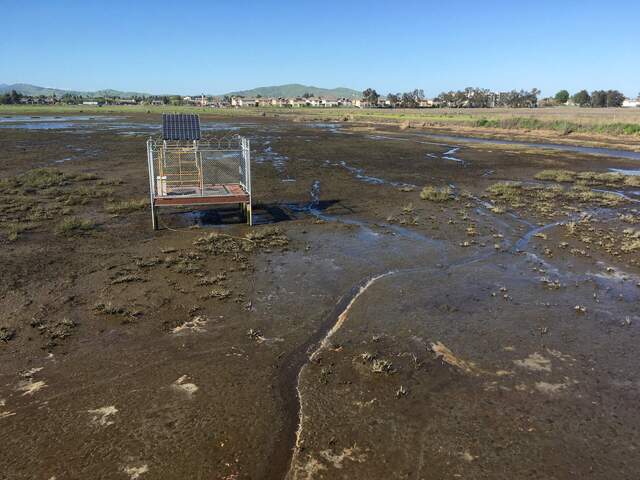
| 2023-04-11 Hill Slough I arrived at 16:45 PDT. It was near low tide and the water level was below the staff gauge. You can see where some of the new channels are forming in the landscape. It was very windy and mostly sunny with some cirrus clouds. The EXO in the channel is due for calibration but we’re still waiting for YSI to ship the conductivity/temp sensor. I’d like to install that new sensor at the same time I’m doing all of the calibrations. Maybe we’ll receive it at the end of the month. I collected met, cam, and USB GHG data. The GHG data looked complete in the last week. Not sure what was wrong before that caused us to lose ~3 days of flux data. I cleaned flux and rad sensors and topped off the wash reservoir. The 7500 read: 413ppm CO2, 548mmol/m3 H2O, 19.0C, 101.8kPa, 101SS—102 after cleaning The 7700 read: 1.95ppm CH4, 45RSSI-- 70 after cleaning I left at 17:05 PDT. |
2 photos found

20230411HS_Channels.jpg ( 2023-04-11 17:00:53 ) Full size: 1920x1440
Channels starting to form in the wetland

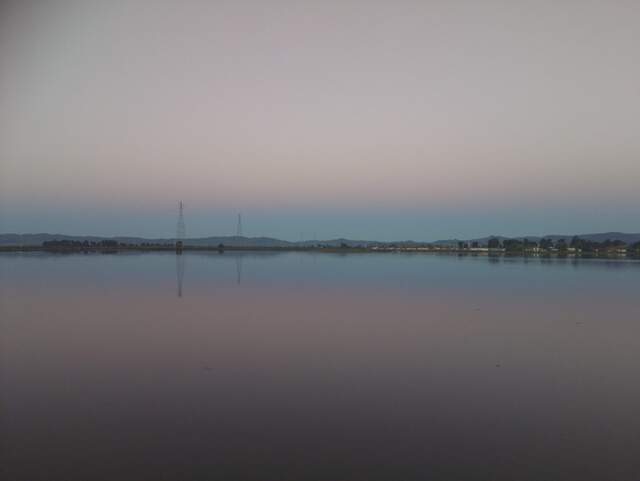
HS_picam_20230410_0545.jpg ( 2023-04-10 05:45:05 ) Full size: 1917x1440
Gradient colors at dawn
4 sets found
21 HS_met graphs found
4 HS_flux graphs found
1 HS_cam graphs found
Can't check HS_Processed
2 HS_Processed graphs found

