Field Notes
<--2023-03-16 11:50:00 | 2023-04-14 14:00:00-->Other sites visited today: Vaira
Phenocam link: Searching...
Tonzi: 2023-03-30 12:00:00 (DOY 89)
Author: Joe Verfaillie
Others:
Summary: Almost no leaves on trees, still very wet, Tower 7500 reading bad but reconnect of head seemed to fix it. Well level up a lot had to reposition Road well sensor, added desiccant to zcam 2 and 3, re-glued dendrometer sales #2 and #4.
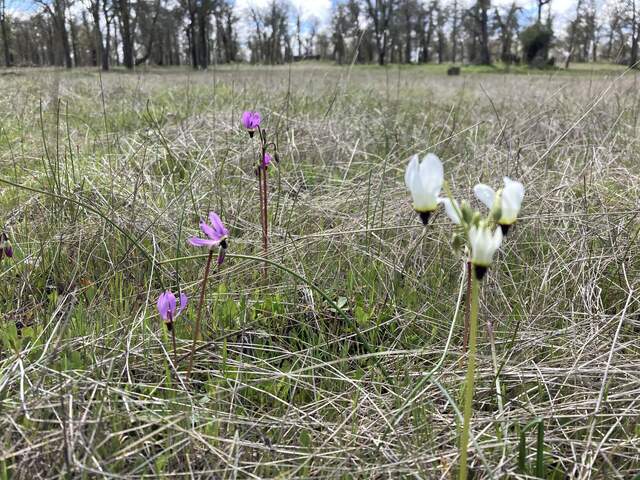
| Tonzi 2023-03-30 I arrived at about 12:00 noon PDT. It has been raining more in the last couple days. The trees here still have very few leaves – maybe 5-10%. The ground is totally saturated with water in every small hole. There are some scattered flowers that look a bit confused as to whether it’s time to bloom or not. I collected data from the tower. The 7500 was initially not reading. I thought it was water on the windows so didn’t look at the numbers carefully. I didn’t notice any water when I lowered the 7500 so I disconnected it and reconnected the cable. It seemed to be running okay. When I checked the numbers again they looked fine. Tower read: 431.2ppm CO2, 383.1mmol/m3 H2O, 8.9C, 99.0kPa, 103.9SS Floor read: 418.7ppm CO2, 495.7mmol/m3 H2O, 13.4C, 99.1kPa, 100.9SS I did the soil moisture measurements, DBH, and well readings – the well levels have come up a bunch. The road well was off scale reading 16.0psi. I raised the sensor to a second red electrical tape on the cable and then got readings of 5.688, 5.674, 5.679. I also used a really old netbook that was still running XP to collect the data. It seemed fine and not too much trouble to do that way – temporary fix that will continue indefinitely. I initially could not connect to the Floor Well CR200 again. I called Campbell and they said since I could talk to the CR200 with the Device Config Utility it was likely that the setup in LoggerNet was corrupt. Deleting and making a new setup for the CR200 worked just fine. I service the z-cams adding tins of desiccant to #2 and #3. #2 had a little condensation in its window. I re-glued the larger scales on dendrometer #2 and #4. I sanded both faces and wiped them with alcohol before using superglue to reattach them carefully. I hope I didn’t glue the slider in place. The readings changed a little bit so will need to see if it matters. Some broken wires on the cow fences but not in bad shape. I found the soldering kit near the Tower fence where I apparently had left it last time. Some animal had dumped it out on the ground. I left at about 15:00 PDT |
Field Data
No tank data
Well Depth
| Date | Location | Depth (feet) |
|---|---|---|
| 2023-03-30 | VR_well | 46.8 |
| 2023-03-30 | VR_pond | 22.34 |
| 2023-03-30 | TZ_floor | 16.75 |
| 2023-03-30 | TZ_road | 24.7 |
| 2023-03-30 | TZ_tower | 19.15 |
No TZ Moisture Point data found
No VR Moisture Point data found
No TZ grass heigth found
No VR grass heigth found
Tree DBH
| Date | Tag# | Reading (mm) |
|---|---|---|
| 2023-03-30 | 1 | 12.9 |
| 2023-03-30 | 102 | 6.3 |
| 2023-03-30 | 2 | 4.3 |
| 2023-03-30 | 2 | 4.7 |
| 2023-03-30 | 245 | 7.4 |
| 2023-03-30 | 3 | 4.9 |
| 2023-03-30 | 4 | 6.8 |
| 2023-03-30 | 5 | 12.7 |
| 2023-03-30 | 6 | 5.6 |
| 2023-03-30 | 7 | 13.7 |
| 2023-03-30 | 72 | 17.6 |
| 2023-03-30 | 79 | 19.3 |
No water potential data found
No TZ Grass Biomass data found
No TZ OakLeaves Biomass data found
No TZ PineNeedles Biomass data found
1 photos found

20230330TZ_Flowers.jpg ( 2023-03-30 13:15:03 ) Full size: 1920x1440
Flowers trying to decide if it’s spring
16 sets found
No data found for TZ_Fenergy.
11 TZ_tmet graphs found
No data found for TZ_soilco2.
Can't check TZ_mixed
3 TZ_mixed graphs found
1 TZ_fflux graphs found
8 TZ_fmet graphs found
No data found for TZ_tram.
3 TZ_co2prof graphs found
1 TZ_irt graphs found
No data found for TZ_windprof.
1 TZ_tflux graphs found
8 TZ_sm graphs found
Can't check TZ_met
1 TZ_met graphs found
Can't check TZVR_mixed
8 TZ_osu graphs found
3 TZ_fd graphs found
Tonzi Z-cam data

