
Field Notes
<--2022-12-06 12:15:00 | 2023-01-06 12:00:00-->Other sites visited today: Hill Slough | Vaira
Phenocam link: Searching...
Tonzi: 2022-12-21 13:15:00 (DOY 355)
Author: Joe Verfaillie
Others: Kyoko, Hisashi, Mukund
Summary: Mukund collected point dendrometer data, swapped Tower 7500 for calibration, changed power at Floor met, IRT, fixed OSU SP3 tipping bucket wire, tried to patch FD power, cold and foggy
| Tonzi 2022-12-21 Kyoko, Hisashi, Mukund, and I arrived at 13:15. Mukund is here to collect data from the point dendrometers to make sure they are working – data looks good. It was cold and slightly foggy. I don’t think there was been rain in the last two weeks but the ground is wet. No puddles in the road and the pond level doesn’t look like it changed much. I didn’t notice the grass looking frosted here but it hasn’t grown any since last time. Kyoko and Hisashi measured the soil moisture and well levels. Hisashi also swapped the z-cam cards. I forgot to check on the condensation in z-cam 1. About half of the images were bad. Hisashi said he wiped off the condensation on the inside of the window. I first worked on the power at the Floor data logger. One of the two tables being collected on that 23x has missing values that look like low power and it had some low voltage error on the screen. I changed the power line from 12V to 24V and added a DC-DC converter to the box. I also added an old screw terminal power distribution strip. Everything seemed working afterwards but whether this improves things… I was thinking about adding a CR6 to collect the soilvue sensors but maybe upgrading the 23x to a CR1000 is a better long term solution. I swapped the Tower 7500: sn 75H-2669 came off and sn 0418 went on. I had real trouble getting the cable to screw on the bottom partly because my fingers were numb from the cold and partly I was turning it the wrong direction. 7500 2669 read: 448.5ppm CO2, 384.5mmol/m3 H2O, 5.4C, 99.9kPa, 102.2SS 7500 0418 read: 459.5ppm CO2, 369.4mmol/m3 H2O, 5.5C, 99.9kPa, 98.9SS The tower computer keyboard is shot from getting rained on last time. It’s throwing lots of random clicks and such. I ended up unplugging it and used the touch screen to get things done. I need to bring a new keyboard next time. The Floor 7500 read: 456.8ppm CO2, 385.6mmol/m3 H2O, 6.4C, 100.0kPa, 99.9SS I checked on the OSU SP3 tipping bucket. Its white wire had broken off at the terminal. I fixed it. There was no power for the FD chamber. The batteries were reading 10V even with the solar connected to them. I rewired it so only one battery is online. It was reading a little over 12V and the charger controller restarted the FD chamber. The data I missed last time is gone but I downloaded most of the last two weeks. I need to do some major power upgrades here – might use the batteries removed from HS recently. The little tree IRT has been losing power too. Its lithium pack was dead – no status lights. I brought a bigger pack but it requires 24V to charge. I tried to put a boost converter on the solar panel there but the panel was not producing enough power to set its gain. I ended up setting the gain using the power pack and hooked it all up. It was almost 4pm so getting dark along with the fog. The bigger power pack should run it overnight and hopefully I did everything right and the solar will recharge it if it ever gets some sun. I might need a bigger solar panel there. The phenocam photos I couldn’t collect last time were there but the clock had lost its time. I reset the stardot clock from 2000-01-14 13:37:56 to 2022-12-21 14:45:50 We left at about 16:10 |
Field Data
No tank data
Well Depth
| Date | Location | Depth (feet) |
|---|---|---|
| 2022-12-21 | VR_well | 61 |
| 2022-12-21 | TZ_floor | 31.55 |
| 2022-12-21 | TZ_road | 39.25 |
| 2022-12-21 | TZ_tower | 36.2 |
| 2022-12-21 | VR | 14.54 |
No TZ Moisture Point data found
No VR Moisture Point data found
No TZ grass heigth found
No VR grass heigth found
Tree DBH
| Date | Tag# | Reading (mm) |
|---|---|---|
| 2022-12-21 | 1 | 11.6 |
| 2022-12-21 | 102 | 4.8 |
| 2022-12-21 | 2 | 19.1 |
| 2022-12-21 | 245 | 6.7 |
| 2022-12-21 | 3 | 22.2 |
| 2022-12-21 | 4 | 19.4 |
| 2022-12-21 | 5 | 12.1 |
| 2022-12-21 | 6 | 22.1 |
| 2022-12-21 | 7 | 13.6 |
| 2022-12-21 | 72 | 16.4 |
| 2022-12-21 | 79 | 14.8 |
No water potential data found
No TZ Grass Biomass data found
No TZ OakLeaves Biomass data found
No TZ PineNeedles Biomass data found
1 photos found
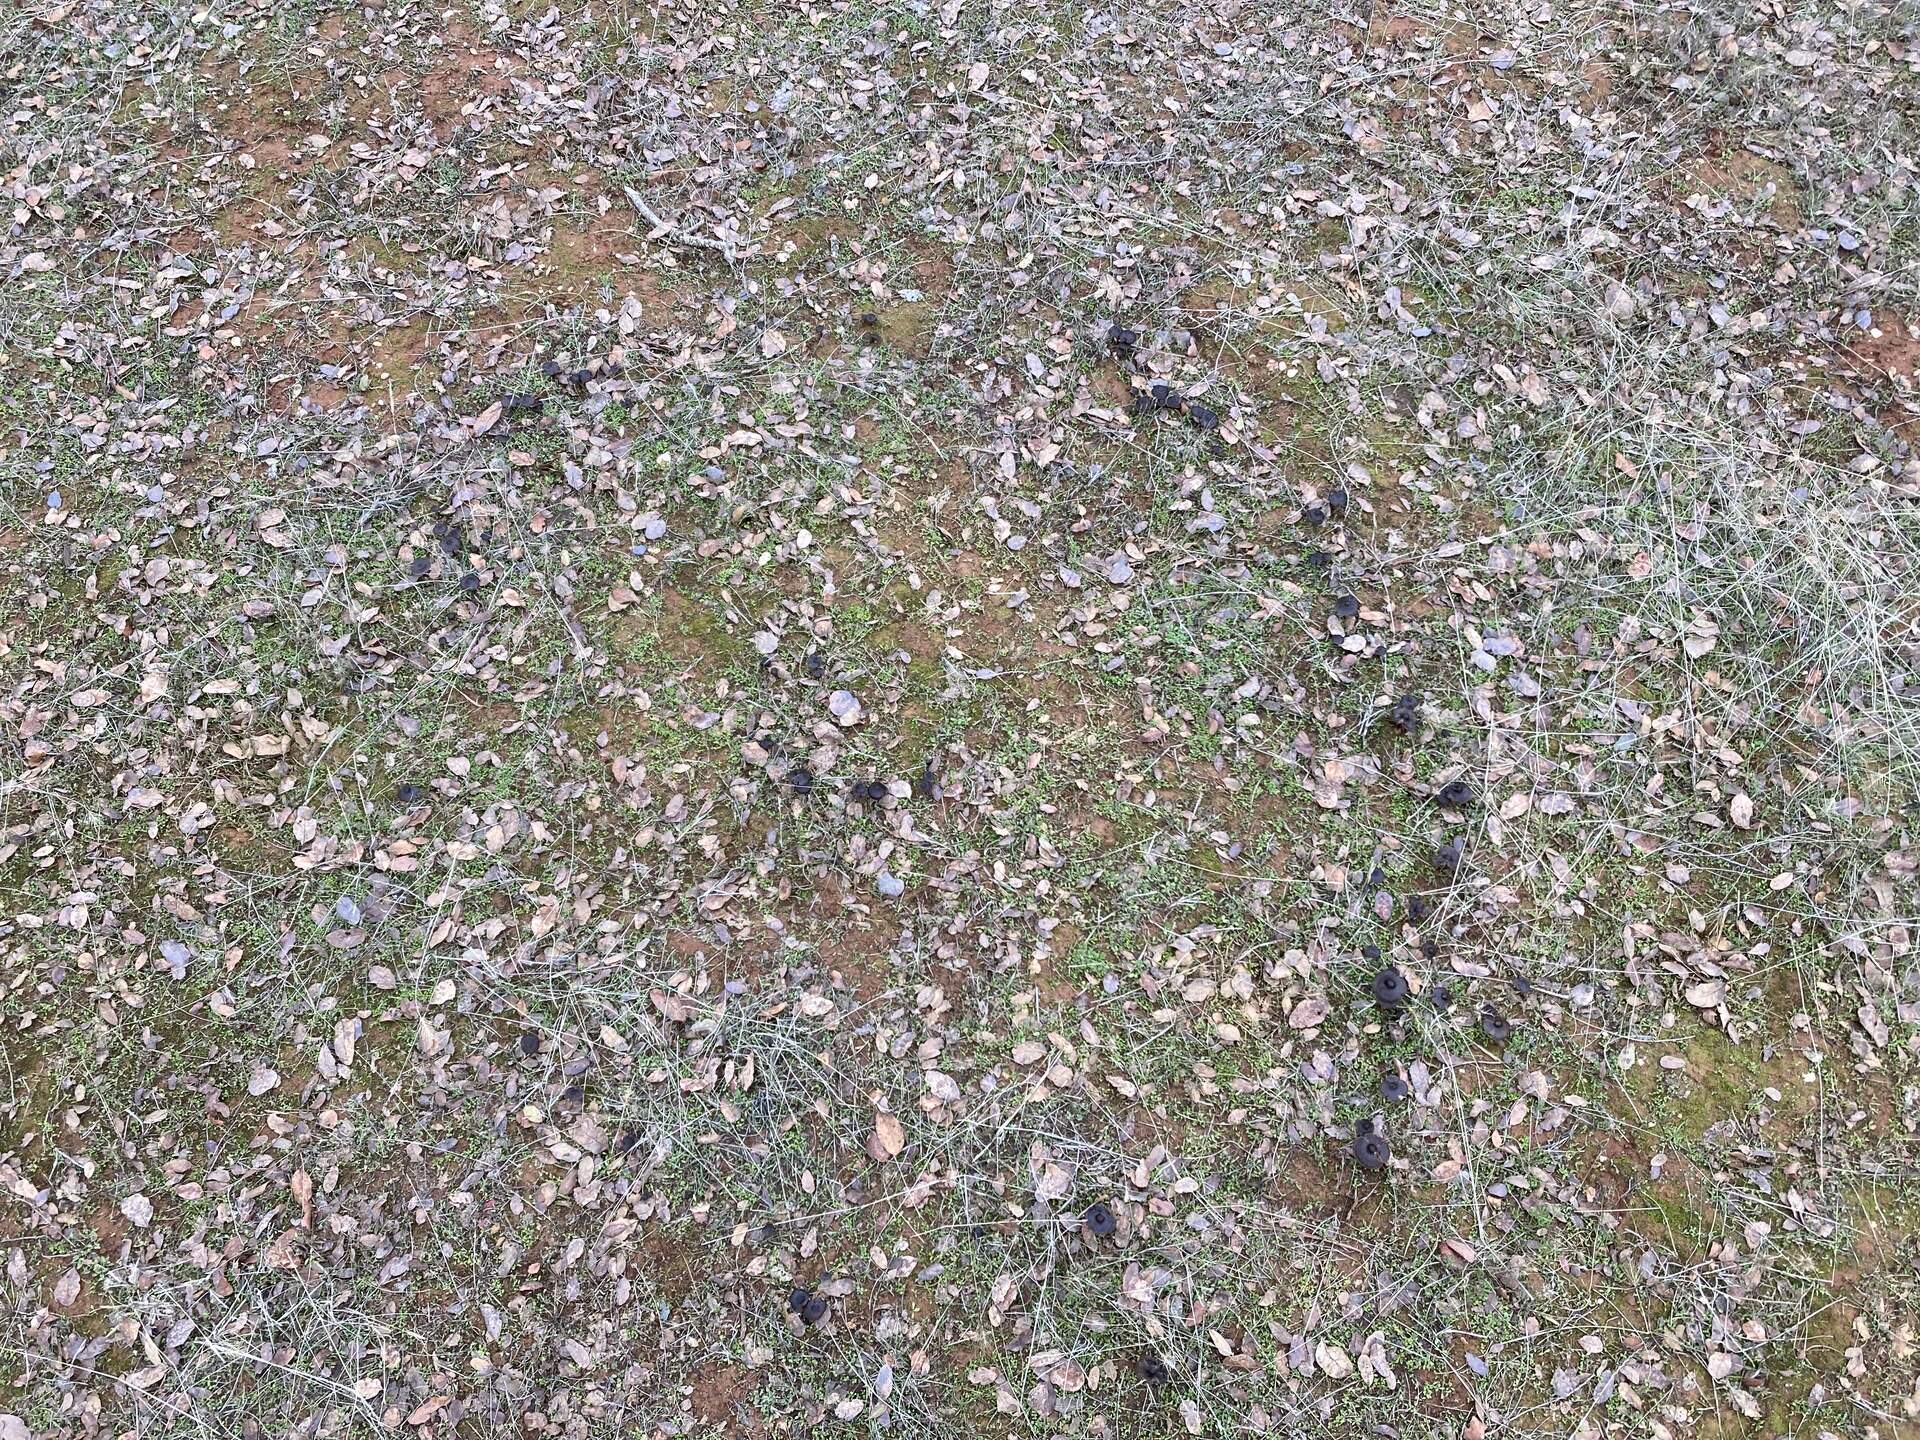
20221221TZ_FairyRing.jpg ( 2022-12-21 13:27:24 ) Full size: 1920x1440
A double fairy ring of mushrooms
16 sets found
No data found for TZ_Fenergy.
11 TZ_tmet graphs found
No data found for TZ_soilco2.
Can't check TZ_mixed
3 TZ_mixed graphs found
1 TZ_fflux graphs found
8 TZ_fmet graphs found
No data found for TZ_tram.
3 TZ_co2prof graphs found
1 TZ_irt graphs found
No data found for TZ_windprof.
1 TZ_tflux graphs found
8 TZ_sm graphs found
Can't check TZ_met
1 TZ_met graphs found
Can't check TZVR_mixed
8 TZ_osu graphs found
3 TZ_fd graphs found
Tonzi Z-cam data