
Field Notes
<--2022-11-17 12:00:00 | 2022-12-21 13:15:00-->Other sites visited today: Vaira
Phenocam link: Searching...
Tonzi: 2022-12-06 12:15:00 (DOY 340)
Author: Joe Verfaillie
Others:
Summary: Rained, Rain, more Rain coming. Swapped Floor 7500, brought in Arduino diffuse PAR test - not much data. Z-cam 1 had condensation inside box, Tower keyboard got wet, did not get Phenocam images of FD data
| Tonzi 2022-12-06 I arrived at about 12:15. Heavy rain last weekend and still some showers today – I got caught in a thunderstorm with hail and heavy rain. The water level in the pond doesn’t seem to have changed much though. The trees still have some mostly brown leaves. There is green grass coming up in most places. I removed the Arduino diffuse PAR from the Tower top. The CR10x only saved a day’s worth of data but seem to still be getting new live data from the Arduino. Not sure what the problem was. More testing in the lab. I forgot to bring the CFM card reader so I could not collect the Phenocam photos. I copied a few photos over the network connection to the CR1000 but it’s way too slow to do more than a few. I serviced the z-cams, measured the soil moisture, and read the dendrometers. At Liu Kang’s tree I heard about three rolling bouts of thunder to the east. When I was at the far dendrometer trees (#79, #72) I could hear the mixed rain and hail approaching from the south. The laptop was collecting data from the FD chamber and got a little wet. The keyboard at the Tower was out and got a lot wet. Probably should bring a spare next time just in case. The FD chamber data may be gone. The file I got was just the header and I think I cleared its memory. The Floor met soil moisture table is missing data but the Floor met table is okay – not sure why. Might need to upgrade that CR23X to handle the two SoilVue probes. The IRT CR1000 is also losing data on low sun days. The lithium power pack had 3 out of 4 good status lights. A ton load of acorns pushed into that box. I swapped the Floor 7500: sn 0418 came off and sn 75H-2180 went on. 0418 read: 423.4ppm CO2, 389.9mmol/m3 H2O, 13.8C, 99.3kPa, 99.5SS 2180 read: 430.6ppm CO2, 409.1mmol/m3 H2O, 13.9C, 99.3kPa, 100.4SS 2180 had a relatively large offset in CO2 span when it was calibrated but looks okay compared to 0418 here. I set the pressure coefficients and reset the box. Z-cam 1 had condensation on the inside of its window. I wiped it off and added two fresh small desiccant packs. It could use a bigger pack next time. I wiped water off all three windows after the thunderstorm. I left at about 15:30 |
Field Data
No tank data
Well Depth
| Date | Location | Depth (feet) |
|---|---|---|
| 2022-12-06 | VR_well | 60.7 |
| 2022-12-06 | TZ_floor | 31.6 |
| 2022-12-06 | TZ_road | 39.35 |
| 2022-12-06 | TZ_tower | 36.2 |
No TZ Moisture Point data found
No VR Moisture Point data found
No TZ grass heigth found
No VR grass heigth found
Tree DBH
| Date | Tag# | Reading (mm) |
|---|---|---|
| 2022-12-06 | 1 | 11.1 |
| 2022-12-06 | 102 | 20.6 |
| 2022-12-06 | 102 | 4.2 |
| 2022-12-06 | 2 | 18.7 |
| 2022-12-06 | 245 | 6.6 |
| 2022-12-06 | 3 | 21.8 |
| 2022-12-06 | 4 | 19.1 |
| 2022-12-06 | 5 | 11.9 |
| 2022-12-06 | 6 | 21.8 |
| 2022-12-06 | 7 | 12.4 |
| 2022-12-06 | 72 | 16.2 |
| 2022-12-06 | 79 | 14.5 |
No water potential data found
No TZ Grass Biomass data found
No TZ OakLeaves Biomass data found
No TZ PineNeedles Biomass data found
4 photos found

20221206TZ_FlashFlood.jpg ( 2022-12-06 14:21:06 ) Full size: 1440x1920
Thunderstorm turned the road into a stream and pond
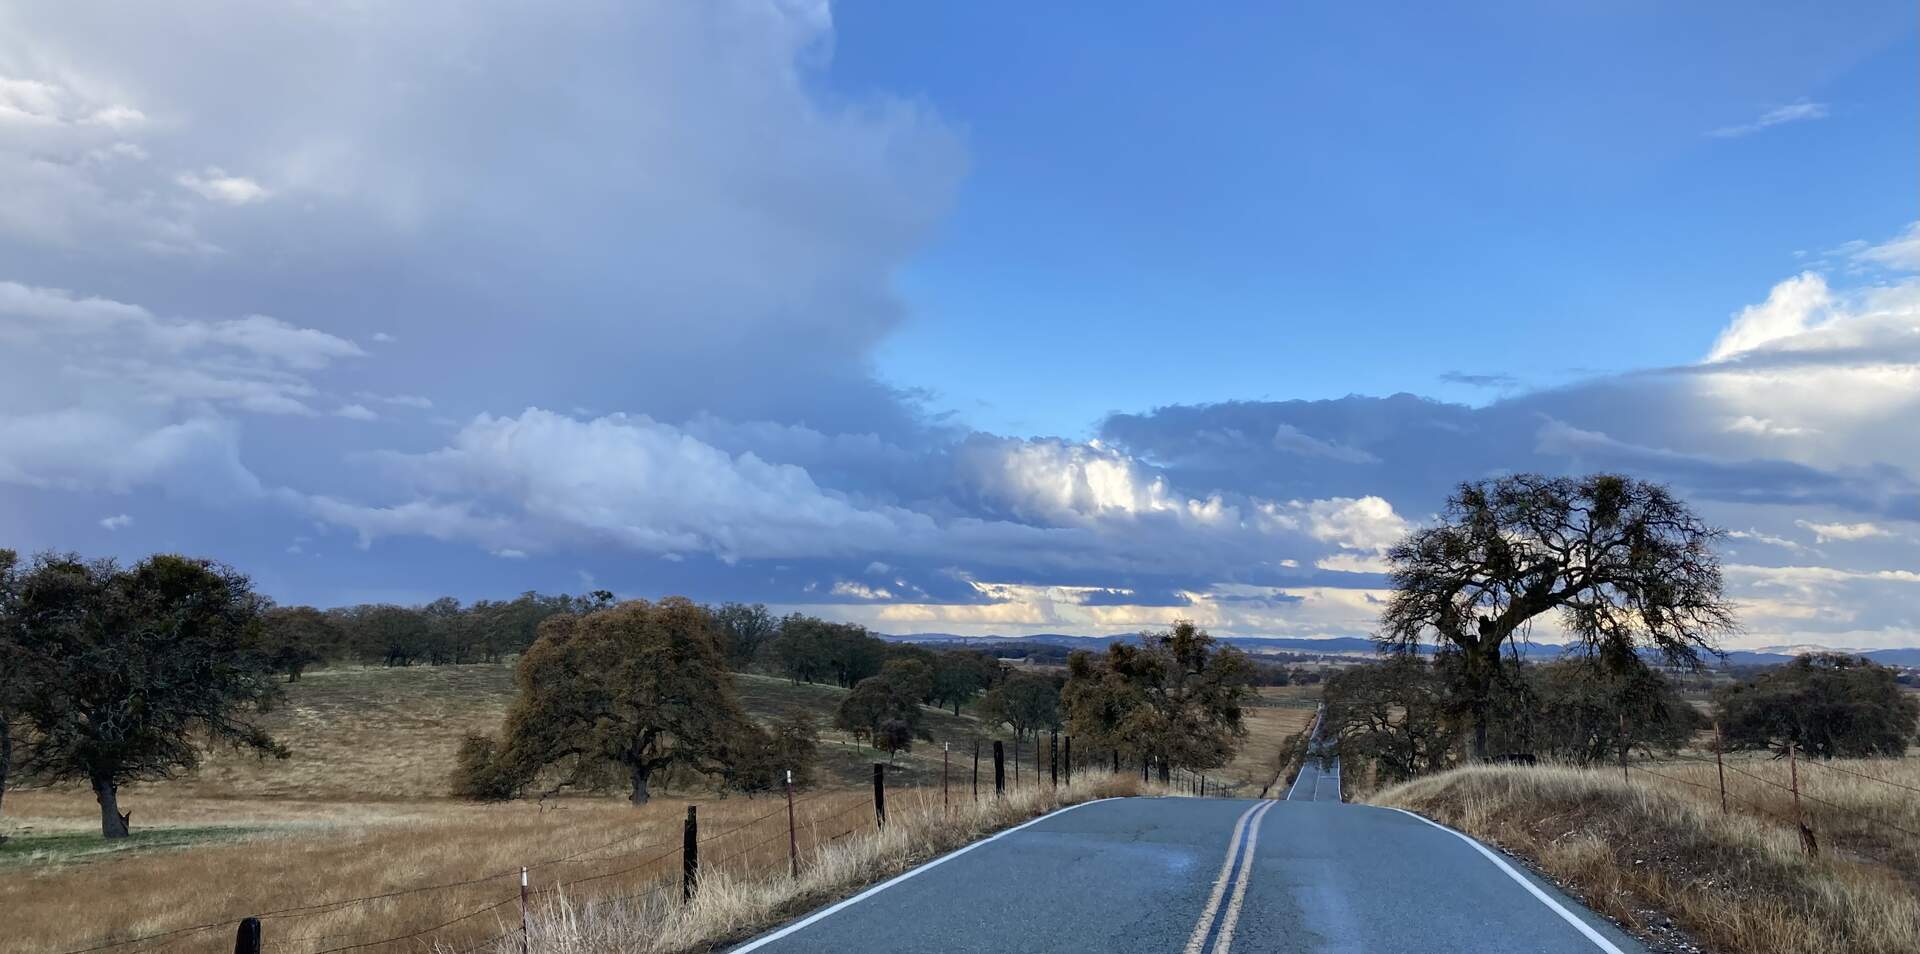
20221206TZ_ThunderstormClouds.jpg ( 2022-12-06 15:30:20 ) Full size: 1920x954
Thunderstorm to the north on the way home

20221206TZ_ThunderstormRadar.jpg ( 2022-12-06 14:09:58 ) Full size: 630x428
I got caught by a small thunderstorm moving to the NNW
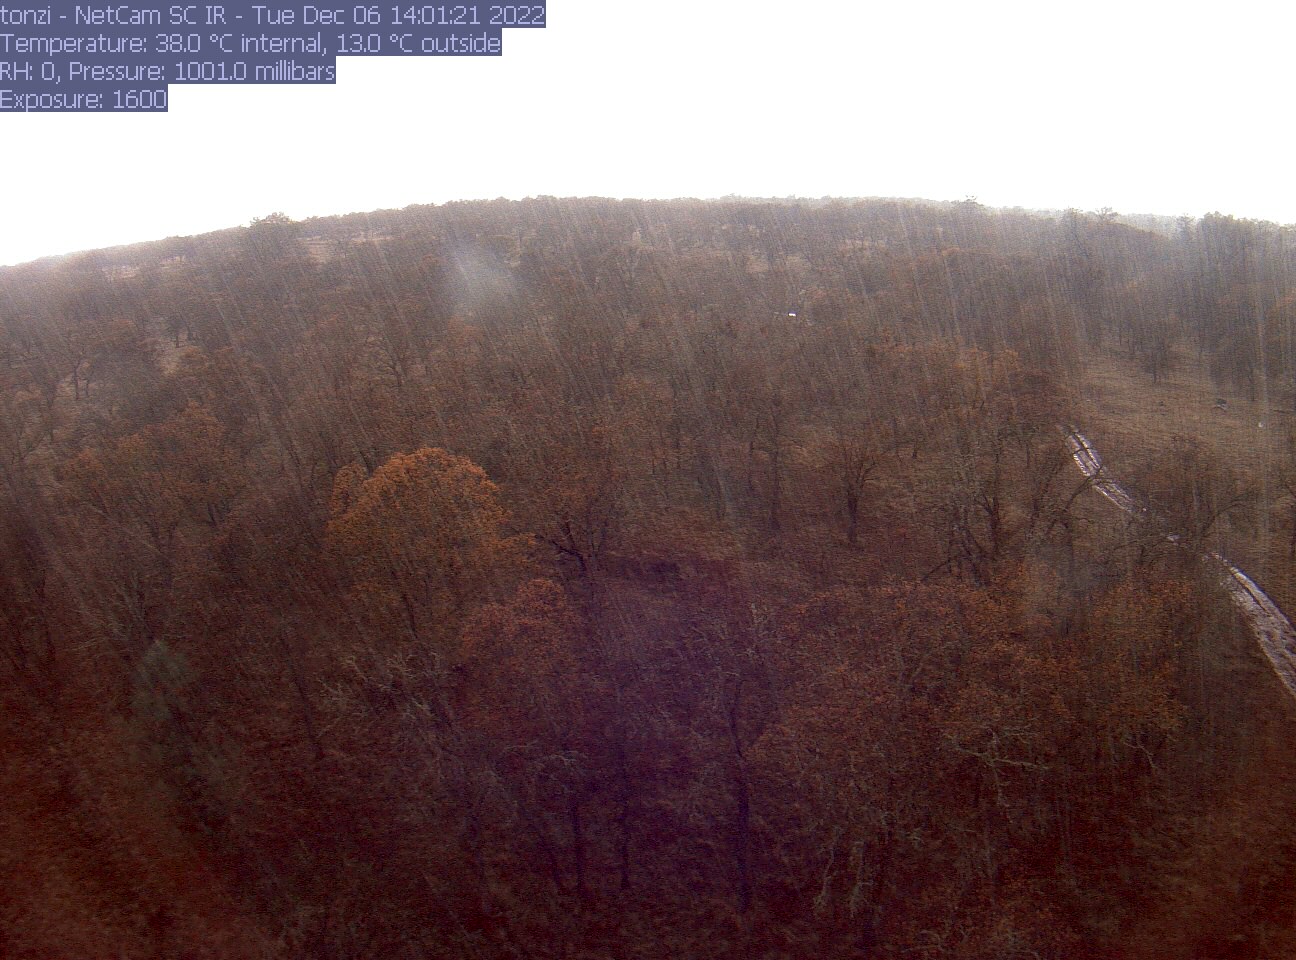
tonzi_2022_12_06_140115.jpg ( 2022-12-06 22:01:30 ) Full size: 1296x960
Heavy rain falling
16 sets found
No data found for TZ_Fenergy.
11 TZ_tmet graphs found
No data found for TZ_soilco2.
Can't check TZ_mixed
3 TZ_mixed graphs found
1 TZ_fflux graphs found
8 TZ_fmet graphs found
No data found for TZ_tram.
3 TZ_co2prof graphs found
1 TZ_irt graphs found
No data found for TZ_windprof.
1 TZ_tflux graphs found
8 TZ_sm graphs found
Can't check TZ_met
1 TZ_met graphs found
Can't check TZVR_mixed
8 TZ_osu graphs found
No data found for TZ_fd.
Tonzi Z-cam data