
Field Notes
<--2022-11-17 14:30:00 | 2022-12-21 12:00:00-->Other sites visited today: Tonzi
Phenocam link: Searching...
Vaira: 2022-12-06 10:40:00 (DOY 340)
Author: Joe Verfaillie
Others:
Summary: Standard field work, rained and more rain to come, mapped Theta probes, swapped 7500
| Vaira 2022-12-06 I arrived at 10:40. There has been heavy rain over the weekend and still some showers this morning – raining near Vaca Ville on the way out and thunderstorm at Tonzi later in the day. There were puddles on the road and the water hole had some water in it. The grass is 0-5cm high - green stuff is coming up in most places. I measured the well and then collected the data. I forgot to bring the CFM card reader so only collected a few of the phenocam images over the network connection to the CR1000 – way too slow to do more than a few. I also swapped the 7500 for calibration: sn 0065 came off and sn 75H-2176 went on. 0065 read: 443.6ppm CO2, 409.8mmol/m3 H2O, 21.7C, 99.9kPa, 112.4SS 2176 read: 443.7ppm CO2, 419.7mmol/m3 H2O, 21.3C, 99.9kPa, 101.3SS 2176 had a relatively large offset in CO2 span when it was calibrated in the lab but seems to be reading the same as the one coming off – maybe not a good thing? I changed the pressure coefficients and reset the box. I mapped the Theta probes. All are inserted nearly vertically but at an angle of about 27deg from vertical. Two seem to be at the surface and the other three all about -10cm. More details will be entered in SMAP. I did spectral measurements, but did not go to the pond. I left at about 12:00 noon. |
Field Data
No tank data
Well Depth
| Date | Location | Depth (feet) |
|---|---|---|
| 2022-12-06 | VR_well | 60.7 |
| 2022-12-06 | TZ_floor | 31.6 |
| 2022-12-06 | TZ_road | 39.35 |
| 2022-12-06 | TZ_tower | 36.2 |
No TZ Moisture Point data found
No VR Moisture Point data found
No TZ grass heigth found
No VR grass heigth found
No VR Tree DBH found
No water potential data found
No VR Grass Biomass data found
No VR OakLeaves Biomass data found
No VR PineNeedles Biomass data found
1 photos found
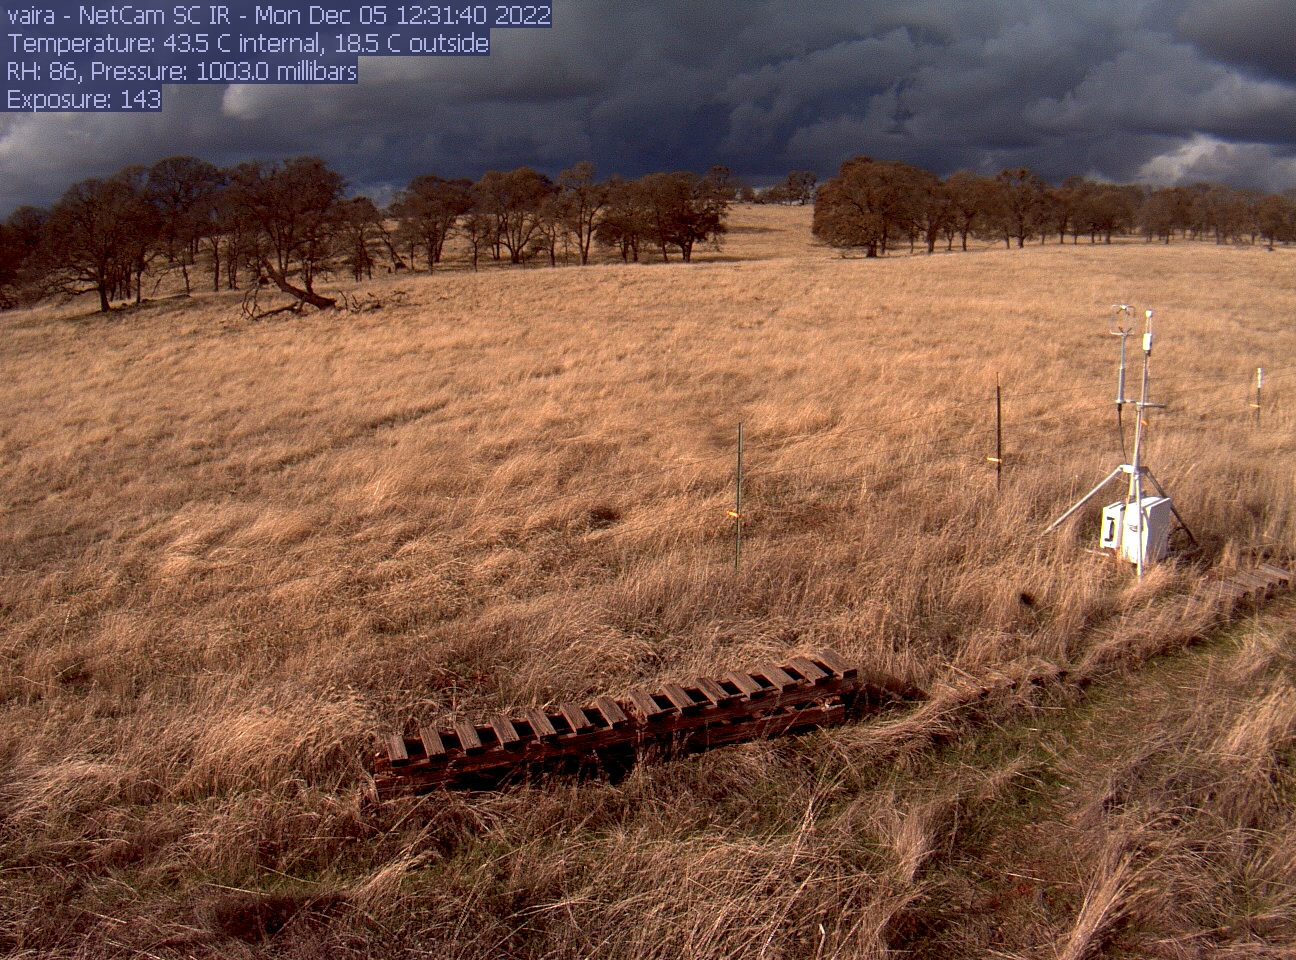
vaira_2022_12_05_123134.jpg ( 2022-12-05 20:32:18 ) Full size: 1296x960
Nice light with dark clouds
9 sets found
16 VR_met graphs found
2 VR_flux graphs found
No data found for VR_soilco2.
2 VR_pond graphs found
Can't check TZVR_mixed
3 VR_fd graphs found
4 VR_processed graphs found
4 VR_arable graphs found
6 VR_soilvue graphs found