
Field Notes
<--2022-04-27 18:30:00 | 2022-05-27 11:15:00-->Other sites visited today: Bouldin Corn | Hill Slough
Phenocam link: Searching...
Bouldin Alfalfa: 2022-05-11 09:25:00 (DOY 131)
Author: Daphne Szutu
Others: Carlos
Summary: Regular data download/cleaning, alfalfa mowed/raked and but baled, trimmed alfalfa under tower, handheld IRT measurements over Landsat8 transect, sampled 3 soil cores at Edge tower
| 2022-05-11 Bouldin Alfalfa Carlos and I arrived at 9:25 PDT. It was cool and breezy with clear skies, perfect for remote sensing. We planned today’s trip to coincide with the Landsat8 overpass so we could take handheld IRT measurements. The alfalfa has been cut and raked but not yet baled. The field to our west had been cut but not raked—the raker was sitting in the corner of the field. The field to our east was getting baled, so our field will probably be baled later today or tomorrow. I collected some data from the main tower while Carlos took veg height measurements and started trimming alfalfa. At 9:45 PDT we started walking across the field to take IRT measurements, 3 readings in each cell. For the first few cells measured only alfalfa temperature, although you had to search a bit to find alfalfa plants with enough leaves on them. For the remaining cells we took 2 alfalfa measurements and 1 bare soil measurement, although I think soil with litter was much more common than bare soil. We ended the IRT measurements at 10:15 PDT at the Edge tower. Edge Tower I downloaded CR6 (30min, 10s, 20Hz), CR23X (30min), and USB GHG (20Hz) data. For the CR6 10s and 20Hz data, I transferred the raw data files to the laptop and used CardConvert to convert to TOB1. I checked the 30min data from the CR6 and CR23X and they seemed reasonable. Carlos trimmed the alfalfa under the tower. One of the garden stakes had broken off near the ground and was leaning against the tower, with most of the flagging tape hanging off of the grounding rod. We hammered the longer half of the stake into the ground and re-tied the flagging. We came back at about 12:30pm with the car and ladder to clean the 7500. We were using a Costco foldable ladder that is probably around 8’ tall. When standing on the top rung, we could just reach the 7500. I also changed the eddy clock +30sec to match the laptop time and restarted logging after the change. Edge CO2 417ppm, H2O 307mmol/m3, T 19.4C, P 102.3kPa, SS93 -->101 after cleaning We took 3 soil cores using the slide hammer around 13:00 PDT to compare with the VWC sensors. Core depth was 0-5cm. VWC sensors are installed at 10cm depth. The soil felt pretty dry but it was easy enough to pound the core in. For each sample, I leveled the edges of the core with a screwdriver (forgot a putty knife today), capped it with the blue plastic caps, taped the caps on electrical tape, and kept the cores in a plastic bag. I weighed the “wet” weights in the lab when we got back to campus. Bouncer Tower We walked to the Bouncer tower around 10:35 PDT. I downloaded CR6 (10s, 20Hz), CR23X (30min), and USB GHG (20Hz) data. For the CR6 10s and 20Hz data, I transferred the raw data files to the laptop and used CardConvert to convert to TOB1. I checked the 30min data from the CR23X and the first part of the 20Hz data from the CR6 and it seemed reasonable. Carlos trimmed the alfalfa under the tower. I was having connection issues with the CR6 so I did not download the 30min data here. At first I thought it was a COM port issue like Joe has been seeing with his field laptop (datamule), but after talking with Joe he thinks it could be the miniUSB port on the datalogger is a bit crooked and doesn’t make a good connection. Similar to the Edge tower, one of the garden stakes had broken off near the ground and was leaning against the tower. We hammered the longer half of the stake into the ground and re-tied the flagging. The CR23X was complaining about its internal battery, which was at 2.7V. The 10s data from the upper HMP data seems noiser than the lower HMP, but the wiring seems fine. We should keep an eye on it. I changed the eddy clock +30sec to match the laptop time and restarted logging after the change. We came back around 12:15 PDT with the car and ladder to clean the 7500. We were using a Costco foldable ladder that is probably around 8’ tall. When standing on the top rung, we could just reach the 7500. Bouncer CO2 410ppm, H2O 294mmol/m3, T 19.2C, P 102.3kPa, SS89 -->100 after cleaning Main Tower We got back to the main tower around 11:10 PDT. I finished downloading the data: met, USB GHG, camera. I downloaded the FD data and cleared its memory. I downloaded the IRT data by swapping the microSD card and using CardConvert to convert the fast data to TOB1 and the slow data to TOA5. I downloaded the 20s T/RH data from the camera card. I downloaded the 30min and 20Hz CR1K Adex data. For the fast data, I moved the raw files from the CF card to the laptop and used CardConvert to convert them to TOB1. I reinserted the CF card into the datalogger and checked that card status = OK. The eddy clock here looked good. The main BAMet datalogger program still had some skipped scans. The average processing time was around 10s. After text consultation with Joe, I changed the datatable buffer option from 1 to 7. This gives more memory to processing but less for data storage. I checked that the TableFillTimes still looked good (28 days of 10s T/RH data on card, 31 days for 30min/5min data on CR1000). Carlos cleaned flux and rad sensors and finished trimming the alfalfa under the main tower and under the PL Arable. We forgot the jaz fiber/head, so no spectral measurements today. There’s no 7700 here for now so we didn’t refill the reservoir. Main CO2 420ppm, H2O 312mmol/m3, T 15.0C, P 102.3kPa, SS88 -->100 after cleaning We left at 13:05 PDT. |
Next Mowing: 2022-06-03
Veg Height (cm): Tape measure from ground to top of plant - Alfalfa mowed a week ago and raked today
7, 13, 12, 10, 14, 13, 16, 20, 15, 19, 11, 28, 18, 12, 22, avg = 15.3, stdev = 5.34
3 photos found

20220511BA_Ladder.jpg ( 2022-05-11 12:15:27 ) Full size: 1440x1920
Folding ladder in front of the Bouncer tower. Raked alfalfa in the background.
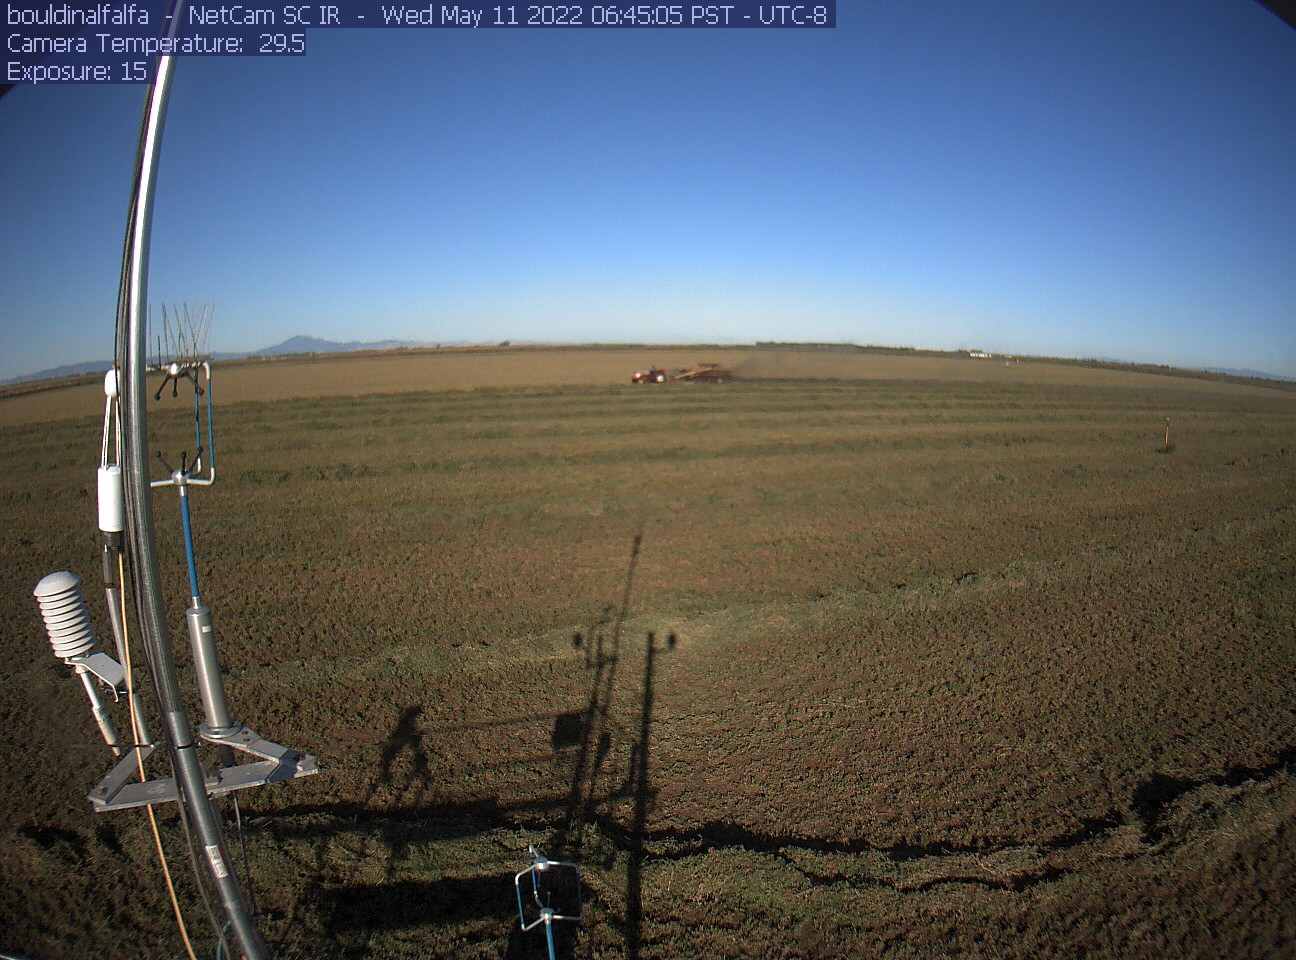
bouldinalfalfa_2022_05_11_064505.jpg ( 2022-05-11 07:46:58 ) Full size: 1296x960
Tractor raking in progress

bouldinalfalfa_2022_05_11_084505.jpg ( 2022-05-11 09:46:24 ) Full size: 1296x960
Fieldwork
7 sets found
4 BA_flux graphs found
21 BA_met graphs found
6 BA_arable graphs found
Can't check TATWBABCSB_cam
Can't check MBSWEEWPBCBA
2 BA_processed graphs found
11 BA_adex graphs found