Field Notes
<--2022-03-24 11:10:00 | 2022-04-27 16:20:00-->Other sites visited today: Tonzi
Phenocam link: Searching...
Vaira: 2022-04-12 16:00:00 (DOY 102)
Author: Joe Verfaillie
Others:
Summary: Another short power outage, Standard data collection, grass turning yellow
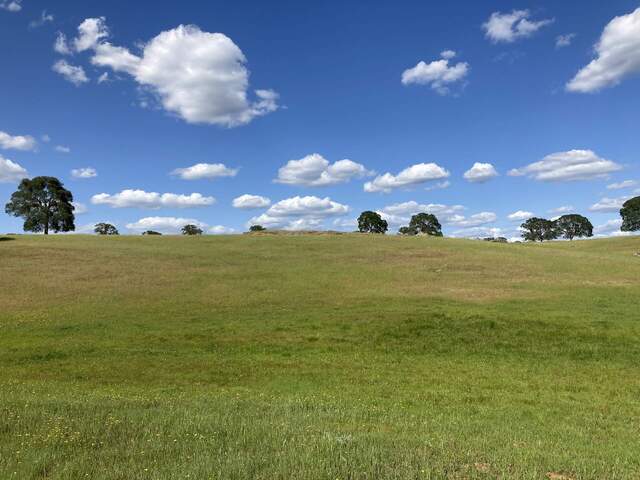
| Vaira 2022-04-12 I arrived at about 16:00PDT. Rain the day before had left a few puddles in the road but the ground surface was still mostly dry. The morning had been clear, cool and sunny with a nice breeze. This afternoon some isolated clouds began to percolate in from the west. The grass is definitely turning yellow in spots. The white popcorn flowers have been replaced by yellow dandelions. I measured the well and collected the flux, met, phenocam, and FD data. We have had a few small power drops here and another one since last visit. I check that the connections at the solar controller are good. The drop outs affect everything and multiple lines run from the solar controller box so the problem has to be there or with the batteries. Next time I can load test the batteries. The 7500 read: 426.3ppm CO2, 173.0mmol/m3 H2O, 100.1kPa, 19.1C, 103.5SS The soil co2 system didn’t seem to be giving readings – maybe the power outage had messed it up. I reloaded its program after collecting the data. I’m not sure it improved things as the CO2 probes are only read every 10min. Like the Tonzi soil co2, this system is probably not needed any more. I measured the grass height. It’s really patchy with some grasses having gotten much taller and gone to seed. Just as I set up to do spectral measurements a cloud started to pass in front of the sun. I thought I would wait for the cloud to pass but it was moving really slowly and I thought the light was stable enough so I did the spectral measurements in the cloud shadow. I left at about 16:40 |
Field Data
No tank data
Well Depth
| Date | Location | Depth (feet) |
|---|---|---|
| 2022-04-12 | TZ_floor | 25.15 |
| 2022-04-12 | TZ_road | 33.5 |
| 2022-04-12 | TZ_tower | 28.8 |
| 2022-04-12 | VR_well | 53.95 |
mode = both
Moisture Point Probes TZ
Array
(
[0] => Tower_1
[1] => Floor_South_1
[2] => Soil_Transect_4_1
[3] => Soil_Transect_3_1
[4] => Soil_Transect_2_1
[5] => SoilCO2_West_A_1
[6] => SoilCO2_West_B_1
[7] => SoilCO2_West_C_1
[8] => Tower_2
[9] => Soil_Transect_4_2
[10] => Soil_Transect_3_2
[11] => Soil_Transect_2_2
[12] => SoilCO2_West_A_2
[13] => SoilCO2_West_B_2
[14] => SoilCO2_West_C_2
[15] => Tower_3
[16] => Floor_South_3
[17] => Soil_Transect_4_3
[18] => Soil_Transect_3_3
[19] => Soil_Transect_2_3
[20] => Soil_Transect_1_3
[21] => SoilCO2_West_A_3
[22] => SoilCO2_West_B_3
[23] => SoilCO2_West_C_3
[24] => Tower_4
[25] => Floor_South_4
[26] => Soil_Transect_4_4
[27] => Soil_Transect_3_4
[28] => Soil_Transect_2_4
[29] => Soil_Transect_1_4
[30] => SoilCO2_West_A_4
[31] => SoilCO2_West_B_4
[32] => SoilCO2_West_C_4
[33] => Soil_Transect_1_1
[34] => Floor_South_2
[35] => Soil_Transect_1_2
)
| Date | DOY | Rep | Depth | Tower_1 |
Floor_South_1 |
Soil_Transect_4_1 |
Soil_Transect_3_1 |
Soil_Transect_2_1 |
SoilCO2_West_A_1 |
SoilCO2_West_B_1 |
SoilCO2_West_C_1 |
Tower_2 |
Soil_Transect_4_2 |
Soil_Transect_3_2 |
Soil_Transect_2_2 |
SoilCO2_West_A_2 |
SoilCO2_West_B_2 |
SoilCO2_West_C_2 |
Tower_3 |
Floor_South_3 |
Soil_Transect_4_3 |
Soil_Transect_3_3 |
Soil_Transect_2_3 |
Soil_Transect_1_3 |
SoilCO2_West_A_3 |
SoilCO2_West_B_3 |
SoilCO2_West_C_3 |
Tower_4 |
Floor_South_4 |
Soil_Transect_4_4 |
Soil_Transect_3_4 |
Soil_Transect_2_4 |
Soil_Transect_1_4 |
SoilCO2_West_A_4 |
SoilCO2_West_B_4 |
SoilCO2_West_C_4 |
Soil_Transect_1_1 |
Floor_South_2 |
Soil_Transect_1_2 |
Avg | Spacial Count |
Measurement Count |
|---|---|---|---|---|---|---|---|---|---|---|---|---|---|---|---|---|---|---|---|---|---|---|---|---|---|---|---|---|---|---|---|---|---|---|---|---|---|---|---|---|---|---|
| 2022-04-12 | 102 | 0 | nan | 13.2 | 8.1 | 14.1 | 13.8 | 10.9 | 19.1 | 13.5 | 8.3 | 17 | 4.8 | 16.4 | 18.2 | 12.7 | 6.3 | 14.2 | 20.7 | 20.9 | 12 | 15.9 | 23.5 | 19 | 20.1 | 21.5 | 14.8 | 28.8 | 25.4 | 15.3 | 19.3 | 38.8 | 19.6 | 25.1 | 15.6 | 18.5 | ||||||
| 2022-04-12 | 102 | 1 | nan | 13.8 | 10.6 | 14.4 | 13.2 | 10.6 | 19.4 | 13.2 | 7.4 | 16.7 | 7.5 | 16.4 | 17.5 | 13.3 | 6.3 | 14.2 | 19.8 | 21.5 | 13.4 | 16.5 | 23.5 | 19.3 | 20.4 | 20.9 | 14.3 | 28.8 | 25.2 | 15.6 | 19.9 | 39.1 | 19.6 | 24.8 | 14.8 | 17.9 | 5 | 12.4 | 9 | |||
| 2022-04-12 | 102 | 2 | nan | 19.3 | 19.3 | 5 | 9.3 | |||||||||||||||||||||||||||||||||||
| 2022-04-12 | 102 | Avg | 0-15cm | 0 | 0 | |||||||||||||||||||||||||||||||||||||
| 2022-04-12 | 102 | Avg | 15-30cm | 0 | 0 | |||||||||||||||||||||||||||||||||||||
| 2022-04-12 | 102 | Avg | 30-45cm | 0 | 0 | |||||||||||||||||||||||||||||||||||||
| 2022-04-12 | 102 | Avg | 45-60cm | 0 | 0 |
No VR Moisture Point data found
No TZ grass heigth found
Grass Height VR 14
| Date | Height reps (cm) | Location | Average | Samp | STDEV | |||||||||||||
|---|---|---|---|---|---|---|---|---|---|---|---|---|---|---|---|---|---|---|
| 2022-04-12 | 10 | 14 | 25 | 26 | 14 | 40 | 14 | 40 | 10 | 26 | 7 | 20 | 30 | 40 | GH_ALL | 22.57 | 14 | 11.28 |
No VR Tree DBH found
No water potential data found
No VR Grass Biomass data found
No VR OakLeaves Biomass data found
No VR PineNeedles Biomass data found
1 photos found

20220412VR_SkyCloudsTreesGrass.jpg ( 2022-04-12 15:53:19 ) Full size: 1920x1440
Grasses are starting to turn yellow
9 sets found
16 VR_met graphs found
2 VR_flux graphs found
2 VR_soilco2 graphs found
2 VR_pond graphs found
Can't check TZVR_mixed
3 VR_fd graphs found
4 VR_processed graphs found
4 VR_arable graphs found
No data found for VR_soilvue.

