
Field Notes
<--2022-03-10 12:15:00 | 2022-04-12 11:00:00-->Other sites visited today: Vaira
Phenocam link: Searching...
Tonzi: 2022-03-24 12:30:00 (DOY 83)
Author: Joe Verfaillie
Others:
Summary: Tower house keeping, swapped IRGAs for calibration, fixed cow fences, flipped calkit PAR, mounted solar panel to Road well cap
| Tonzi 2022-03-24 I arrived at about 12:30. It was clear sunny and warm with a very light breeze from the west. In quite moments I could hear the drone of busy insects. The trees mostly have leaves though there are a sprinkling of trees mostly west of the tower where the leaves are still just coming on – LiuKang’s tree and the IRT tree are a couple of the late bloomers. The ground surface is dry. There were a bunch of young cows around and some of them halfheartedly followed the truck hoping I would feed them. Late in the day the young cow punks stood around and watched me repair the fences they had destroyed. I put in three more posts for a few of the long spans. After I was done I turned on the power and the cows came to check out the fence – at least one of them got shocked! The only cow damage I noticed was some light chewing on the new Ethernet cable at the tower and the zcam 1 cable. I started to clean up the tower a little bit for the impending safety inspection. I removed a small motorcycle battery, box and small solar panel from the top – I think it was used to power the met data logger but hasn’t been used in years. I also cleaned up the SMAP equipment – removing tape, hose clamps, cable ties and baling wire in favor of a scaffolding clamp and U-bolts. I also bolted the battery boxes to the platform using fender washers. The SMAP stuff needs more work but it’s much better. I added some cable ties down the northwest corner to manage the cables. At the Tower top I moved the calkit PAR sensor sn 212225 from the incoming position to the reflected position and collected the data. I cleaned the Pheoncam window. The window is loose and needs some silicon to glues it back in place. I swapped the 7500s for calibration. On the Tower sn 75H-2180 came off and sn 0418 went on. At the Floor sn 0073 came off and sn 75H-2514 went on. Tower 2180: 409.4ppm CO2, 533.0mmol/m3 H2O, 99.2kPA, 23.6C, 100.4SS Tower 0418: 419.0ppm CO2, 431.1mmol/m3 H2O, 99.2kPa, 23.2C, 100.5SS Floor 0073: 399.0ppm CO2, 523.8mmol/m3 H2O, 99.2kPA, 27.3C, 102.0SS Floor 2514: 422.1ppm CO2, 353.6mmol/m3 H2O, 99.2kPa, 27.3C, 100.0SS I updated the pressure coefficients and reset the boxes. I think the change in values is mostly due to the IRGAs I took off being a little dirty. The mount for the bird spikes on 0418 came off so it has no bird spikes for now. I collected the flux, met, camera and FD data. I did the well, DBH and soil moisture measurements. I serviced the zcams. The small solar panel I took off the Tower top had a nice plate on the back that made it possible to mount it on the road well cap. I removed the other small panel that the cows have been kicking around and hope this new mounting is strong enough to resist them. I was hoping to install three new soil matrix water potential sensors from the Ameriflux year of water, but I ran out of time. It was a bit rushed anyway having only received the sensors yesterday – I can do a better job preparing them now and install them next time. I brought in three segments of the old radiation tram track to be reused most immediately for the advection experiment at BA. I left at about 17:15 PDT |
Field Data
No tank data
Well Depth
| Date | Location | Depth (feet) |
|---|---|---|
| 2022-03-24 | VR_well | 53.3 |
| 2022-03-24 | VR_pond | 18.72 |
| 2022-03-24 | TZ_floor | 25.4 |
| 2022-03-24 | TZ_road | 33.65 |
| 2022-03-24 | TZ_tower | 28.9 |
mode = both
Moisture Point Probes TZ
Array
(
[0] => Tower_1
[1] => Floor_South_1
[2] => Soil_Transect_3_1
[3] => Soil_Transect_2_1
[4] => Soil_Transect_1_1
[5] => SoilCO2_West_A_1
[6] => SoilCO2_West_B_1
[7] => SoilCO2_West_C_1
[8] => Tower_2
[9] => Floor_South_2
[10] => Soil_Transect_4_2
[11] => Soil_Transect_3_2
[12] => Soil_Transect_2_2
[13] => Soil_Transect_1_2
[14] => SoilCO2_West_A_2
[15] => SoilCO2_West_B_2
[16] => Tower_3
[17] => Floor_South_3
[18] => Soil_Transect_4_3
[19] => Soil_Transect_3_3
[20] => Soil_Transect_2_3
[21] => Soil_Transect_1_3
[22] => SoilCO2_West_A_3
[23] => SoilCO2_West_B_3
[24] => SoilCO2_West_C_3
[25] => Tower_4
[26] => Soil_Transect_4_4
[27] => Soil_Transect_3_4
[28] => Soil_Transect_2_4
[29] => Soil_Transect_1_4
[30] => SoilCO2_West_A_4
[31] => SoilCO2_West_B_4
[32] => SoilCO2_West_C_4
[33] => Soil_Transect_4_1
[34] => SoilCO2_West_C_2
[35] => Floor_South_4
)
| Date | DOY | Rep | Depth | Tower_1 |
Floor_South_1 |
Soil_Transect_3_1 |
Soil_Transect_2_1 |
Soil_Transect_1_1 |
SoilCO2_West_A_1 |
SoilCO2_West_B_1 |
SoilCO2_West_C_1 |
Tower_2 |
Floor_South_2 |
Soil_Transect_4_2 |
Soil_Transect_3_2 |
Soil_Transect_2_2 |
Soil_Transect_1_2 |
SoilCO2_West_A_2 |
SoilCO2_West_B_2 |
Tower_3 |
Floor_South_3 |
Soil_Transect_4_3 |
Soil_Transect_3_3 |
Soil_Transect_2_3 |
Soil_Transect_1_3 |
SoilCO2_West_A_3 |
SoilCO2_West_B_3 |
SoilCO2_West_C_3 |
Tower_4 |
Soil_Transect_4_4 |
Soil_Transect_3_4 |
Soil_Transect_2_4 |
Soil_Transect_1_4 |
SoilCO2_West_A_4 |
SoilCO2_West_B_4 |
SoilCO2_West_C_4 |
Soil_Transect_4_1 |
SoilCO2_West_C_2 |
Floor_South_4 |
Avg | Spacial Count |
Measurement Count |
|---|---|---|---|---|---|---|---|---|---|---|---|---|---|---|---|---|---|---|---|---|---|---|---|---|---|---|---|---|---|---|---|---|---|---|---|---|---|---|---|---|---|---|
| 2022-03-24 | 83 | 0 | nan | 17.3 | 8.8 | 13.8 | 15 | 10.9 | 18.8 | 14.1 | 8.6 | 23.1 | 11.1 | 11.2 | 21 | 21.3 | 9.7 | 16.1 | 7.5 | 25.8 | 26.8 | 15.9 | 22.1 | 25.7 | 25.1 | 24.6 | 25.1 | 18.4 | 35.7 | 19.3 | 27.4 | 40 | 23.9 | 34 | 25.6 | 26.2 | ||||||
| 2022-03-24 | 83 | 1 | nan | 16.5 | 11.5 | 13.2 | 9.1 | 10.9 | 19.1 | 14.4 | 9.4 | 22.8 | 13 | 12.1 | 20.6 | 22.5 | 10 | 16.1 | 7.8 | 26 | 27.1 | 15.6 | 22.1 | 26.5 | 25.7 | 23.7 | 24.8 | 17.6 | 36.5 | 19.9 | 26.8 | 42.8 | 23.6 | 34 | 25.9 | 25.6 | 9.7 | 17.6 | 15.3 | |||
| 2022-03-24 | 83 | 2 | nan | 9.4 | 11.8 | 27.4 | 17.9 | 26.5 | 17 | 16.8 | ||||||||||||||||||||||||||||||||
| 2022-03-24 | 83 | Avg | 0-15cm | 0 | 0 | |||||||||||||||||||||||||||||||||||||
| 2022-03-24 | 83 | Avg | 15-30cm | 0 | 0 | |||||||||||||||||||||||||||||||||||||
| 2022-03-24 | 83 | Avg | 30-45cm | 0 | 0 | |||||||||||||||||||||||||||||||||||||
| 2022-03-24 | 83 | Avg | 45-60cm | 0 | 0 |
No VR Moisture Point data found
No TZ grass heigth found
Grass Height VR 17
| Date | Height reps (cm) | Location | Average | Samp | STDEV | ||||||||||||||||
|---|---|---|---|---|---|---|---|---|---|---|---|---|---|---|---|---|---|---|---|---|---|
| 2022-03-24 | 5 | 2 | 20 | 14 | 7 | 15 | 11 | 7 | 7 | 8 | 5 | 5 | 4 | 5 | 7 | 3 | 7 | GH_ALL | 7.76 | 17 | 4.57 |
Tree DBH
| Date | Tag# | Reading (mm) |
|---|---|---|
| 2022-03-24 | 1 | 18.9 |
| 2022-03-24 | 102 | 15.7 |
| 2022-03-24 | 2 | 16.3 |
| 2022-03-24 | 245 | 4.3 |
| 2022-03-24 | 3 | 20.2 |
| 2022-03-24 | 4 | 16.5 |
| 2022-03-24 | 5 | 8.9 |
| 2022-03-24 | 6 | 20.3 |
| 2022-03-24 | 7 | 9.8 |
| 2022-03-24 | 72 | 13.4 |
| 2022-03-24 | 79 | 13.1 |
No water potential data found
No TZ Grass Biomass data found
No TZ OakLeaves Biomass data found
No TZ PineNeedles Biomass data found
1 photos found
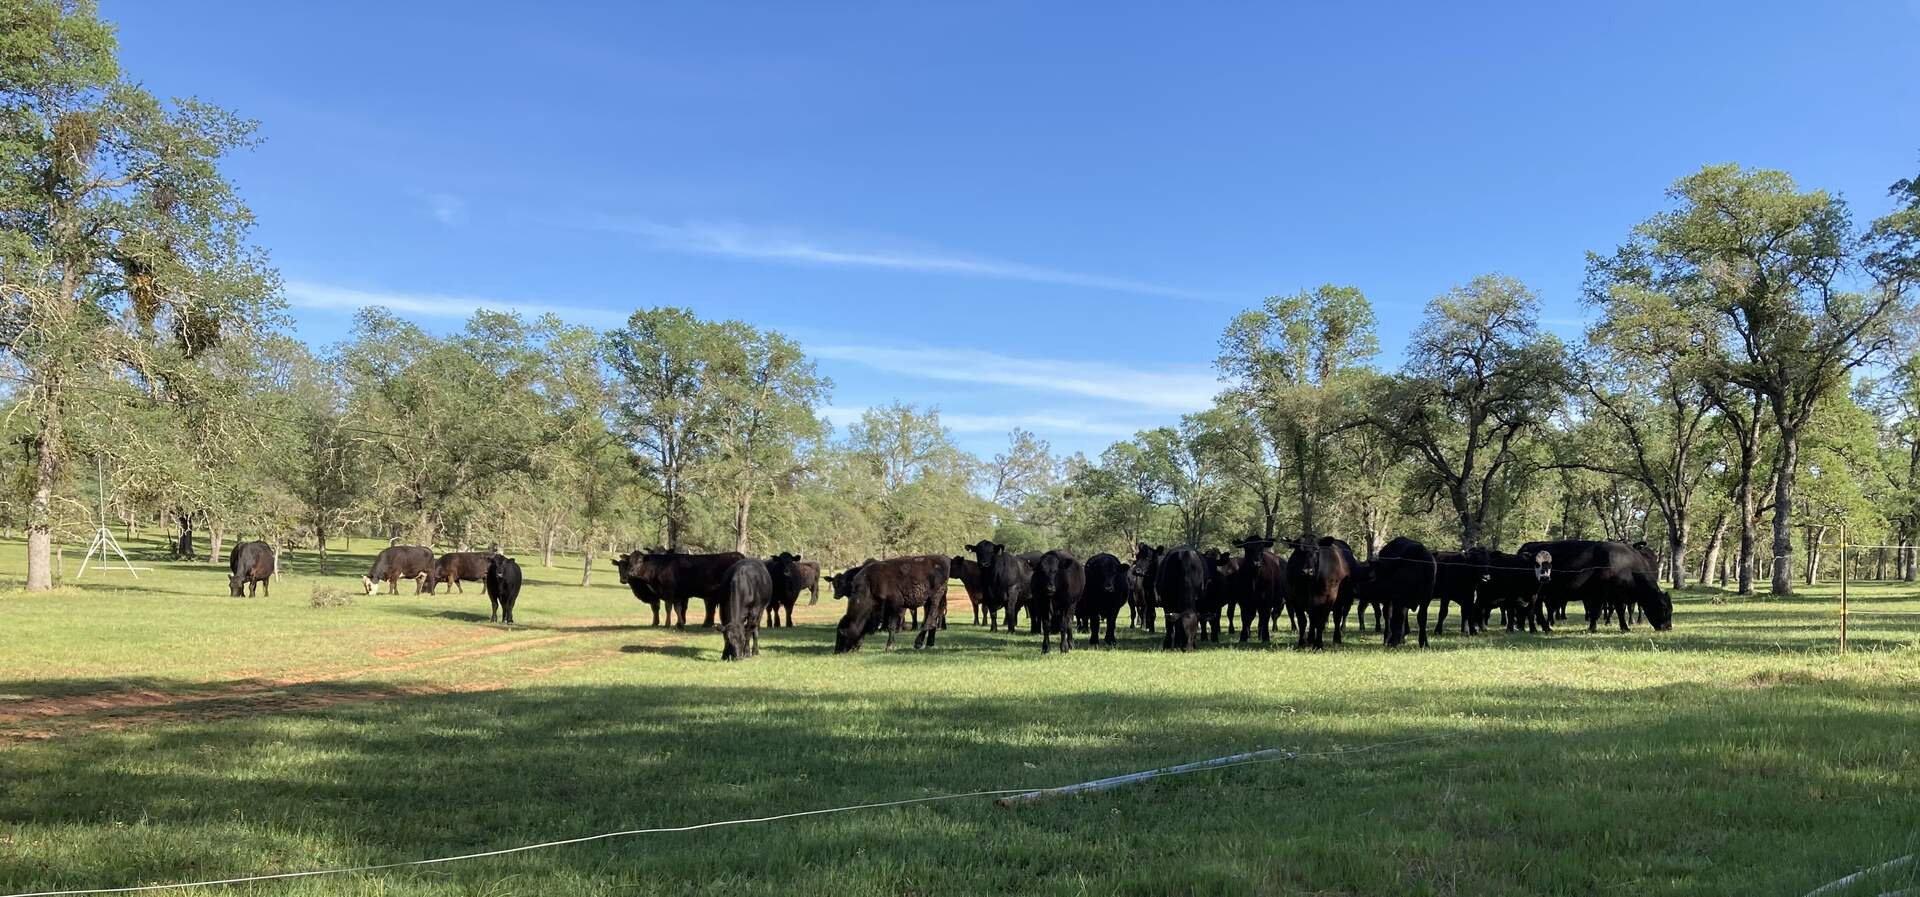
20220324TZ_YoungCowPunks.jpg ( 2022-03-24 17:07:46 ) Full size: 1920x897
Young cow punks have wrecked havoc on the fences.
16 sets found
No data found for TZ_Fenergy.
11 TZ_tmet graphs found
11 TZ_soilco2 graphs found
Can't check TZ_mixed
3 TZ_mixed graphs found
1 TZ_fflux graphs found
8 TZ_fmet graphs found
No data found for TZ_tram.
3 TZ_co2prof graphs found
1 TZ_irt graphs found
No data found for TZ_windprof.
1 TZ_tflux graphs found
2 TZ_sm graphs found
Can't check TZ_met
1 TZ_met graphs found
Can't check TZVR_mixed
8 TZ_osu graphs found
3 TZ_fd graphs found
Tonzi Z-cam data