
Field Notes
<--2005-06-10 10:30:00 | 2005-07-19 14:14:00-->Other sites visited today: Vaira
Phenocam link: Searching...
Tonzi: 2005-06-23 10:30:00 (DOY 174)
Author: Dennis Baldocchi
Others: Xinghuan Chen, Gretchen Miller
| Field notes June 23, 2005
D174 Tonzi Ranch Today is the big Isotope study. Dawson and Biomet lab are in force. Ddb, Xinghuan Chen and Gretchen Miller arrived around 1030 to do soil moisture, download data and check flux system. Mostly clear day, mild winds, moderate temperature (up to 31 C) and low humidity. Downloaded flux data on tower and floor. CO2 cal was reading 427.23 CO2 zero was -1.6 Tower W: -.67; u: 2.4; v: -.43; T: 23.7; q: 3.1; C: 1.5 Floor W: 0.02; u: .1; v: 0.05; T: 30.2; q: 2.17; c: 1.31 Checked soil CO2 probes. They all seem to be working, with nice gradients. Only concern is sensor #4 under the tree. It was reading 42 mv, but the probe was saying it was about 1700 ppm, which on a 20,000 ppm scale over 5000 mv should be 420 mv. I am wondering if there is a factor 10 divide in the program, or if the resistor is different for that sensor. It seems to be working otherwise. In Pm Matthias came took spectral reflectance measurements. Jessica was measuring A/Ci and fluorescence Jorge was measuring soil respiration and soil Keeling plots Alex was measuring sugars and sap isotope content. Todds group had an REA and canopy profile system operating for Keeling plots. |
Field Data
No tank data
No TZ Well data found
No TZ Moisture Point data found
No VR Moisture Point data found
No TZ grass heigth found
No VR grass heigth found
No TZ Tree DBH found
No water potential data found
No TZ Grass Biomass data found
No TZ OakLeaves Biomass data found
No TZ PineNeedles Biomass data found
1 photos found
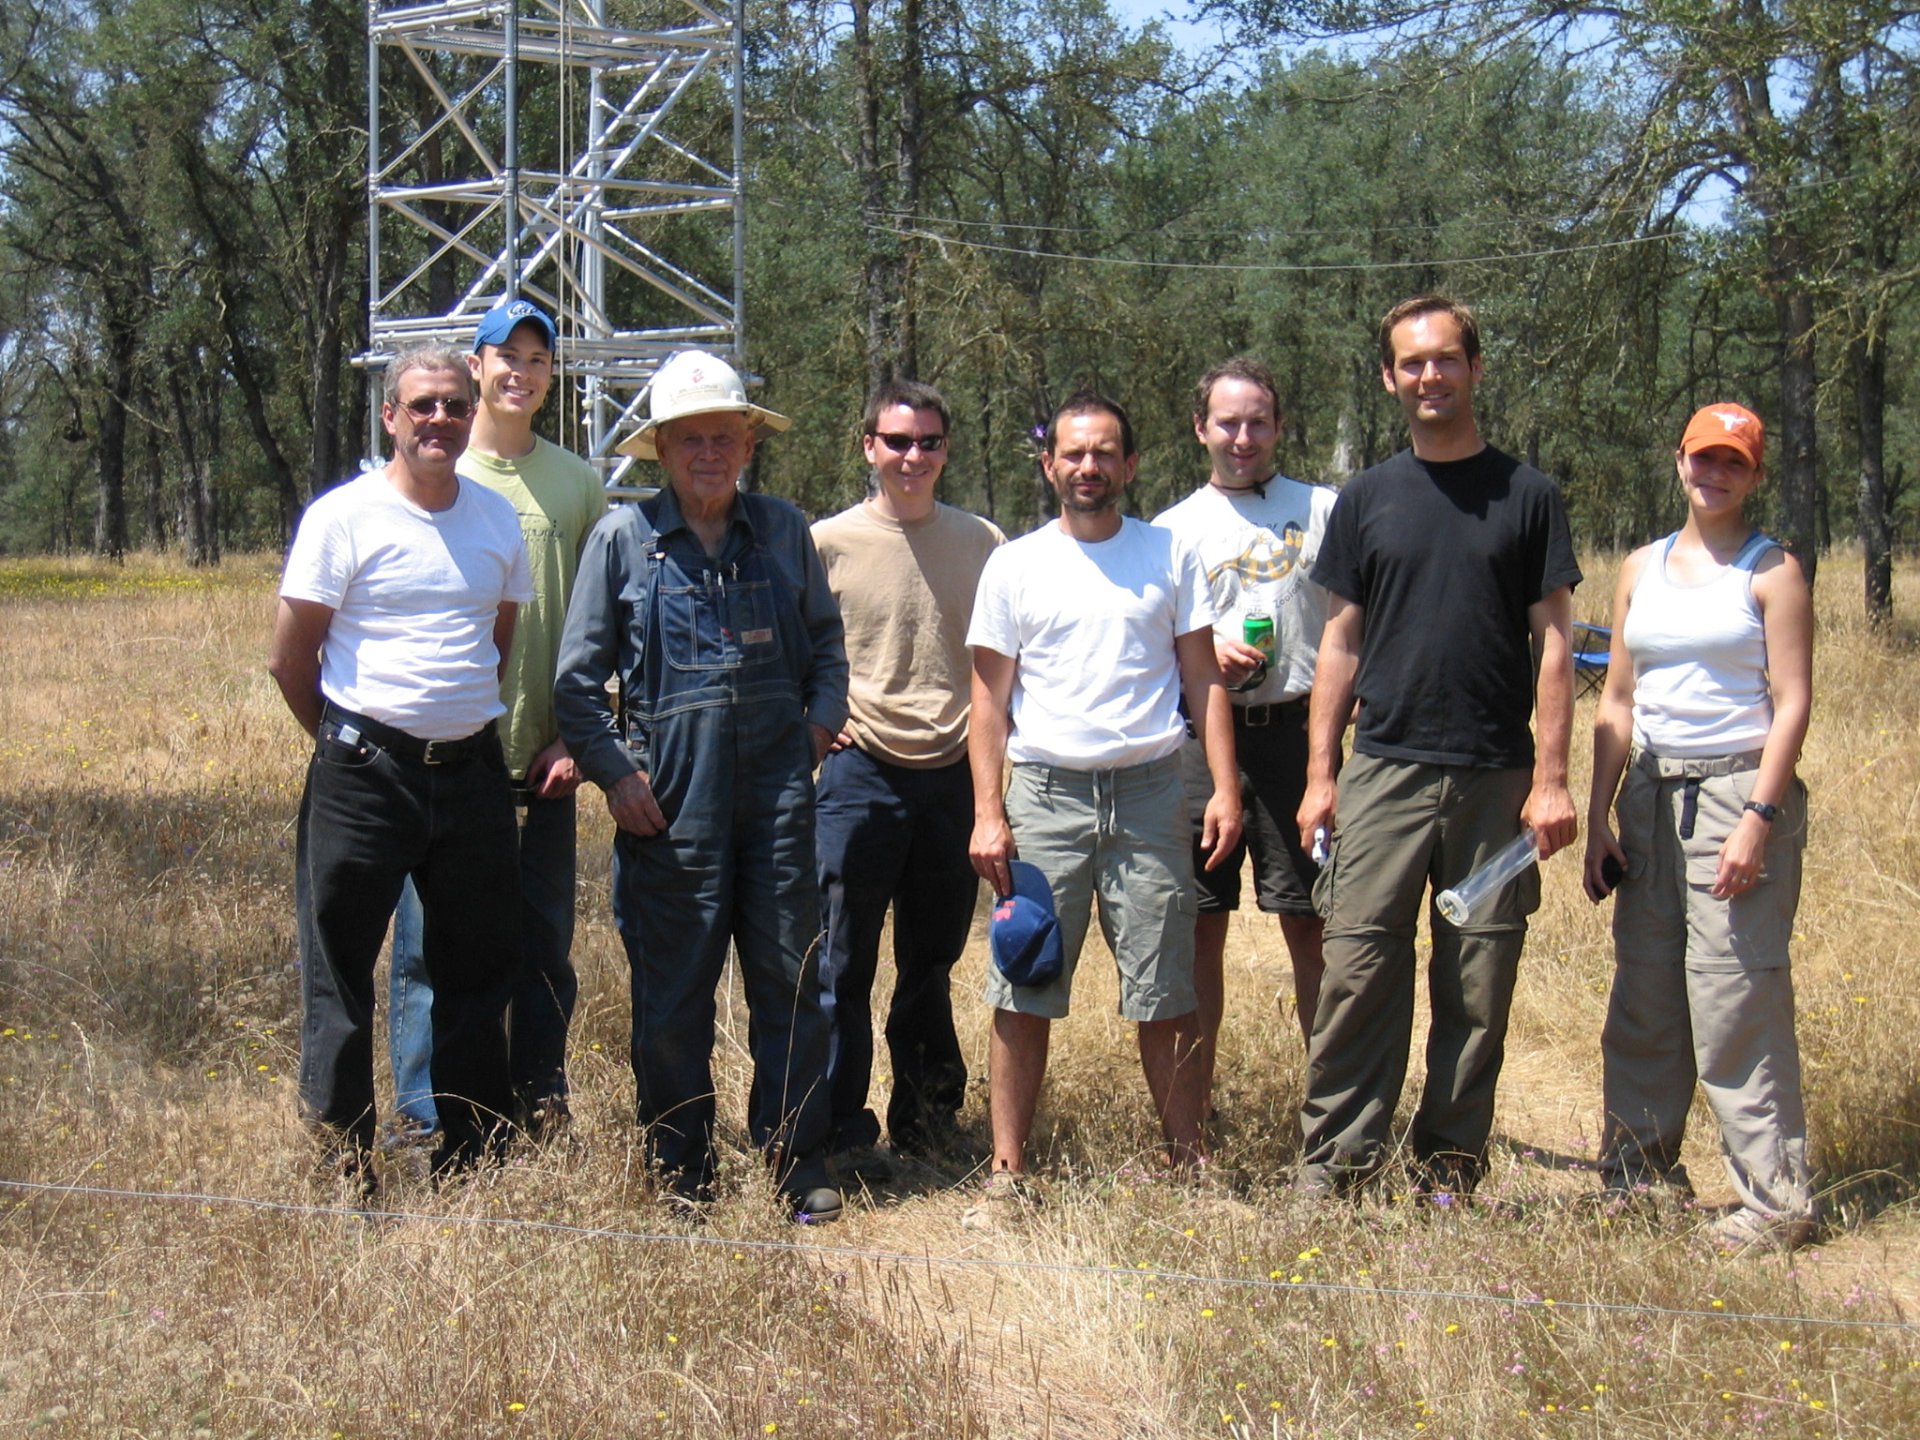
20050624TZ_WithMrTonzi.jpg ( 2005-06-24 11:42:12 ) Full size: 1920x1440
Scientists with Mr. Tonzi in front of the eddy scaffolding
16 sets found
No data found for TZ_Fenergy.
11 TZ_tmet graphs found
No data found for TZ_soilco2.
Can't check TZ_mixed
3 TZ_mixed graphs found
No data found for TZ_fflux.
8 TZ_fmet graphs found
No data found for TZ_tram.
No data found for TZ_co2prof.
No data found for TZ_irt.
1 TZ_windprof graphs found
No data found for TZ_tflux.
2 TZ_sm graphs found
Can't check TZ_met
1 TZ_met graphs found
Can't check TZVR_mixed
No data found for TZ_osu.
No data found for TZ_fd.
Tonzi Z-cam data