
Field Notes
<--2022-03-01 17:10:00 | 2022-03-31 09:50:00-->Other sites visited today: Bouldin Corn | Bouldin Alfalfa | West Pond | East End | Mayberry | Gilbert Tract
Phenocam link: Searching...
Hill Slough: 2022-03-15 09:30:00 (DOY 74)
Author: Daphne Szutu
Others: Robert
Summary: Regular data collection/cleaning, rained overnight, many birds, low tide, changed eddy clock +1min
| 2022-03-15 Hill Slough Robert and I arrived at 9:30 PDT. It had rained <0.5cm overnight and it was still overcast with a cold breeze. It was low tide and the water was right at the bottom of the staff gauge. It was a little hard to read because the bottom of the staff gauge bends up slightly. I'll call the staff gauge reading at 4.1 ft at 8:38 PST. The miniDOT was barely touching the water. There were many birds to see and hear. I downloaded met, camera, and USB GHG data. Robert cleaned flux and rad sensors. There was a big droplet on the top 7500 lens from the rain so the SS was particularly low. The diffuse PAR has been spiky last month but seems ok now after a power cycle of the CR10X. The wash reservoir was 90% full; we topped it off. I changed the eddy clock from 8:51 to 8:52 to match the laptop time and restarted logging after the change. LI-7500 readings: CO2 530ppm --> forgot to write after cleaning H2O -60ppm --> forgot to write after cleaning T 16.6C P 102.3kPa SS 46--> 100 after cleaning LI7700 readings: CH4 1.94ppm RSSI 48 --> 71 after cleaning We left at 9:55 PDT. 0.5-1cm more rain is forecast for Saturday. |
1 photos found
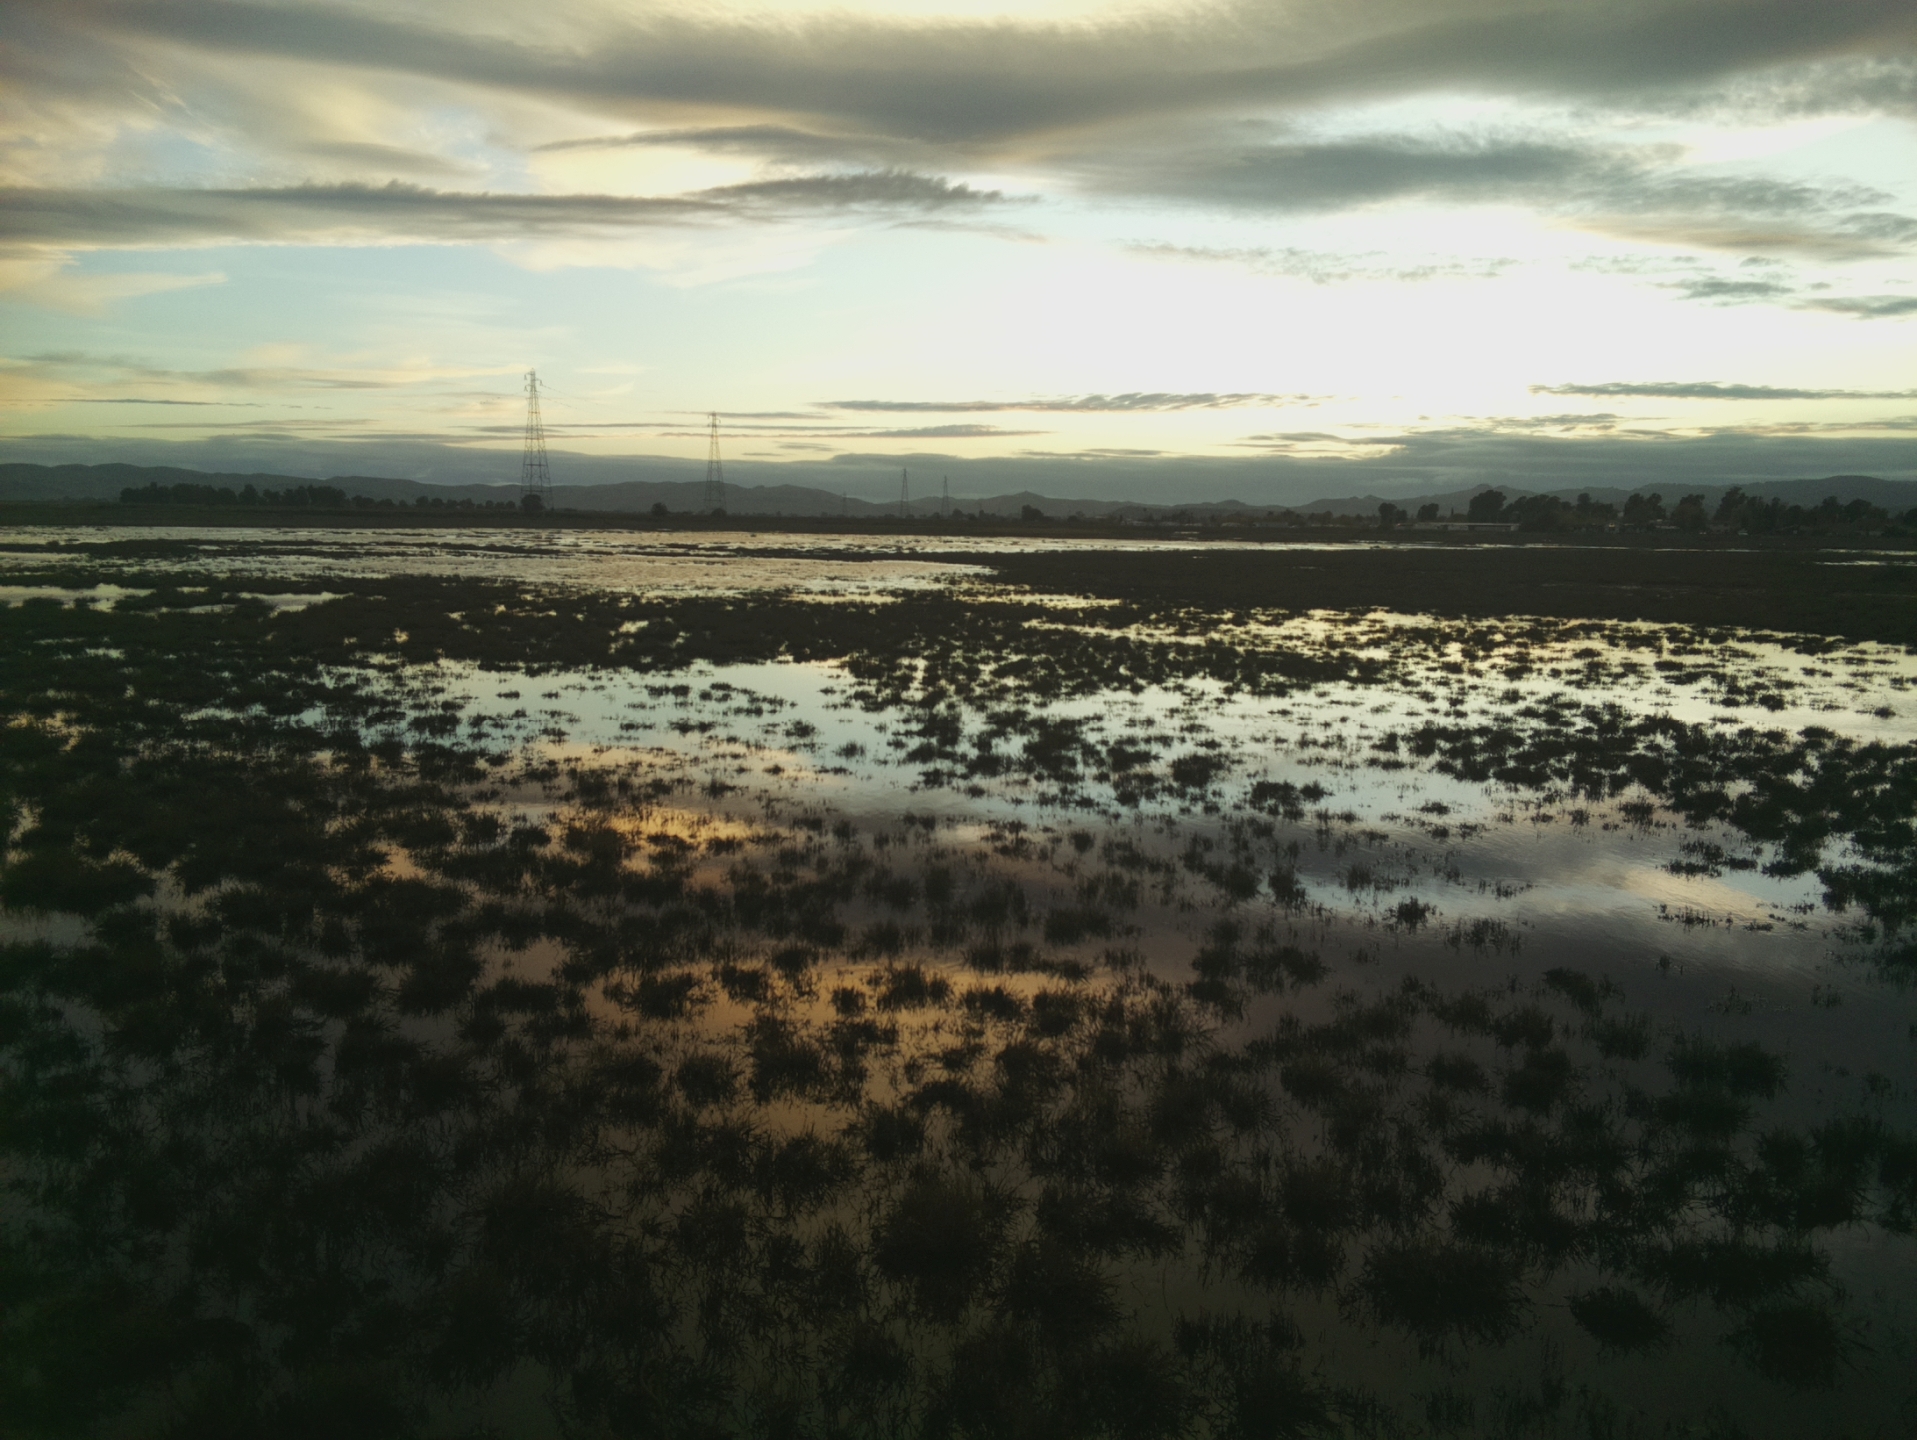
HS_picam_20220314_1815.jpg ( 2022-03-14 18:15:05 ) Full size: 1917x1440
Nice sunset at low tide
4 sets found
21 HS_met graphs found
4 HS_flux graphs found
1 HS_cam graphs found
Can't check HS_Processed
2 HS_Processed graphs found