Field Notes
<--2022-02-09 13:30:00 | 2022-03-10 12:15:00-->Other sites visited today: Vaira
Phenocam link: Searching...
Tonzi: 2022-02-23 12:30:00 (DOY 54)
Author: Joe Verfaillie
Others:
Summary: Few trees have leaves, Checked Tower guy wires, replaced z-cam 1 clock battery, added solar charged lithium batteries to Road Well and IRT CR1000, Bad power line to Floor HMP fan patched, checked SHF and Theta serial numbers
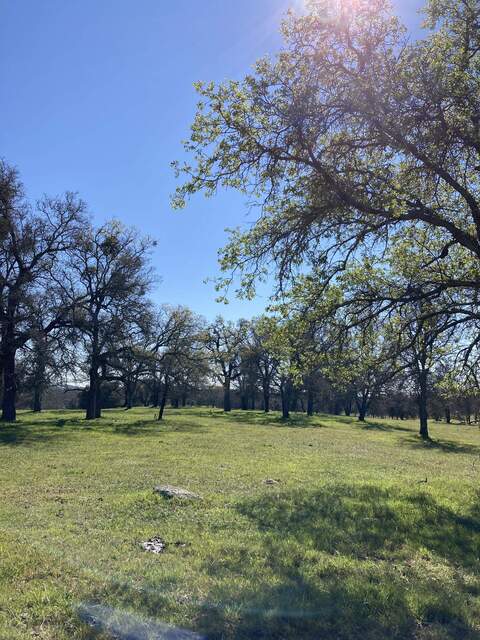
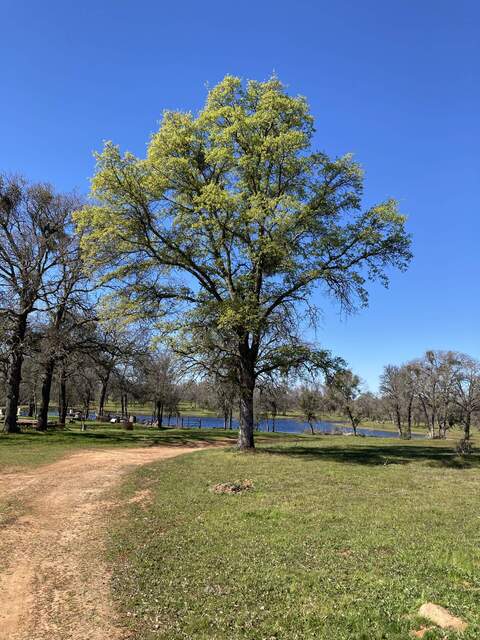
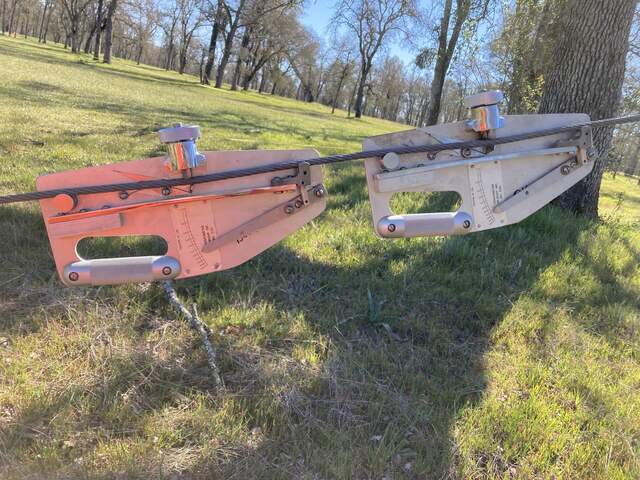
| Tonzi 2022-02-23 I arrived at about 12:30 PST. It was clear and sunny but cold with a colder wind from the west. I counted maybe ten trees between the gate and the Tonzi house that already have leaves. The mutant tree near the Tonzi house is almost completely leafed out. I didn’t see any trees near the tower with leaves yet. The road and ground surface are dry and hard. At the tower I checked the guy wire tensions. This is something we should do once or twice a year but not something I have ever done. The manual says the guy wires should all be 600lbs +-25 lbs. There are two tensiometers in the lab that came with the tower and are supposed to be calibrated for its guy wires. However one tensiometer is labeled “ok” and the other “bad?”. I fixed a loose screw on the “bad” one but it still reads about 150 lbs less than the “ok” one. You really need two working tensiometers and two people to adjust the guy wires because as you work on one wire it affects the opposite guy wire. Never the less I gave it a try: Northeast anchor: Upper SE: 600, Upper NW: 560, Mid: 625, Bottom: 675 Northwest anchor: Upper NE: 400, Upper SW: 560, Mid: 510, Bottom: 310 Southwest anchor: Upper SE: 560, Upper NE: 650, Mid: 510, Bottom: 575 Southeast anchor: Upper NE: 475, Upper SW: 330, Mid: 475, Bottom: 450 I decided to try to tighten up the northwest and southeast lines as these were the farthest out of spec and opposite each other. Some of the excess cable is fed through the turnbuckles and fittings to prevent movement (I think). Each turnbuckle also has locking nuts on either end. Turnbuckles by design have right hand treads on one end and left hand threads on the other. I was careful with the first nut twisting it in both directions to see which one it was. The upper nut was right hand treaded and the lower nut was left hand threaded. Then I assumed all the other turnbuckles were the same and was unable to get the other nuts loose. By chance I turned a nut the “wrong” way and discovered that the turnbuckles are not all installed in the same orientation. Rather the end with a right hand thread is marked with a “K” and the end with a left and thread is marked with an “L”. Once I figured that out, the nuts were much easier to get loose. I worked back and forth on the southeast and northwest guy wire tightening and loosening until they were all around 600 lbs. It could still use some fine tuning with two people and two working tensiometers. I collected the Tower flux, met and camera data, the Floor flux and met data, the FD data and the well data. I measured DBH, and the wells. I serviced the z-cams. I replaced the clock battery in z-cam 1. The Tower 7500: 416.7ppm CO2, 167.4mmol/m3 H2O, 99.2kPa, 11.3C, 100.1SS The Floor 7500: 414.4ppm CO2, 237.8mmol/m3 H2O, 99.4kPa, 12.8C, 105.8SS The IRT CR1000 has been losing overnight data due to a weak battery and we lose data from the Road well when its battery pack runs out. Today I added a solar panel to the Road Well and swapped out the SLA battery and charger at the IRT CR1000 for a DC-DC converter and a lithium power pack. The lithium power pack for the IRT CR1000 might be too small (3Ah?) and the power pack at the well was only half charged. We will see how they do and I’ll order some more lithium power packs. The Floor HMP fan was not working. I swapped it out with a new fan but the new one didn’t work either. Then I found a splice in the cable on the ground that had all rotted away and another spot near the screw terminal where the insulation was rotted too. I cut out the bad parts and spliced it back together with screw terminals but is needs a replacement wire next time and some conduit. I checked on the serial numbers of the Theta probes and the SHF plates: Theta probes #1 sn 31/085 #2 sn 31/100 #3 sn 31/092 #4 sn 31/016 #5 sn 31/033 #6 – replaced recently, no label on the cable #7 sn 54/004 Soil Heat Flux Plates: #1 sn 000138 #2 Homemade cable and label – the label is smeared to unreadable #3 sn 000140 #4 sn 000068 #5 sn 000144 I left at about 17:20 |
Field Data
No tank data
Well Depth
| Date | Location | Depth (feet) |
|---|---|---|
| 2022-02-23 | VR_well | 52.3 |
| 2022-02-23 | VR_pond | 19.84 |
| 2022-02-23 | TZ_floor | 26.05 |
| 2022-02-23 | TZ_road | 35.25 |
| 2022-02-23 | TZ_tower | 29.45 |
mode = both
Moisture Point Probes TZ
Array
(
[0] => Tower_1
[1] => Floor_South_1
[2] => Soil_Transect_4_1
[3] => Soil_Transect_3_1
[4] => Soil_Transect_2_1
[5] => Soil_Transect_1_1
[6] => SoilCO2_West_A_1
[7] => SoilCO2_West_B_1
[8] => SoilCO2_West_C_1
[9] => Tower_2
[10] => Floor_South_2
[11] => Soil_Transect_4_2
[12] => Soil_Transect_3_2
[13] => Soil_Transect_2_2
[14] => Soil_Transect_1_2
[15] => SoilCO2_West_A_2
[16] => SoilCO2_West_B_2
[17] => SoilCO2_West_C_2
[18] => Tower_3
[19] => Floor_South_3
[20] => Soil_Transect_4_3
[21] => Soil_Transect_3_3
[22] => Soil_Transect_2_3
[23] => Soil_Transect_1_3
[24] => SoilCO2_West_A_3
[25] => SoilCO2_West_B_3
[26] => SoilCO2_West_C_3
[27] => Tower_4
[28] => Floor_South_4
[29] => Soil_Transect_4_4
[30] => Soil_Transect_3_4
[31] => Soil_Transect_2_4
[32] => Soil_Transect_1_4
[33] => SoilCO2_West_A_4
[34] => SoilCO2_West_B_4
[35] => SoilCO2_West_C_4
)
| Date | DOY | Rep | Depth | Tower_1 |
Floor_South_1 |
Soil_Transect_4_1 |
Soil_Transect_3_1 |
Soil_Transect_2_1 |
Soil_Transect_1_1 |
SoilCO2_West_A_1 |
SoilCO2_West_B_1 |
SoilCO2_West_C_1 |
Tower_2 |
Floor_South_2 |
Soil_Transect_4_2 |
Soil_Transect_3_2 |
Soil_Transect_2_2 |
Soil_Transect_1_2 |
SoilCO2_West_A_2 |
SoilCO2_West_B_2 |
SoilCO2_West_C_2 |
Tower_3 |
Floor_South_3 |
Soil_Transect_4_3 |
Soil_Transect_3_3 |
Soil_Transect_2_3 |
Soil_Transect_1_3 |
SoilCO2_West_A_3 |
SoilCO2_West_B_3 |
SoilCO2_West_C_3 |
Tower_4 |
Floor_South_4 |
Soil_Transect_4_4 |
Soil_Transect_3_4 |
Soil_Transect_2_4 |
Soil_Transect_1_4 |
SoilCO2_West_A_4 |
SoilCO2_West_B_4 |
SoilCO2_West_C_4 |
Avg | Spacial Count |
Measurement Count |
|---|---|---|---|---|---|---|---|---|---|---|---|---|---|---|---|---|---|---|---|---|---|---|---|---|---|---|---|---|---|---|---|---|---|---|---|---|---|---|---|---|---|---|
| 2022-02-23 | 54 | 0 | nan | 25.8 | 12.7 | 8 | 14.4 | 15.6 | 15 | 21.4 | 21.2 | 14.4 | 30.1 | 13.9 | 16.1 | 26.1 | 27.1 | 13.6 | 20.6 | 20.3 | 22.2 | 31.3 | 34.3 | 19.8 | 26.2 | 39.6 | 29.6 | 29 | 28.5 | 30.4 | 39.7 | 52.3 | 25.4 | 37.1 | 44.8 | 29.4 | 39.1 | 40.5 | 44.8 | |||
| 2022-02-23 | 54 | 1 | nan | 26.4 | 14.5 | 8.3 | 14.4 | 16.2 | 14.7 | 18.2 | 13.2 | 30.1 | 17.9 | 16.1 | 26.5 | 26.8 | 13 | 11.8 | 22.2 | 30.1 | 33.8 | 19.3 | 26.2 | 39.6 | 29.9 | 28.5 | 30.1 | 40.8 | 50.3 | 25.1 | 35.4 | 46.3 | 29.4 | 43.1 | 46.6 | |||||||
| 2022-02-23 | 54 | 2 | nan | 13.2 | 10.6 | 29.3 | 42.5 | |||||||||||||||||||||||||||||||||||
| 2022-02-23 | 54 | Avg | 0-15cm | 0 | 0 | |||||||||||||||||||||||||||||||||||||
| 2022-02-23 | 54 | Avg | 15-30cm | 0 | 0 | |||||||||||||||||||||||||||||||||||||
| 2022-02-23 | 54 | Avg | 30-45cm | 0 | 0 | |||||||||||||||||||||||||||||||||||||
| 2022-02-23 | 54 | Avg | 45-60cm | 0 | 0 |
No VR Moisture Point data found
No TZ grass heigth found
No VR grass heigth found
Tree DBH
| Date | Tag# | Reading (mm) |
|---|---|---|
| 2022-02-23 | 1 | 17.3 |
| 2022-02-23 | 102 | 15.6 |
| 2022-02-23 | 2 | 15.4 |
| 2022-02-23 | 245 | 3.9 |
| 2022-02-23 | 3 | 20.1 |
| 2022-02-23 | 4 | 16.0 |
| 2022-02-23 | 5 | 8.6 |
| 2022-02-23 | 6 | 20.2 |
| 2022-02-23 | 7 | 9.6 |
| 2022-02-23 | 72 | 12.9 |
| 2022-02-23 | 79 | 13.0 |
No water potential data found
No TZ Grass Biomass data found
No TZ OakLeaves Biomass data found
No TZ PineNeedles Biomass data found
3 photos found

20220223TZ_SomeTreesHaveLeaves.jpg ( 2022-02-23 12:25:03 ) Full size: 1440x1920
On the way in I saw maybe ten trees that had leaves.

20220223TZ_MutantTree.jpg ( 2022-02-23 12:27:19 ) Full size: 1440x1920
The tree near the Tonzi house always has leaves early.

20220223TZ_Tensiometers.jpg ( 2022-02-23 12:54:01 ) Full size: 1920x1440
One Tensiometer reads about 150 lbs lower.
16 sets found
No data found for TZ_Fenergy.
11 TZ_tmet graphs found
11 TZ_soilco2 graphs found
Can't check TZ_mixed
3 TZ_mixed graphs found
1 TZ_fflux graphs found
8 TZ_fmet graphs found
No data found for TZ_tram.
3 TZ_co2prof graphs found
1 TZ_irt graphs found
No data found for TZ_windprof.
1 TZ_tflux graphs found
2 TZ_sm graphs found
Can't check TZ_met
1 TZ_met graphs found
Can't check TZVR_mixed
8 TZ_osu graphs found
3 TZ_fd graphs found
Tonzi Z-cam data

