
Field Notes
<--2022-01-02 15:20:00 | 2022-02-03 12:00:00-->Other sites visited today: West Pond | East End | Bouldin Corn | Mayberry | Gilbert Tract
Phenocam link: Searching...
Bouldin Alfalfa: 2022-01-20 13:30:00 (DOY 20)
Author: Daphne Szutu
Others:
Summary: Regular data collection/cleaning, Alfalfa still short, Changed eddy clock +1min, Changed phenocam clock +1min
| 2022-01-20 Bouldin Alfalfa I arrived at 13:30 PST. It was mostly clear and sunny with fog/haze on the horizons. A cold breeze is picking up slightly compared to the morning. A digger and a truck were working in the fields northeast of us. I think they were clearing out the channel because there was a long, large row of soil piled up parallel to the levee. The dirt road was fine to drive on today. Not much rain this month and no rain forecasted in the next 10 days. The patchiness of our alfalfa field seemed more obvious to me today, perhaps because we were recently discussing how canopy heat storage is heterogeneous in patchy fields. The northern corner of the field is relatively dense compared to the 100m stretch north of our tower. The alfalfa is still relatively short. There were several large mushrooms scattered south of the tower. They were white or light brown on top with ruffled edges and dark brown undersides. The upper boardwalk is starting to weaken right where we step down after cleaning the flux sensors. We should rotate or replace it. I downloaded met, cam, and USB GHG data. I don’t remember the wash reservoir level but I know I refilled it. I cleaned flux and rad sensors. I downloaded the FD data and cleared its memory. I downloaded the IRT data by swapping the microSD card and using CardConvert to convert the fast data to TOB1 and the slow data to TOA5. I checked the eddy clock; I stopped logging, changed the clock +1min from 13:50 to 13:51 to match the laptop time and restarted logging. I checked the phenocam clock and changed it +1min from 13:54 to 13:54 to match the laptop time. I took spectral and veg height measurements. I checked the undercanopy PAR sensor; it was clear and level. LI-7500 readings: CO2 447ppm H2O 480ppm T 17.6C P 102.5kPa SS 101 --> 102 after cleaning LI7700 readings: CH4 2.6ppm RSSI 62 --> 89 after cleaning I left at 14:10 PST. |
Next Mowing: 2022-01-22
Veg Height (cm): Tape measure from ground to top of plant - Patchy
19, 27, 30, 22, 25, 15, 19, 21, 24, 19, avg = 22.1, stdev = 4.46
3 photos found

20220120BA_Mushrooms.jpg ( 2022-01-20 14:00:02 ) Full size: 1920x1440
Large mushrooms spotted south of the tower
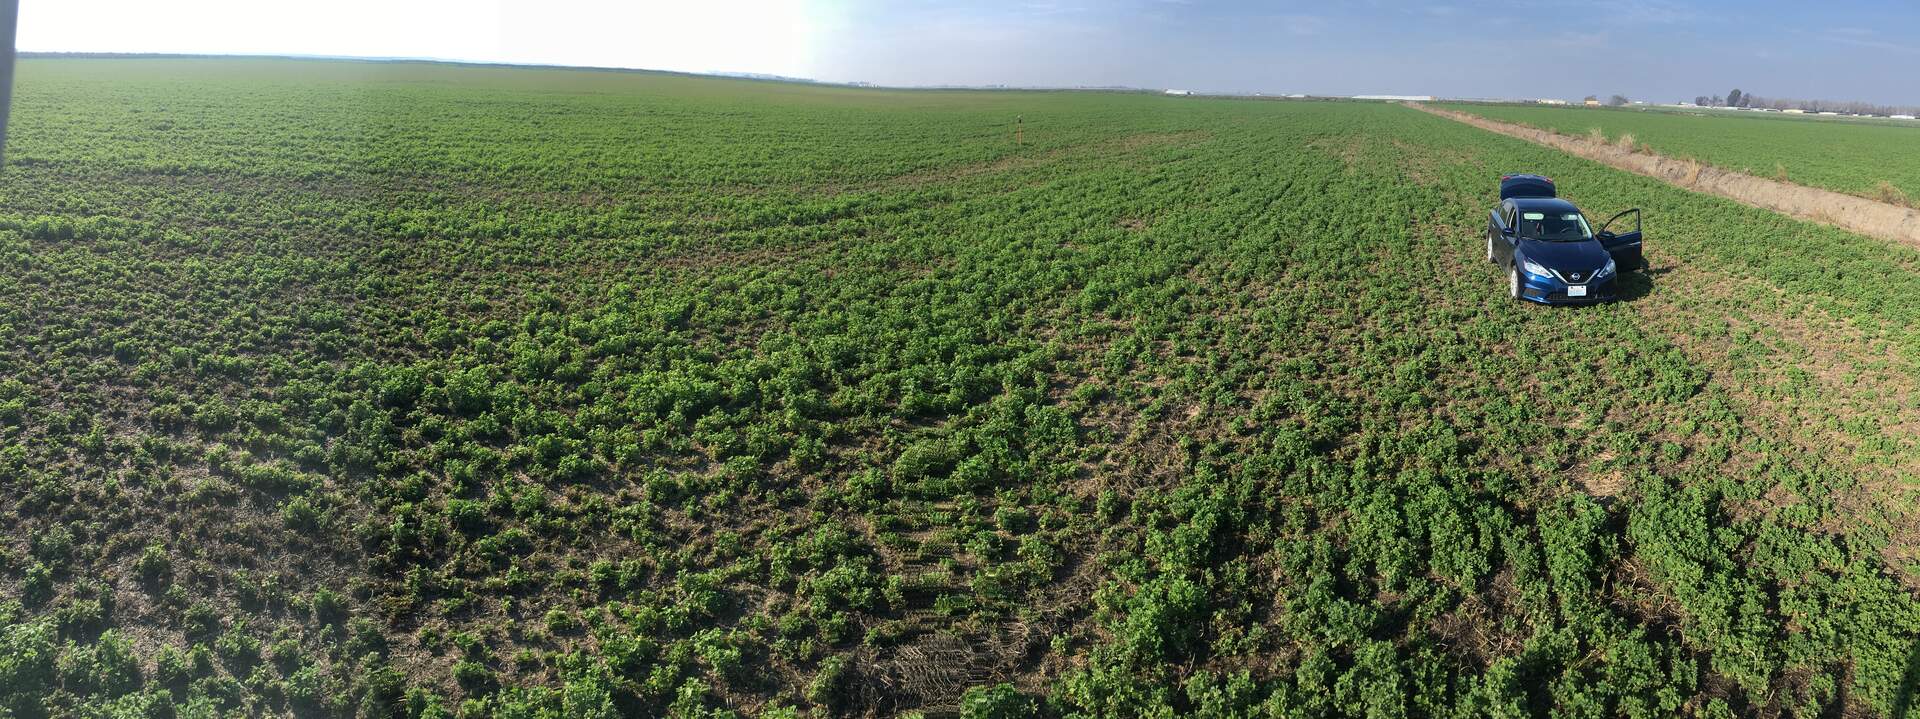
20220120BA_PatchyPano.jpg ( 2022-01-20 13:58:37 ) Full size: 1920x719
Patchy alfalfa north of the tower

bouldinalfalfa_2022_01_21_091506.jpg ( 2022-01-21 09:15:50 ) Full size: 1296x960
Flock of geese in flight
7 sets found
5 BA_flux graphs found
21 BA_met graphs found
6 BA_arable graphs found
Can't check TATWBABCSB_cam
Can't check MBSWEEWPBCBA
2 BA_processed graphs found
No data found for BA_adex.