
Field Notes
<--2021-11-18 15:15:00 | 2021-12-15 10:00:00-->Other sites visited today: West Pond
Phenocam link: Searching...
Gilbert Tract: 2021-11-30 09:30:00 (DOY 334)
Author: Daphne Szutu
Others: Ari, Dennis
Summary: Regular data collection/cleaning, visitors galore, super foggy in the morning, calibrated 7700, replaced 7550 temp dongle, first gamecam download, soil core in impounded marsh with Scott and McKenna
| 2021-11-30 Gilbert Tract Ari, Dennis, and I arrived at around 9:30 PST at the gate and waited for our bevy of visitors to arrive. Our visitors include Tara and Bronte from the SF Chronicle, Molly and Lawrence from DWR, Dylan and Jennica from the Delta Council, and Scott and Mckenna from USGS. SF Chronicle article: https://www.sfchronicle.com/climate/article/This-delta-wetland-restoration-will-help-16680372.php Scott and McKenna had brought a bunch of equipment to demonstrate for the visitors, including their "medium" transparent chamber that was around 3m tall, floating chamber, LGR, and soil cores. We got to the tower around 10:00 PST. It was foggy with low visibility when we arrived, but the fog gradually burned off around 11:00 and then it was sunny and warm. It was a still day, a rarity for a methane calibration day. The cattails have mostly died but some clumps of tule were still green. The grass on the levee has been mowed and is still a bright green. The tide was coming in while we were there. There was a lot of dew on the flux and rad sensors. Ari cleaned the sensors off. Several visitors climbed up to the top of the tower and Ari gave them a tour of all the sensors up there. Dennis topped off the wash reservoir water, which was mostly full. We checked out the game cam, which had about 15 video clips of otter activity, mostly at night. The camera was a bit high and we could only see the top part of the otters, so I moved the camera about half a meter farther back from the path. I moved the videos off of the card and put the blank card back in the camera and restarted it. I downloaded met, cam, and USB GHG data. I replaced the 7550 temperature dongle with another homemade one. I downloaded the miniDOT data and swapped the desiccant for the miniDOT and water level sensors. I changed the eddy clock from 11:34 to 11:36 and restarted logging afterwards. We calibrated the LI-7700 sn TG1-0424 and all the visitors were interested in what we were doing, lugging these 2 giant tanks into the field. I guess calibration makes for a good show--the giant tanks, long tubing, long cylindrical hood. The regulator on the zero air tank was reading <100psi, but there was enough zero air for the calibration. After zeroing, the concentration was stable around zero for 2 minutes, so I felt comfortable knowing the zero point was good. After the calibration, we swapped out the old desiccant bottle and put in another bottle with fresh, blue drierite. We usually flush the headspace out with zero air when doing this bottle swap, but I wanted to save the zero air for other calibrations today. The optics RH here was 22%, which isn't too bad yet, and the fresh drierite will probably dry it down before the next calibration. The following day after doing more calibrations, we realized probably the regulator was funky and the tank had more air than the regulator showed. After the calibration, we put the 7700 spiky hat back on and reattached the spray nozzle. I put the waders on and put the miniDOT back in the water. I checked on the sensor extension box Vona helped me install last month--still looks good. The post is not pounded in that deeply so it tilts, but it seems stable enough. I also picked up the flathead screwdriver we dropped last time by the well. Scott and McKenna took their chamber and LGR into the water to make a measurement south of our tower. They measured about 480ppm CO2 and 2.9ppm CH4, which matched our tower numbers. Bronte flew a drone to take photos/videos of their trek through the marsh. LI-7500 readings: CO2 563ppm around 10:15 PST, 470ppm around 11:30 PST H2O 240ppm T 14.1C (with new T dongle) P 102.2kPa SS 91 --> 99 after cleaning LI7700 readings: CH4 3.6ppm around 10:15 PST, 2.9ppm around 11:30 PST RSSI 42 --> 85 after cleaning Most of the visitors and Dennis left around 11:45. Since I thought we were running low on zero air, we took Scott up on his offer to take a soil core for us since they had all their equipment with them. Scott, Mckenna, Ari, and I drove to the impounded wetland on the north side of Gilbert Parcel. The water level was high enough that I wasn't able to go in with just my boots. The three of them put their waders on and walked into the marsh to take a soil core down to 130cm. (Approximate location: 38.0110, -121.6750) Ari will do her usual analysis on the soils and also send subsamples to Kuno for microbial analysis. Ari did not expect to take soil samples today so she had just sent a large soil shipment to Kuno the previous day. We borrowed Scott's small cooler to keep the soil samples cool during the rest of the day. Since Joe and I are coming back to finish the other Delta sites tomorrow, we will drop off the empty cooler tomorrow. Ari and I left around 14:00. |
2 photos found

20211130GT_AriScottMckenna.jpg ( 2021-11-30 13:04:43 ) Full size: 1920x1440
Blurry heads of Ari, Scott, and Mckenna taking a soil core in the impounded marsh area on the north side of Gilbert Tract.
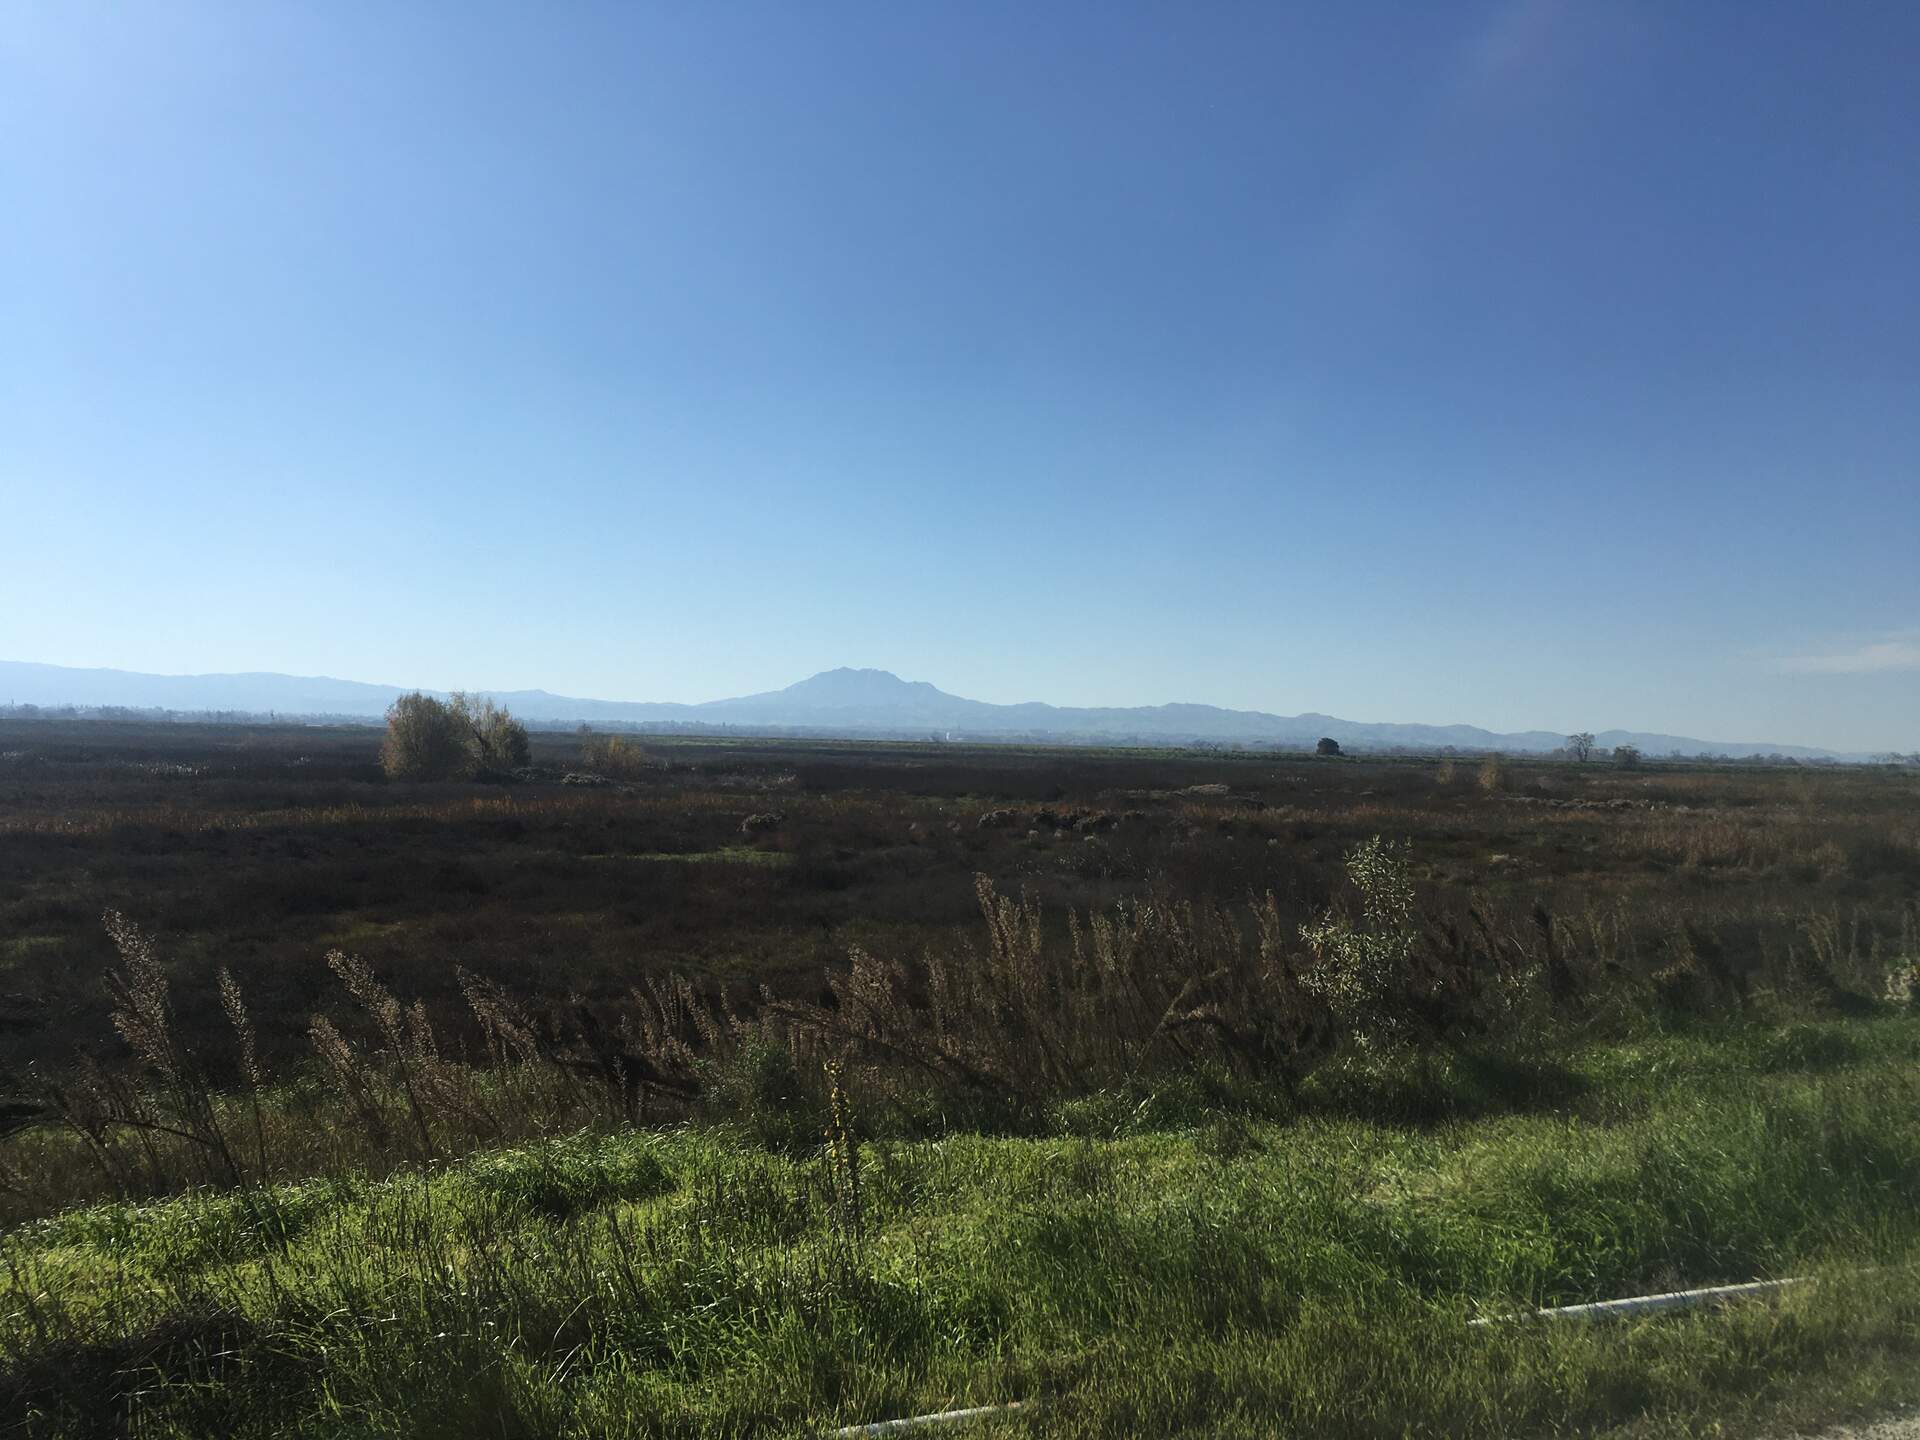
20211130GT_ImpoundedArea.jpg ( 2021-11-30 12:55:15 ) Full size: 1920x1440
Impounded marsh area on the north side of Gilbert Tract. Ari, Scott, and Mckenna took a soil core down to 130cm in this area.
8 sets found
Can't check MBWPEESWGT_mixed
Can't check MBEEWPSWEPGT_cam
16 GT_met graphs found
4 GT_flux graphs found
No data found for GT_adcp.
1 GT_cam graphs found
2 GT_usgs graphs found
2 GT_chanexo graphs found